File:ARACNe with t-test home gallery.PNG
Size of this preview: 800 × 577 pixels. Other resolutions: 320 × 231 pixels | 1,070 × 772 pixels.
Original file (1,070 × 772 pixels, file size: 278 KB, MIME type: image/png)
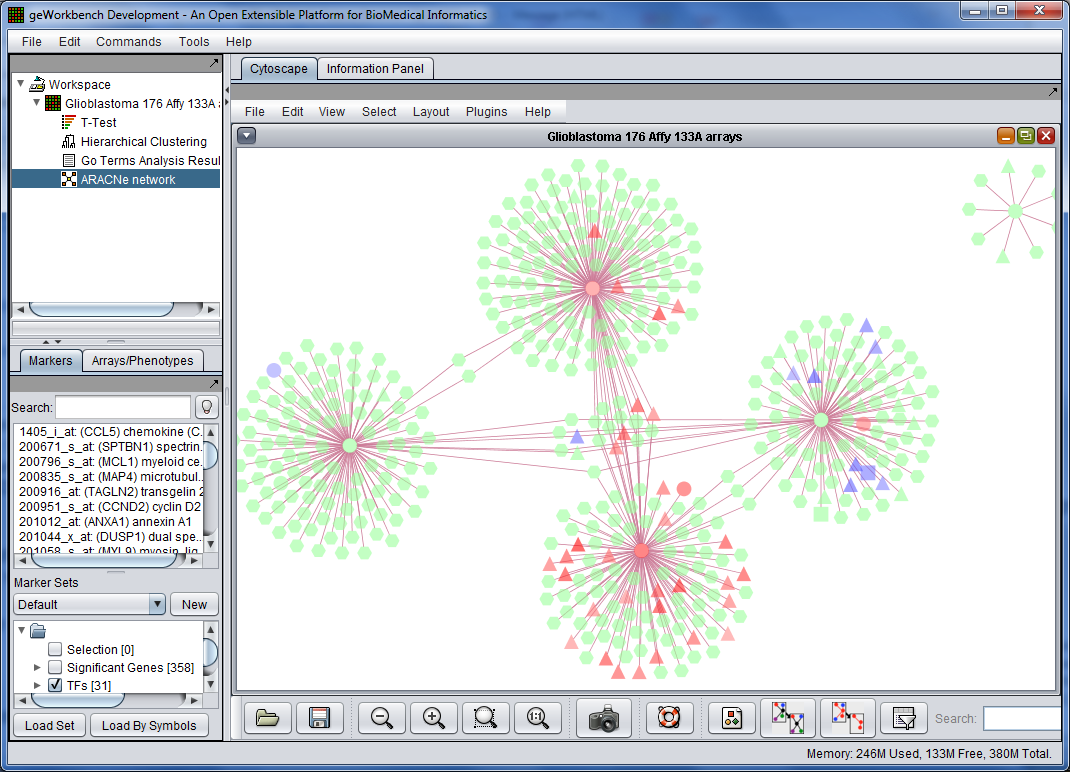
Regulatory network reconstructed using the ARACNe algorithm. Nodes represent genes and edges represent ARACNe-predicted interactions between transcription factors and their putative targets. The results of a prior differential expression analysis have been overlaid on the network and are shown as red and blue colored nodes (representing over- or under-expressed genes. Transcription factors whose set of predicted targets are enriched in differentially expressed genes are potentially involved in the regulation of the molecular program that implements the differential phenotype.
File history
Click on a date/time to view the file as it appeared at that time.
| Date/Time | Thumbnail | Dimensions | User | Comment | |
|---|---|---|---|---|---|
| current | 20:42, 14 July 2013 | | 1,070 × 772 (278 KB) | Floratos (talk | contribs) | Regulatory network reconstructed using the ARACNe algorithm. Nodes represent genes and edges represent ARACNe-predicted interactions between transcription factors and their putative targets. The results of a prior differential expression analysis have bee |
- You cannot overwrite this file.
File usage
There are no pages that link to this file.
