Plugins
The geWorkbench platform employs a component repository infrastructure to manage a large collection of pluggable components that can be used to customize the application's graphical user interface. This (ever growing) list of plug-in components covers a wide range of fucntionality for a number of different genomic data modalities.
The Status of the pluggable components below is defined as:
| Status | Comment |
|---|---|
| (a) Released | This plugin is part of the latest geWorkbench version. |
| (b) Development | This plugin is currently actively being developed. |
Contents
Analysis
| Plugin | Status | Description |
|---|---|---|
| ANOVA | Released | Analysis of Variance - detection of significant differences in expression between more than two groups. (Screenshot) |
| Evidence Integration | Development | A sequence and structure-based approach for functional annotation and protein-protein interaction analysis. |
| GSEA | Released | The Gene Set Enrichment Analysis determines whether an a priori defined set of genes shows statistically significant differences between two phenotypes. |
| Hierarchical Clustering | Released | Clustering of markers and microarrays into hierarchical binary trees. The resulting structures can be visualized in the Dendrogram plugin. (Screenshot) |
| KNN | Released | k-Nearest Neighbors analysis (a GenePattern component). |
| MatrixReduce | Released | Transcription Factor binding motifs. (Screenshot) |
| MEDUSA | Development | The Motif Element Detection Using Sequence Agglomeration is an integrative method for learning motif models of transcription factor binding sites by incorporating promoter sequence and gene expression data (Leslie Lab, MSKCC). |
| MRA | Released | Master Regulator Analysis combines regulatory information from interaction networks with differential expression analysis. (Screenshot) |
| PCA | Released | Principal Component Analysis (a GenePattern component). |
| SOM | Released | Clustering of markers using Self Organizing Maps. The resulting clusters can be visualized in the SOM Clusters Viewer plugin. (Screenshot) |
| SVM 3.0 | Released | The Support Vector Machine is a supervised classification method that computes a maximal separating hyperplane between the expression vectors of different classes or phenotypes (a GenePattern component). |
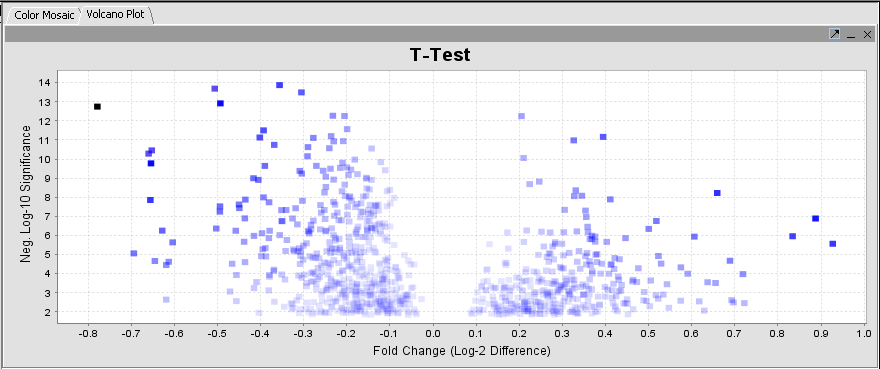
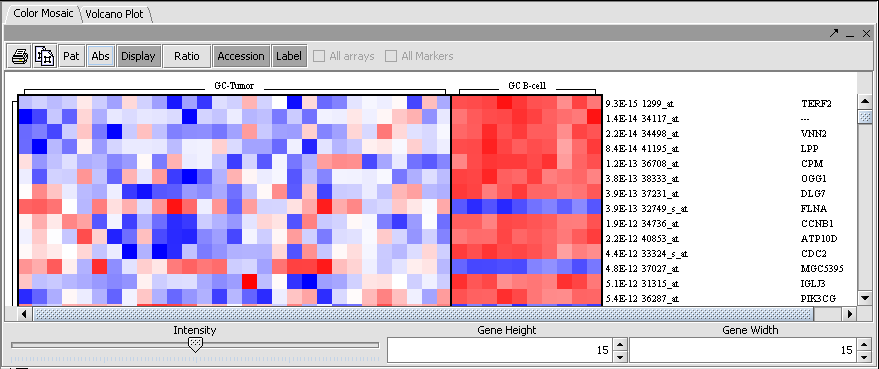
| T-Test | Released | Identification of markers with statistically significant differential expression between sets of microarrays. (Screenshot Plot, Screenshot Mosaic) |
| Weighted Voting | Released | Weighted Voting Analysis (a GenePattern component). |
Annotation
| Plugin | Status | Description |
|---|---|---|
| caScript | Development | An Editor. |
| Dataset History | Released | Log of data transformations induced by data-modifying operations. |
| Experiment Information | Released | Microarray machine parameters used in an experiment run. If available, high-level experiment information (e.g., purpose of of experiment) are also displayed. |
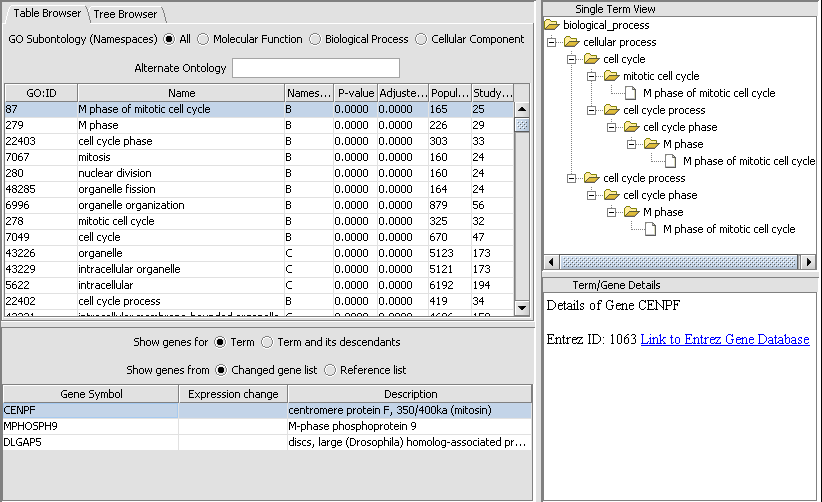
| Gene Ontology Enrichment | Released | Enrichment analysis of selected groups of genes against Gene Ontology (http://www.geneontology.org) annotations. (Screenshot) |
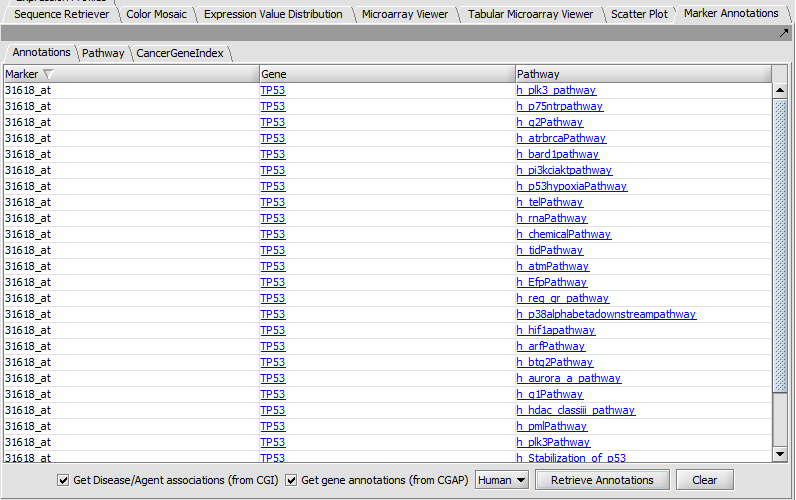
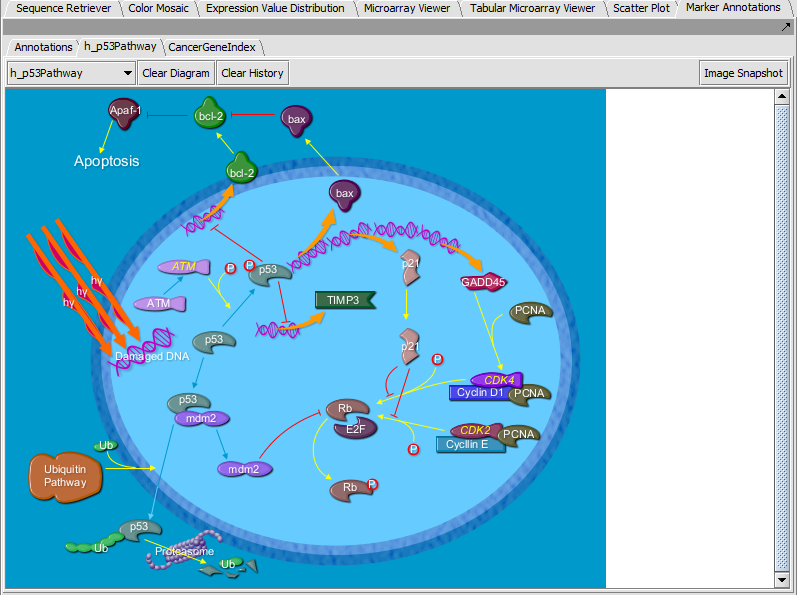
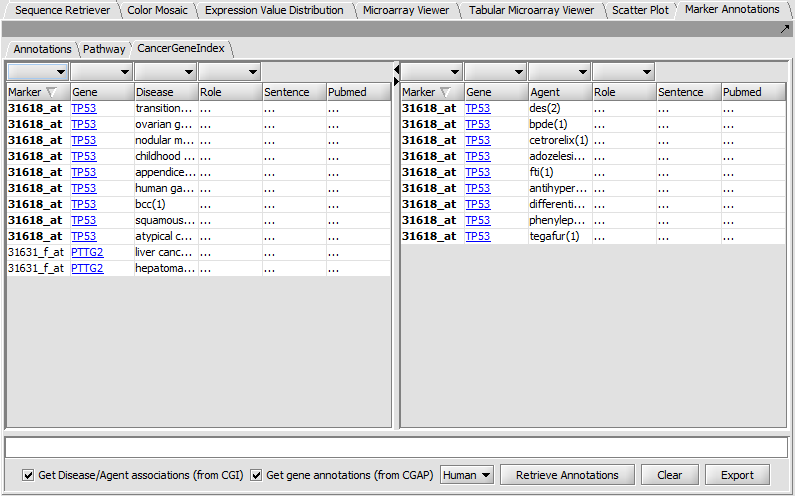
| Marker Annotations | Released | Retrieval of gene and pathway information for markers on a microarray (caBIO Pathways/Cancer Gene Index); it includes visualization of BioCarta pathway diagrams. (Screenshot Table, Screenshot BioCarta, Screenshot CGI) |
Data Filtering
| Plugin | Status | Description |
|---|---|---|
| Affy Detection Call Filter | Released | Filtering of measurements based on the value of their "detection call" attribute (Affymetrix data only) . |
| Deviation Filter | Released | Filtering of markers with low dynamic range. |
| Expression Threshold Filter | Released | Elimination of measurements that fall outside a range of explression values. |
| 2-channel Threshold Filter | Released | Same as "Expression Threshold" filter but different threshold ranges can be specified for each channel (GenePix data only). |
| Genepix Flag Filter | Released | Filtering of measurements based on the value of their "Flags" attribute (GenePix data only). |
| Missing Value Filter | Released | Discards all markers that have missing measurements in more than a user specified number N of microarrays. |
Data Management
| Plugin | Status | Description |
|---|---|---|
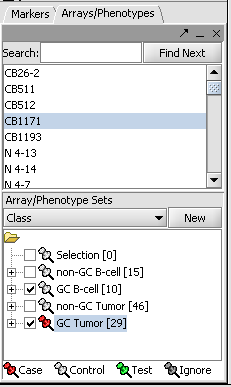
| Arrays/Phenotypes | Released | Definition of data views consisting of microarray subgroups. The views control the amount of data displayed. (Screenshot) |
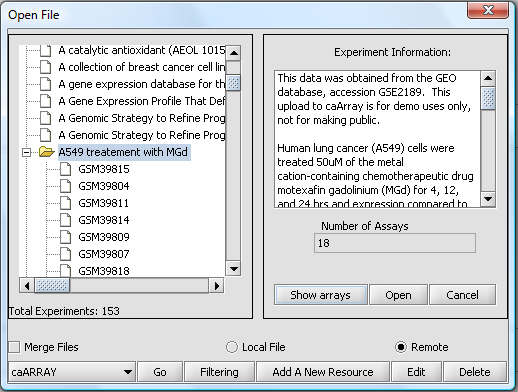
| caArray | Released | Search and download of gene expression data from instances of caArray (NCI microarray database product). (Screenshot) |
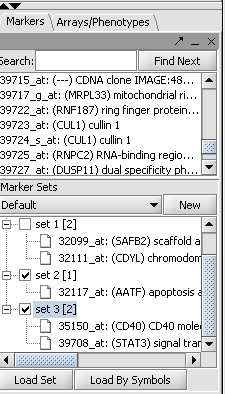
| Markers | Released | Definition of data views consisting of marker subgroups. The views control the amount of data displayed. (Screenshot) |
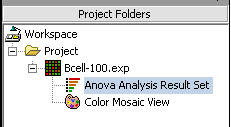
| Project Folders | Released | Manages projects and workspaces of the user. (Screenshot) |
File Import
| Plugin | Status | Description |
|---|---|---|
| Affymetrix CEL | Released | Loads Affymetrix probe CELl intensity files ("*.cel"). |
| Affymetrix File Matrix | Released | Loads Affymetrix EXPperiment files ("*.exp"). |
| Affymetrix MAS5/GCOS | Released | Loads output files from the GeneChip Operating Software formerly known as MAS5 Statistical algorithm (several different file extension). |
| FASTA Format | Released | Loads files that are in FASTA format ("*.fasta" and "*.txt"). |
| Genepix File Format | Released | Loads files in GenePix Result format ("*.gpr"). |
| PDB Structure Format | Released | Loads files in the Protein Data Base format ("*.pdb") |
| Tab-delimited (RMA Express Format) | Released | Loads tab-delimited files from the Robust Multichip Analysis ("*.txt") |
Menu Tools
| Plugin | Status | Description |
|---|---|---|
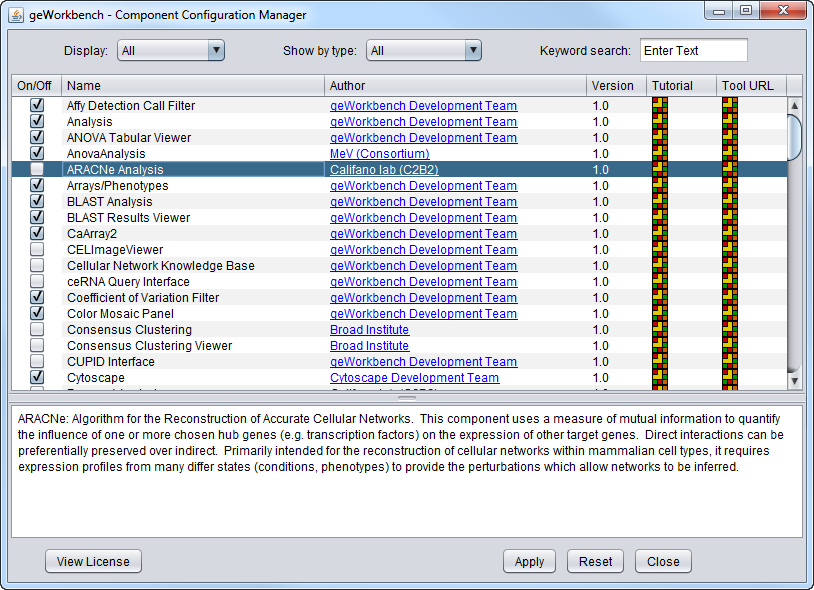
| CCM | Released | The Component Configuration Manager allows users to manage plugins dynamically at any given time in the application environment. (Screenshot) |
| genSpace | Released | It logs information about the analysis tools used in geWorkbench in order to enable collaboration support for the geWorkbench users. |
| Online Help | Released | geWorkbench Online Help uses the Java help 2.0 system to provide real-time help on component questions. |
| Preferences | Released | Allows users to predefine a few basic visual settings and choose a Text Editor. |
| Version Information | Released | Provides basic information about the currently installed user version of geWorkbench. |
| Welcome Screen | Released | Introduction to geWorkbench during the initial opening of the application. |
Network Generation
| Plugin | Status | Description |
|---|---|---|
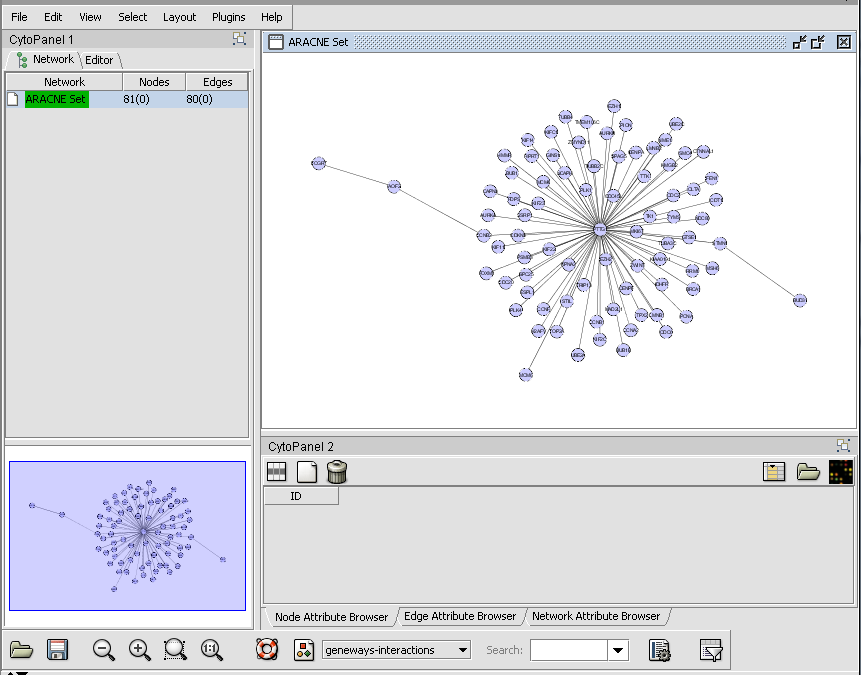
| ARACNe | Released | The Algorithm for the Reconstruction of Accurate Cellular Networks analyses large amount of microarray data (typically 100-500 microarrays) to reverse engineer underlying gene regulatory networks. (Screenshot) |
| Cancer GEMS | Development | Interface to the NCI Cancer Genetic Markers of Susceptibility project. |
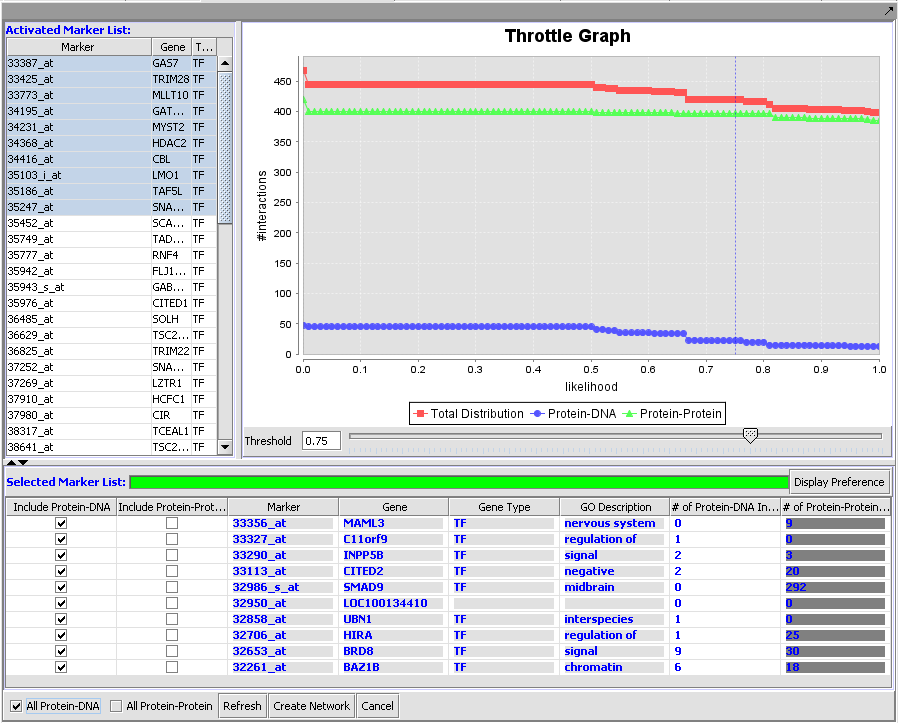
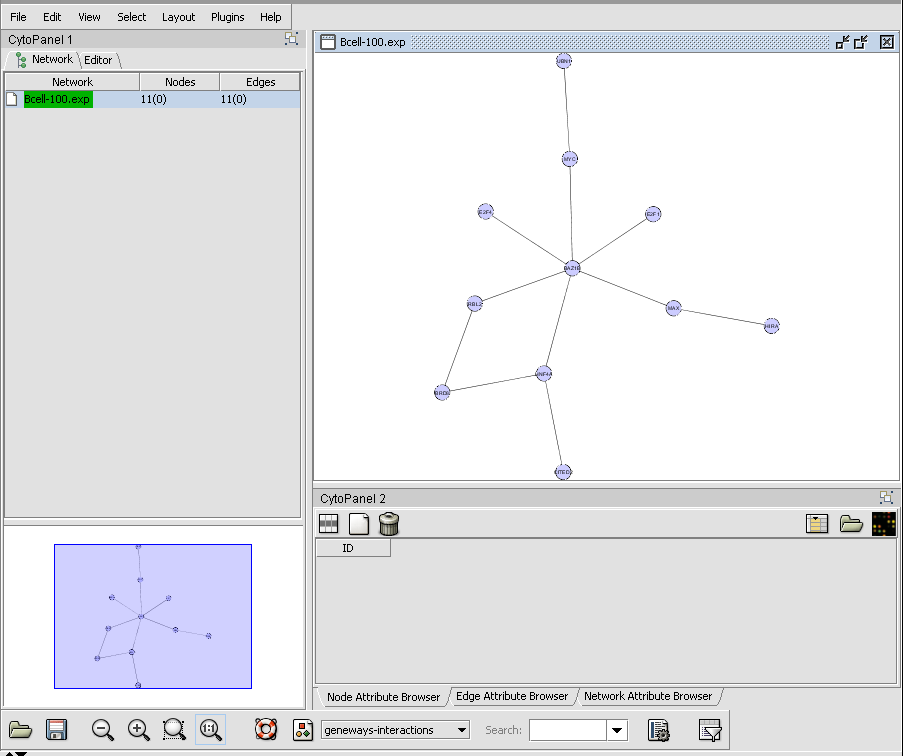
| CNKB | Released | The Cellular Networks Knowledge Base queries an in-house repository of locally generated B-cell interaction network data and information from external databases in order to build a network of interactions for selected genes. (Screenshot Throttle Graph, Screenshot Network) |
| Cytoscape | Released | Visualization of gene regulatory network created in Reverse Engineering using Cytoscape 1.0. (Screenshot) |
| MINDy | Released | The Modulator Inference by Network Dynamics algorithm extends ARACNe to include detecting the influence of modulators of transcription factor activity. |
| NetBoost | Development | NetBoost is a network characterization algorithm. |
Normalization
| Plugin | Status | Description |
|---|---|---|
| Array-Based Centering | Released | Subtraction of the mean or median measurement of a microarray from every measurement in that microarray. |
| Housekeeping Normalizer | Released | Normalization of all measurements in a microarray through division by the average expression value of a (user defined) set of housekeeping genes. |
| Log2 Normalizer | Released | Applies a log2 transformation to all measurements in a microarray. |
| Marker-Based Centering | Released | Subtraction of the mean or median measurement of a marker profile from every measurement in the profile. |
| Mean-Variance Normalizer | Released | Transformation of expression measurements to standard units: for every marker, the mean measurement of the marker profile (across all microarrays in an experiment) is subtracted from each measurement in the profile and the resulting value is divided by the standard deviation of the profile. |
| Missing Value Normalizer | Released | Replacement of missing values with consensus values. |
| Quantile Normalizer | Released | Expression measurements in each microarray are adjusted so that the distribution of values is the same across all microarrays in an experiment. |
| Threshold Normalizer | Released | Adjustment of values that fall outside a user-specified threshold. |
Protein Structure Analysis
| Plugin | Status | Description |
|---|---|---|
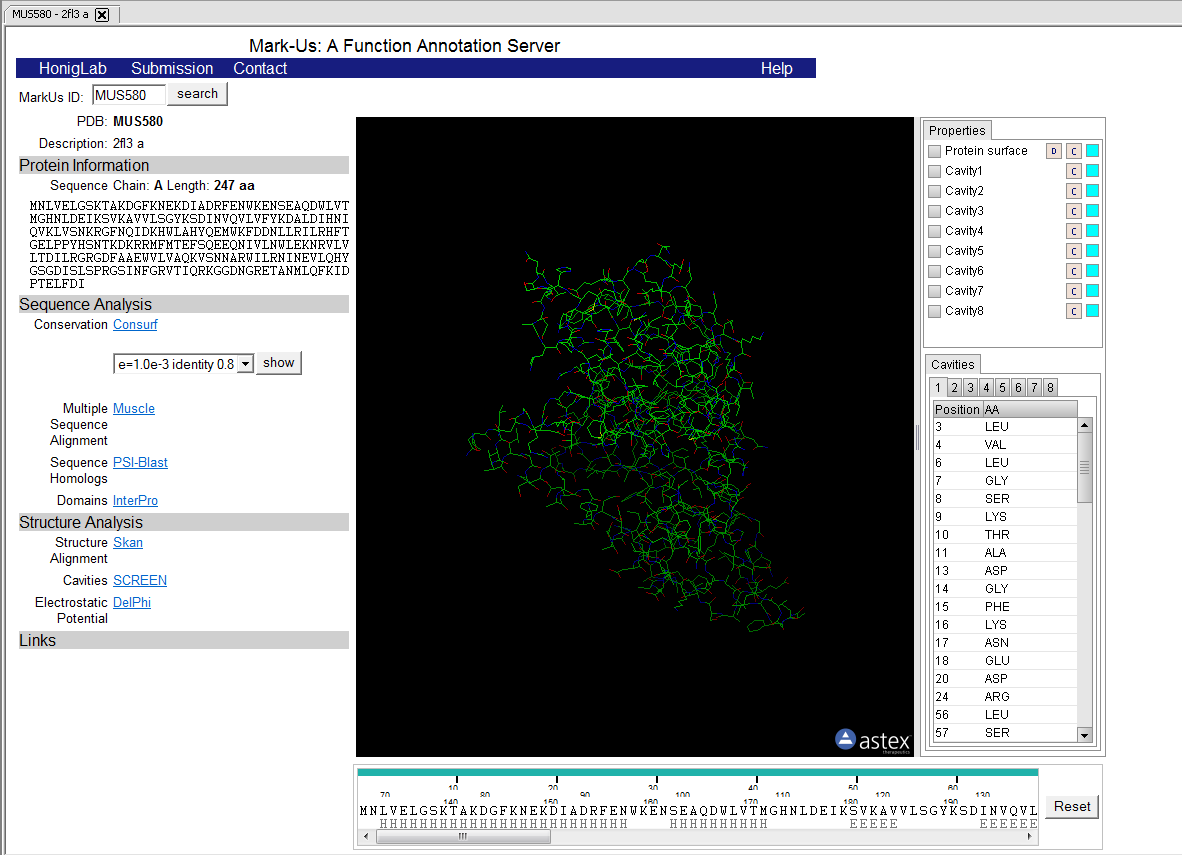
| MarkUs | Released | Assesses the biochemical function for a given protein structure. (Screenshot) |
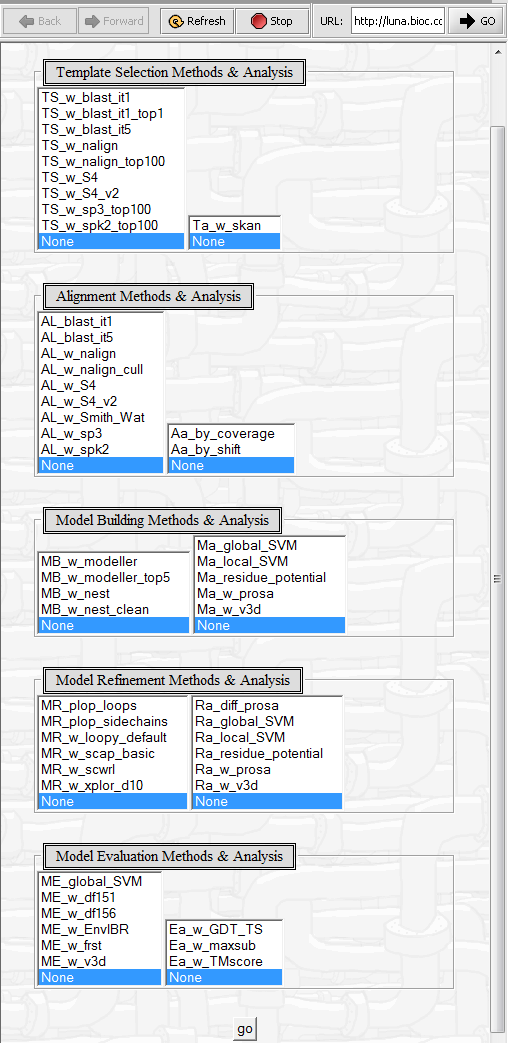
| Pudge | Released | Computational protein structure prediction using sequence homology. It integrates tools used at different stages of the structural prediction process. (Screenshot Parameters, Screenshot Result) |
| SkyBase | Released | Database of protein structure models produced by SkyLine based on structures solved by the NESG structural genomics consortium. |
| SkyLine | Released | Automated high-throughput pipeline for reverse homology-based comparative protein structure modeling based on the input template structure. |
Sequence Analysis & Visualization
| Plugin | Status | Description |
|---|---|---|
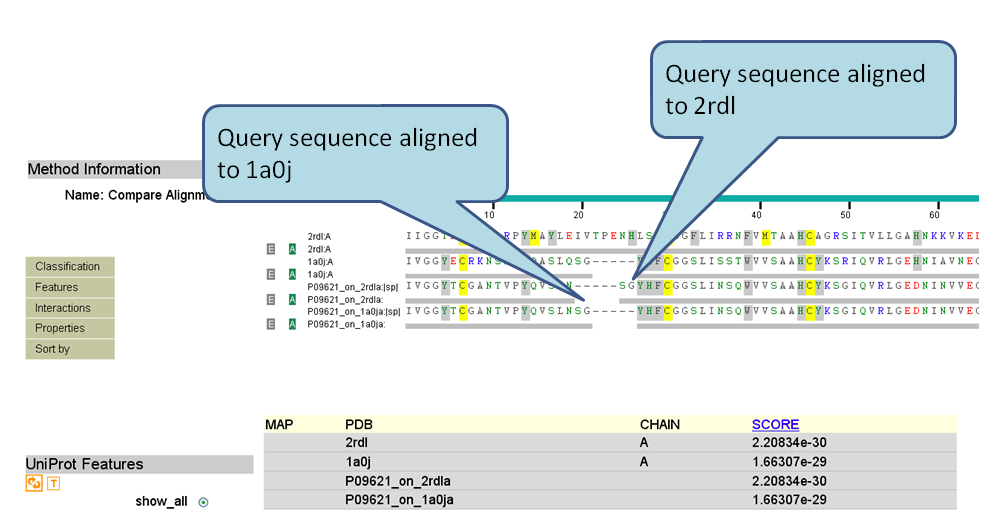
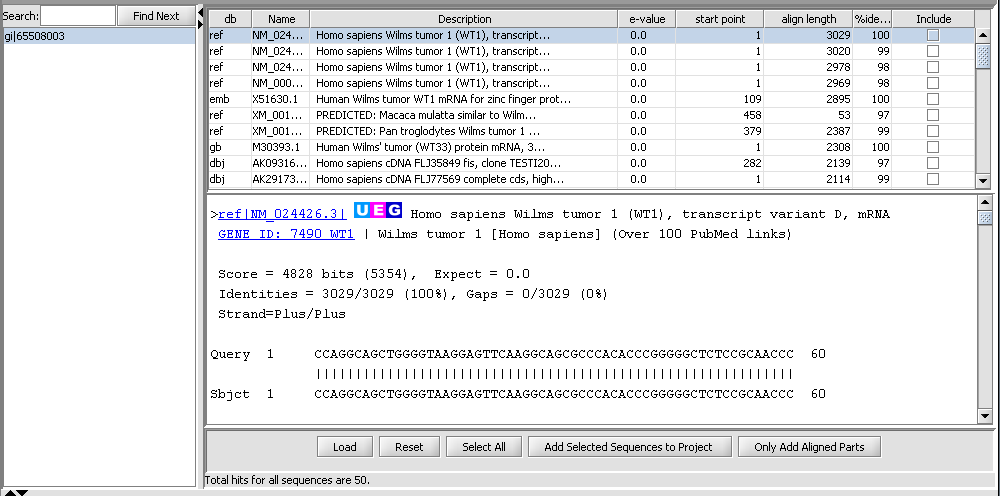
| Alignment Results | Released | It parses and displays the results of sequence similarity searches which were run on the NCBI BLAST service. (Screenshot) |
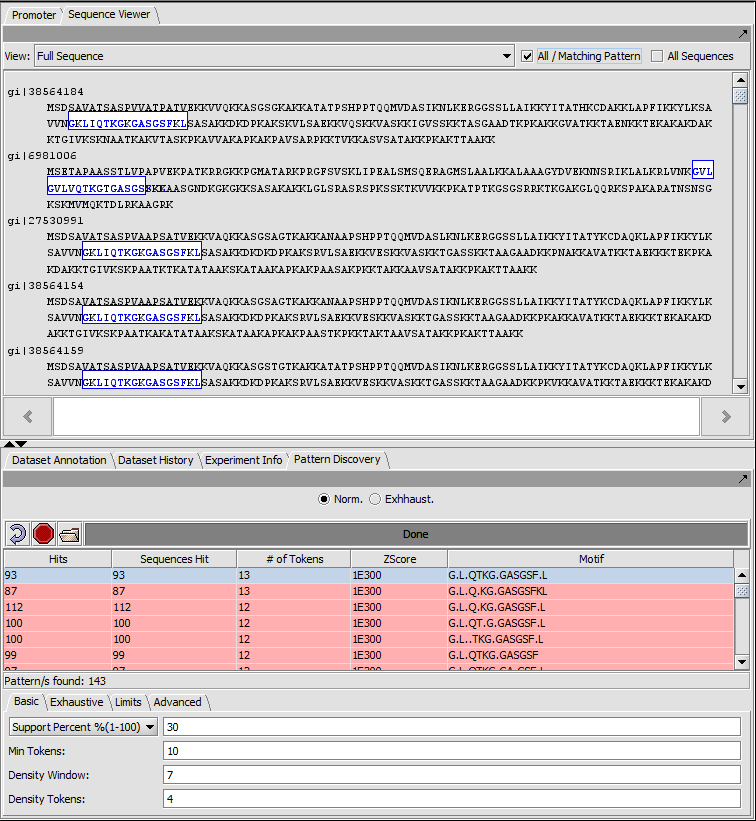
| Pattern Discovery | Released | Discovery of sequence motifs in sets of DNA and protein sequences. (Screenshot) |
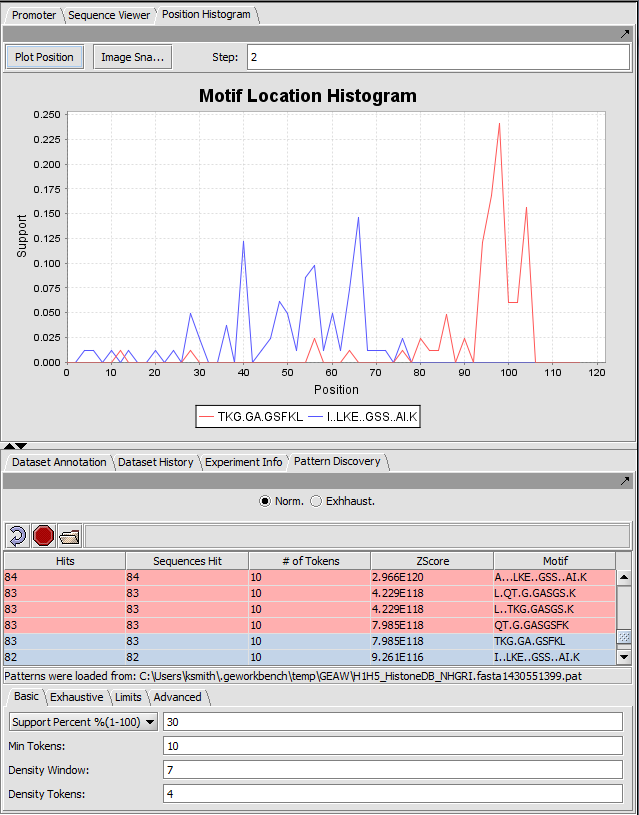
| Position Histogram | Released | Visualization of results from the Pattern Discovery plugin. Motif/pattern support is plotted against relative sequence position of the motif match. (Screenshot) |
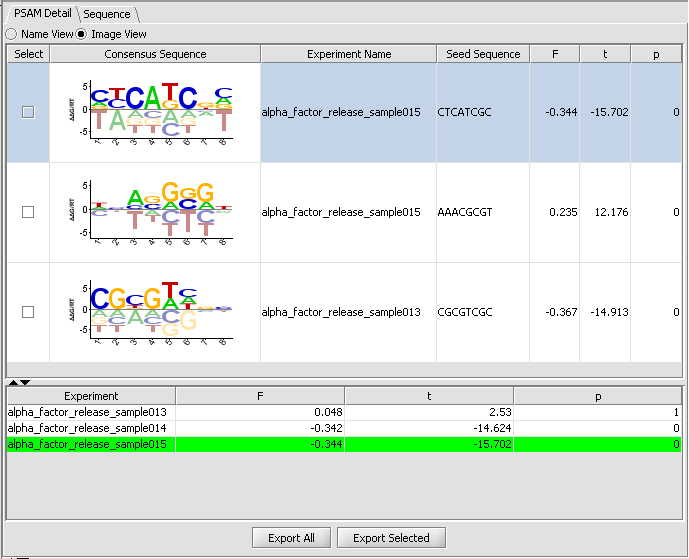
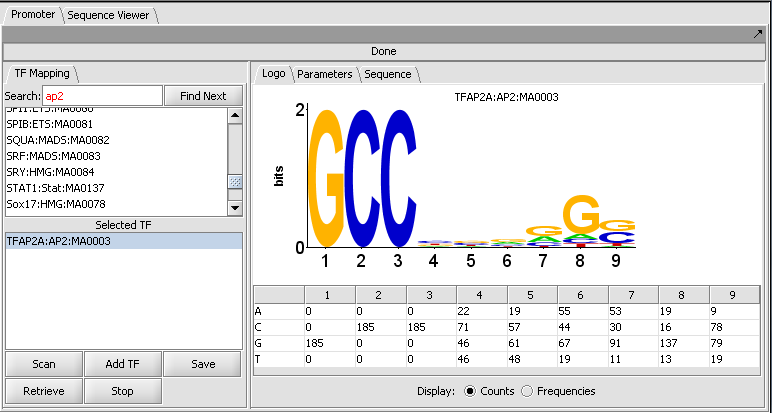
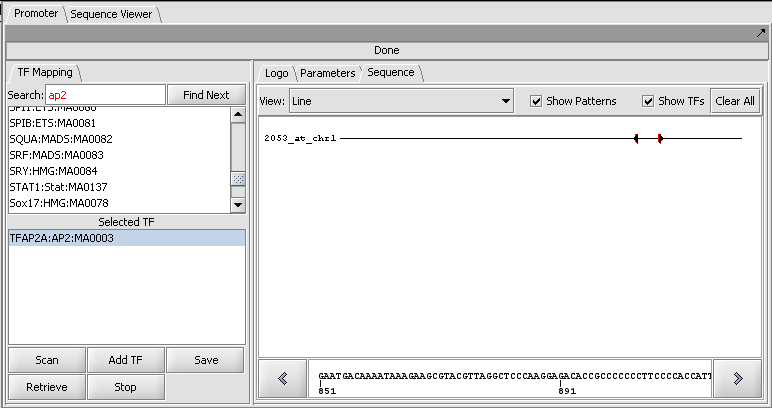
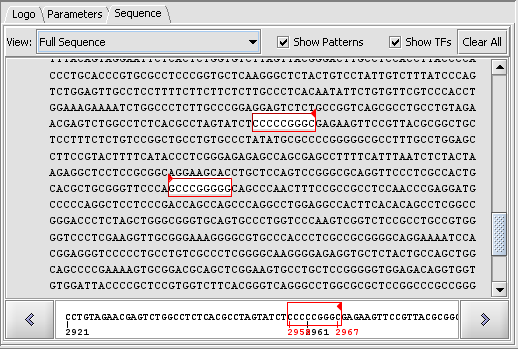
| Promoter Analysis | Released | Identification of putative transcription factor binding sites in DNA sequences. The analysis use the profiles in the JASPAR Transcription Factor Binding Profile Database. (Screenshot Logo, Screenshot Sequence 1, Screenshot Sequence 2) |
| Sequence Alignment | Released | Run jobs on the NCBI BLAST servers directly within geWorkbench. |
| Sequence Panel | Released | Visualization of results from the Pattern Discovery plugin, displaying the motif match location over each sequence from the input data set. |
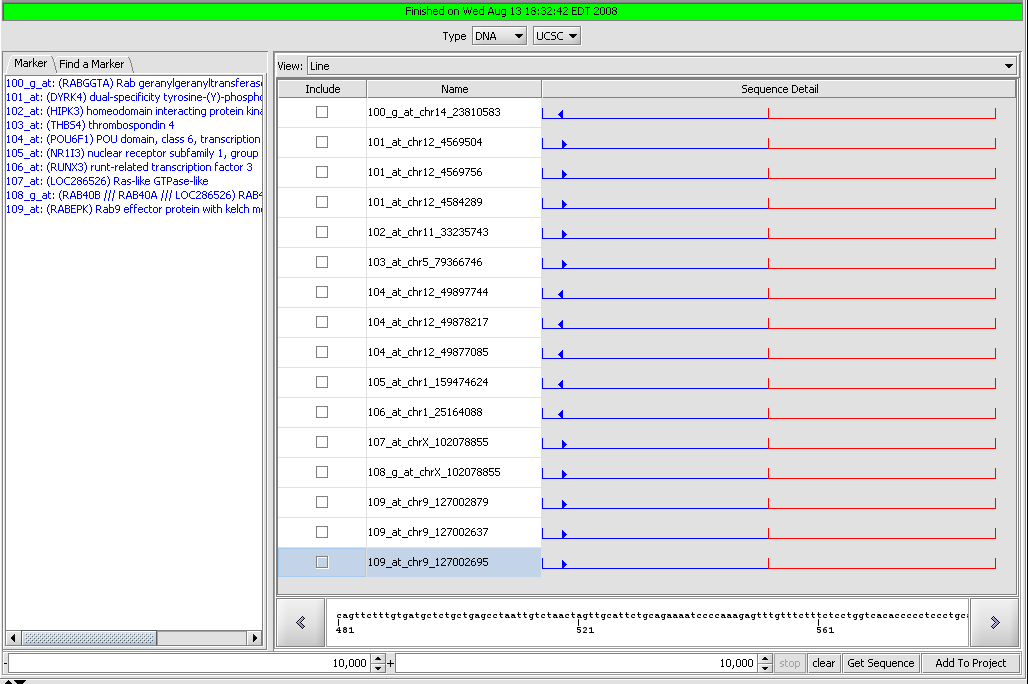
| Sequence Retriever | Released | Retrieve sequences for annotated markers from Santa Cruz (Nucleotides) and EBI (Proteins). (Screenshot) |
Visualization
| Plugin | Status | Description |
|---|---|---|
| Analysis Panel | Released | Framework to support numerous, individually loadable analysis methods. |
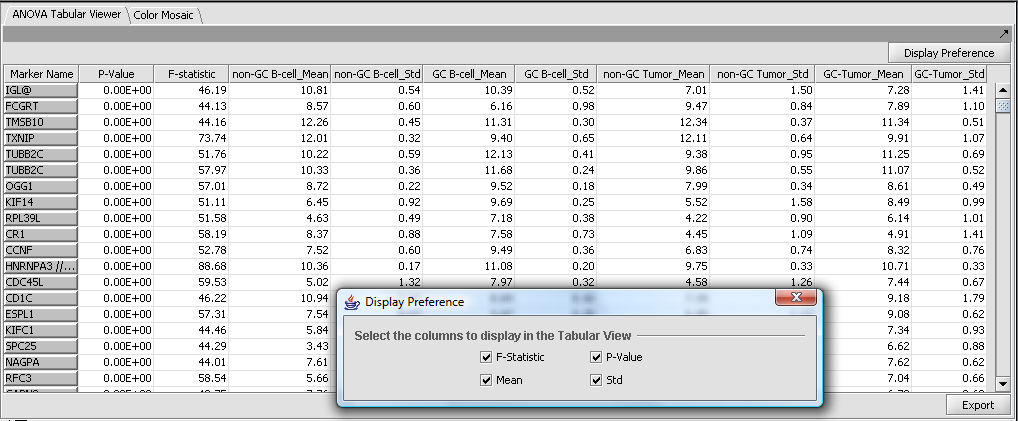
| ANOVA Tabular Viewer | Released | Displays the results of ANOVA analysis of gene expression data in tabular format. (Screenshot) |
| CEL Image Viewer | Released | Visualization of data in Affymetrix CEL files. (Screenshot) |
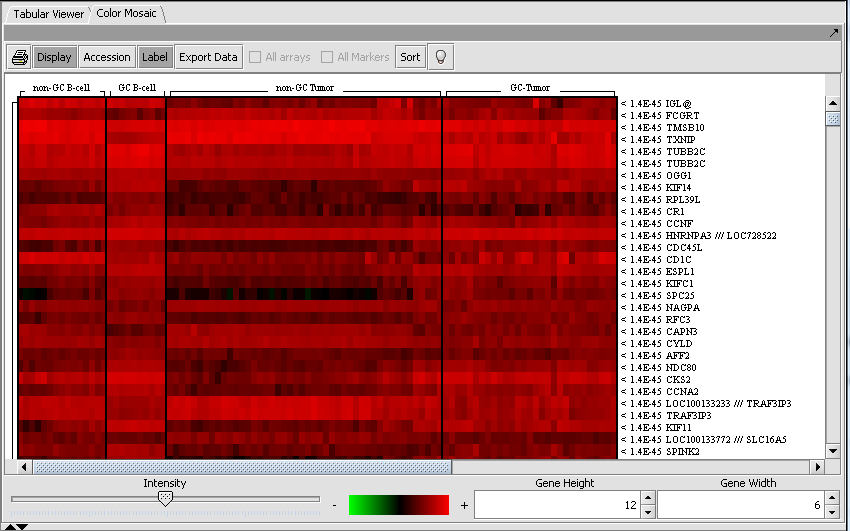
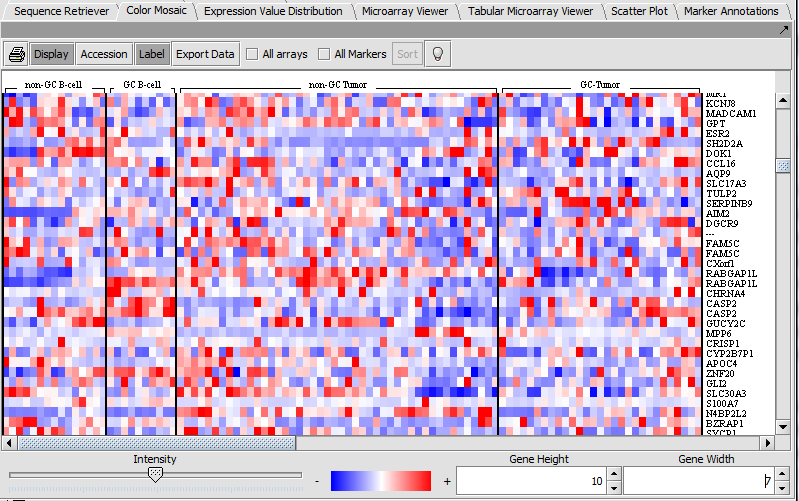
| Color Mosaic | Released | Heat maps for microarray expression data, organized by phenotypic or gene groupings. (Screenshot) |
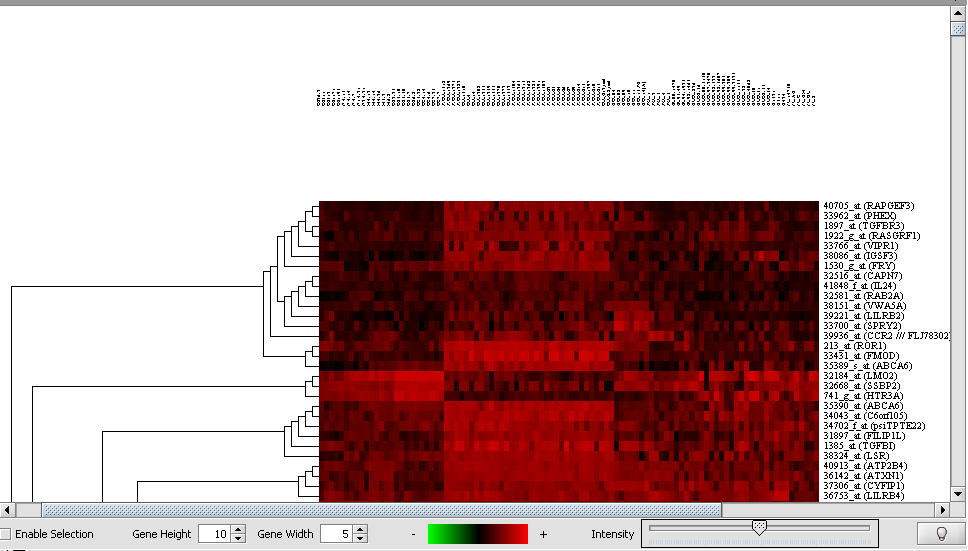
| Dendrogram | Released | Tree-structured diagrams reflecting the results of hierarchical clustering analysis. (Screenshot) |
| Evidence Integration Viewer | Development | Displays the results of the Evidence Integration analysis. |
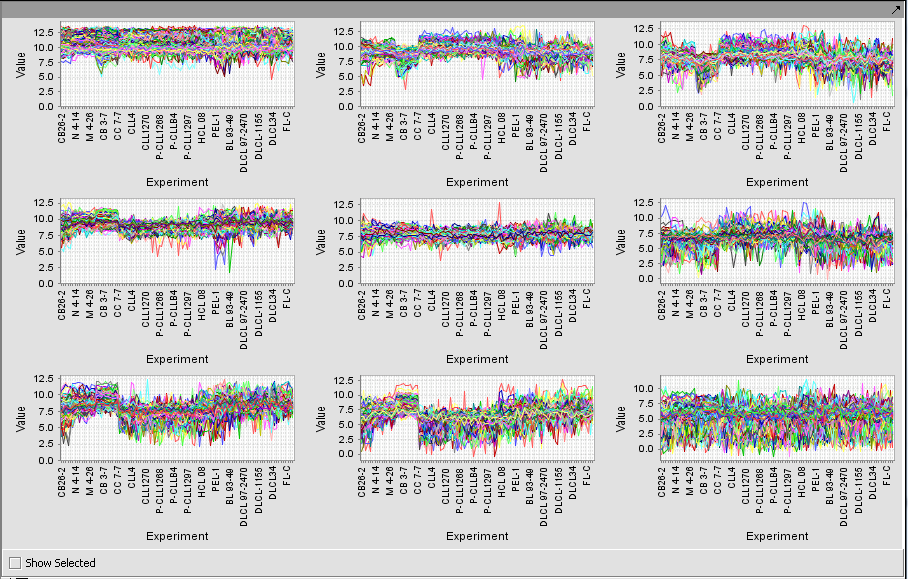
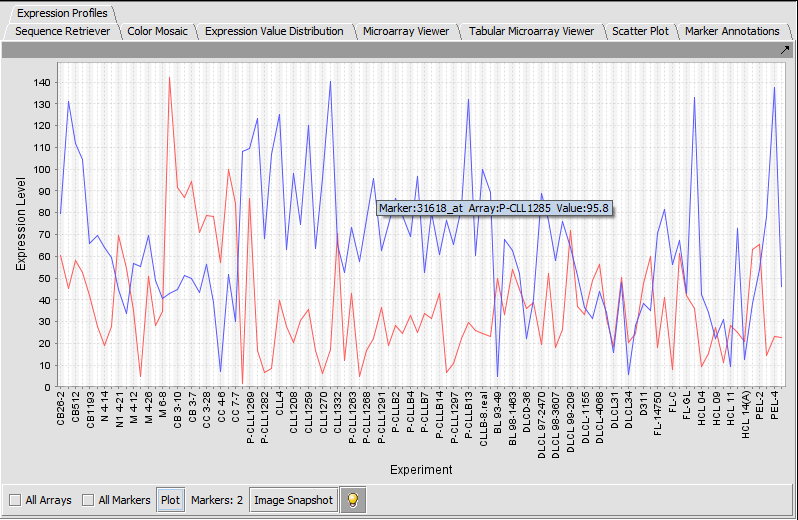
| Expression Profiles | Released | Line graph of genes expression profiles across several arrays/ hybridizations. (Screenshot) |
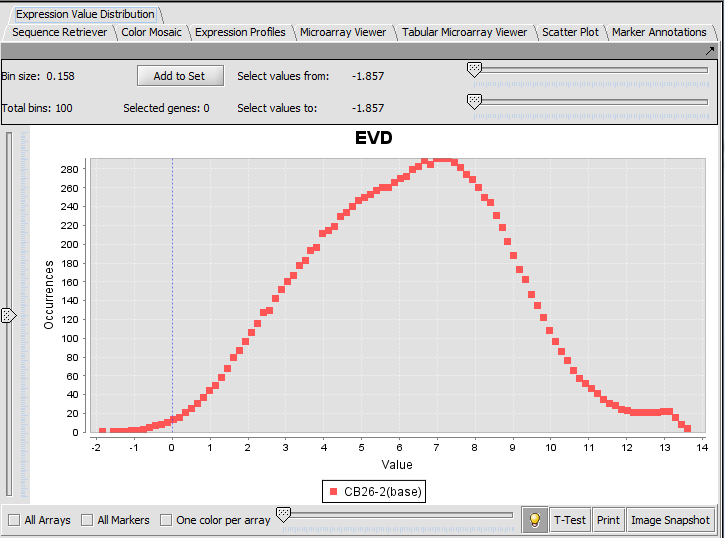
| Expression Value Distribution | Released | Distribution plot of marker expression values across one or more microarrays. (Screenshot) |
| GeneWays | Released | An essential component needed to display elements in Cytoscape and ARACNe. |
| GO Terms Viewer | Released | Displays the results of Gene Ontology Enrichment Analysis. (Screenshot) |
| Image Viewer | Released | Visualization of screenshots saved within geWorkbench (e.g. dendrograms). |
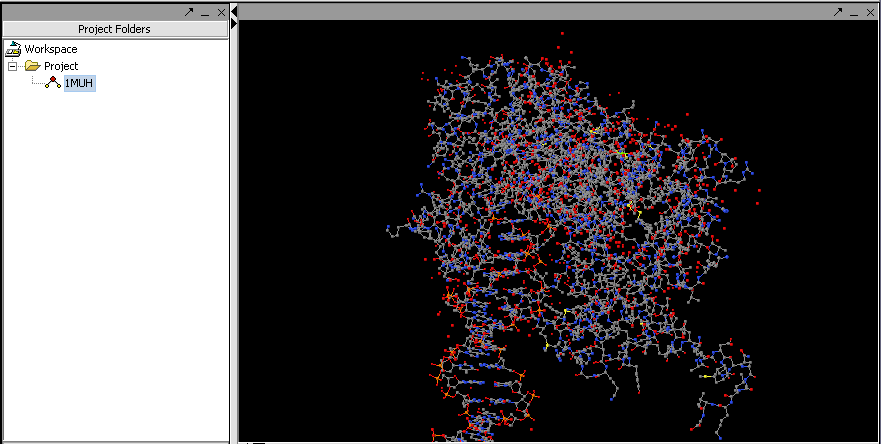
| Jmol | Released | Visualization of 3D protein structures from PDB files. (Screenshot) |
| Mark-Us Browser | Released | Displays the results of a Mark-Us analysis. (Screenshot) |
| MatrixReduce | Released | Visualization of MatrixReduce calculations using logo, chromosomal and tabular displays. |
| MEDUSA Viewer | Development | Displays the results of a MEDUSA analysis. |
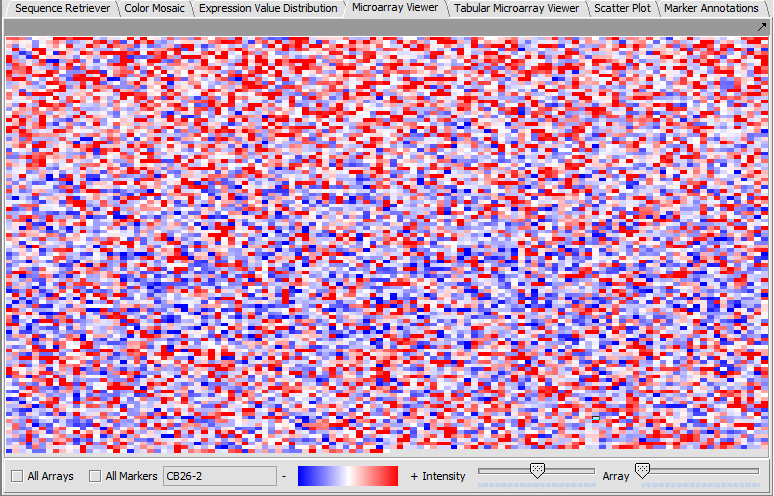
| Microarray Viewer | Released | Color-gradient representation of gene expression values. (Screenshot) |
| MINDy Viewer | Released | The results of a MINDy calculation are presented in several different tabular displays and a heat map. |
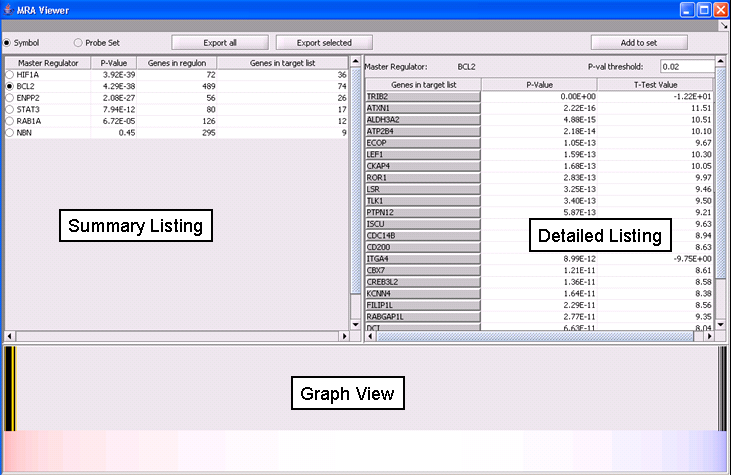
| MRA Viewer | Released | Displays the results of the MRA in tablular and graphical form. (Screenshot) |
| NetBoost Viewer | Development | Displays a Boosting Iteration Graph, Confusion Matrix and Score Table from NetBoost Analysis. |
| Normalization Panel | Released | Framework to support numerous, individually loadable normalization components. |
| PCA Viewer | Released | Displays PCA results. |
| Pudge Browser | Released | Visualization of Pudge results. (Screenshot Parameters, Screenshot Result) |
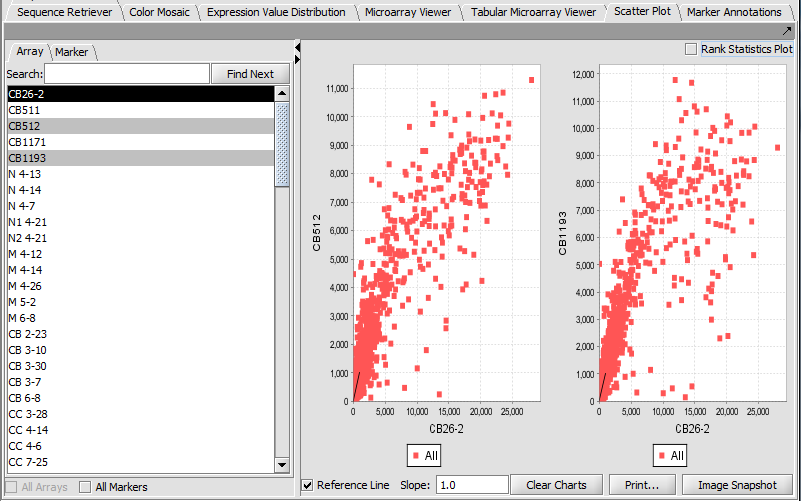
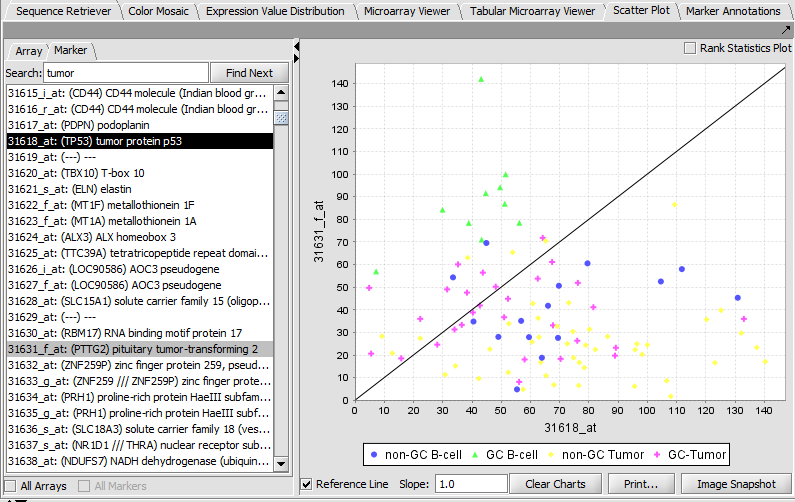
| Scatter Plot | Released | Pairwise (array vs. array and marker vs. marker) comparison and plotting of expression values. (Screenshot Array, Screenshot Marker) |
| SkyBase Viewer | Released | Displays the results from the SkyBase search. |
| SkyLine Output All | Released | Displays all models from the Skyline modeling. |
| SkyLine Output Each | Released | Displays each model from the Skyline modeling. |
| SkyLine Contour | Development | A 2D dominance-based visualization of query results. |
| SOM Clusters Viewer | Released | Visualization of gene clusters produced by the self-organizing maps analysis. (Screenshot) |
| SVM Viewer | Released | Visualizes results obtained from classifying samples based on SVMs generated using the Gene Pattern v3 SVM service. |
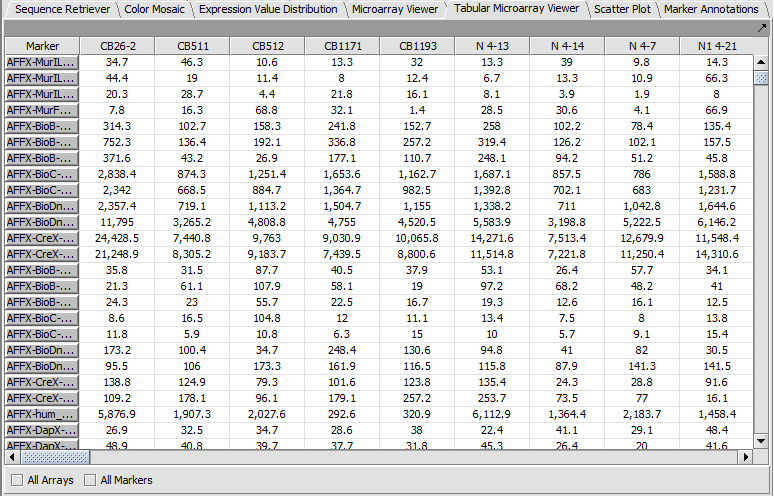
| Tabular Microarray Viewer | Released | Spreadsheet view of all expression measurement in an experiment, one row per individual marker/probe and one column per microarray. (Screenshot) |
| Volcano Plot | Released | Visualize fold-change vs significance (P-value) for t-test results. (Screenshot) |
