Difference between revisions of "Analysis Framework Previous"
(Created page with " =Layout in versions 2.3.0 to 2.4.1= Image:Project_Folders_Analysis_ANOVA.png Image:ANOVA_Parameters_w.png ==Layout of the analysis framework (prior to geWorkbenc...") |
(→Layout of the analysis framework (prior to geWorkbench 2.3.0)) |
||
| (6 intermediate revisions by the same user not shown) | |||
| Line 1: | Line 1: | ||
| + | =Layout in versions 2.3.0 to 2.4.1= | ||
| + | [[Image:GeWorkbench_2.3.0_Main_GUI_MicroarrayViewer.png|{{ImageMaxWidth}}]] | ||
| − | + | Versions of geWorkbench prior to 2.5.0 had an additional layer of data organization, called the "Project", within the Workspace. The user could define any number of separate projects. | |
[[Image:Project_Folders_Analysis_ANOVA.png]] | [[Image:Project_Folders_Analysis_ANOVA.png]] | ||
| − | + | These versions also provided the analysis components with a way to override any activated marker are or array set, in the form of the "All Arrays" and "All Markers" checkboxes, at the bottom of each component. | |
| Line 13: | Line 15: | ||
==Layout of the analysis framework (prior to geWorkbench 2.3.0)== | ==Layout of the analysis framework (prior to geWorkbench 2.3.0)== | ||
| + | |||
| + | The graphical user interface for geWorkbench is divided into four major sections, for | ||
| + | |||
| + | # Data management - Workspace and Projects (upper left) | ||
| + | # Visualization tools (upper right) | ||
| + | # Marker and Array/Phenotype set selection and management (lower left) | ||
| + | # Analytical tools (lower right) | ||
| + | |||
| + | [[Image:GeWB_GUI_MicroarrayViewer.png|{{ImageMaxWidth}}]] | ||
| + | |||
| + | |||
| + | Areas 2, 3 and 4 are defined for convenience. The actual placement of a given component into any of these three areas is controlled by a configuration file and can be customized as desired. | ||
| + | |||
| + | |||
| + | |||
| + | |||
| + | Prior to geWorkbench version 2.3.0, most analysis routines were located in a fixed panel found at lower right in the graphical interface. | ||
[[Image:T_Analysis_Params_List.png]] | [[Image:T_Analysis_Params_List.png]] | ||
| Line 18: | Line 37: | ||
At upper left of the framework is a list of available analysis routines (as loaded using the [[Tutorial_-_Component_Configuration_Manager | Component Configuration Manager]]). At upper right is a list (labeled "Saved settings list") which can store named sets of customized parameter settings for each different analysis. | At upper left of the framework is a list of available analysis routines (as loaded using the [[Tutorial_-_Component_Configuration_Manager | Component Configuration Manager]]). At upper right is a list (labeled "Saved settings list") which can store named sets of customized parameter settings for each different analysis. | ||
| − | |||
==Creating saved parameter sets (prior to geWorkbench 2.3.0)== | ==Creating saved parameter sets (prior to geWorkbench 2.3.0)== | ||
| − | The current parameter settings | + | The current parameter settings could be saved by pushing the '''Save Settings''' button. A dialog appeared asking for a name for the new set of saved parameters. |
[[Image:T_Analysis_Params_Save.png]] | [[Image:T_Analysis_Params_Save.png]] | ||
| − | In | + | In the below figure, the default settings have been saved to a set called "Default Settings". |
[[Image:T_Analysis_Default_Settings.png]] | [[Image:T_Analysis_Default_Settings.png]] | ||
Latest revision as of 15:13, 15 October 2013
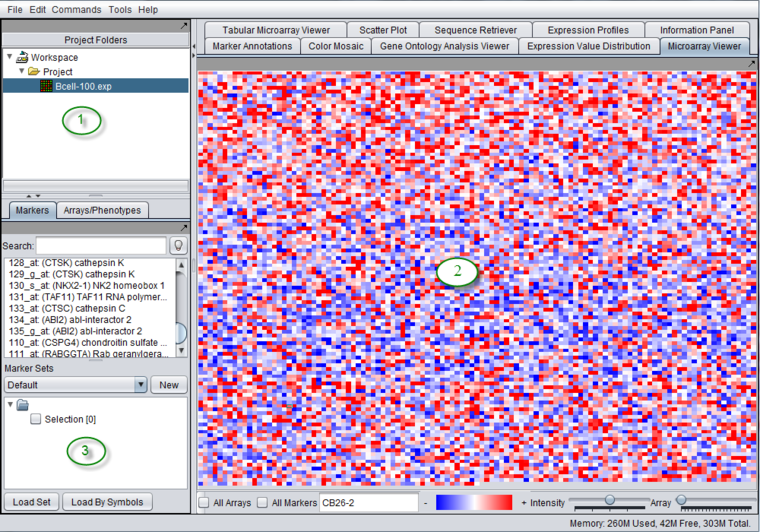
Layout in versions 2.3.0 to 2.4.1
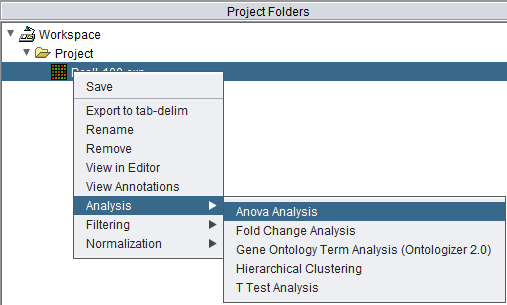
Versions of geWorkbench prior to 2.5.0 had an additional layer of data organization, called the "Project", within the Workspace. The user could define any number of separate projects.
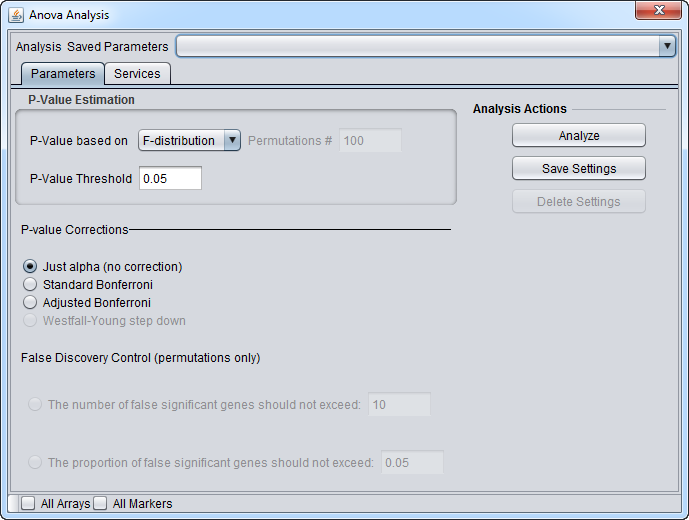
These versions also provided the analysis components with a way to override any activated marker are or array set, in the form of the "All Arrays" and "All Markers" checkboxes, at the bottom of each component.
Layout of the analysis framework (prior to geWorkbench 2.3.0)
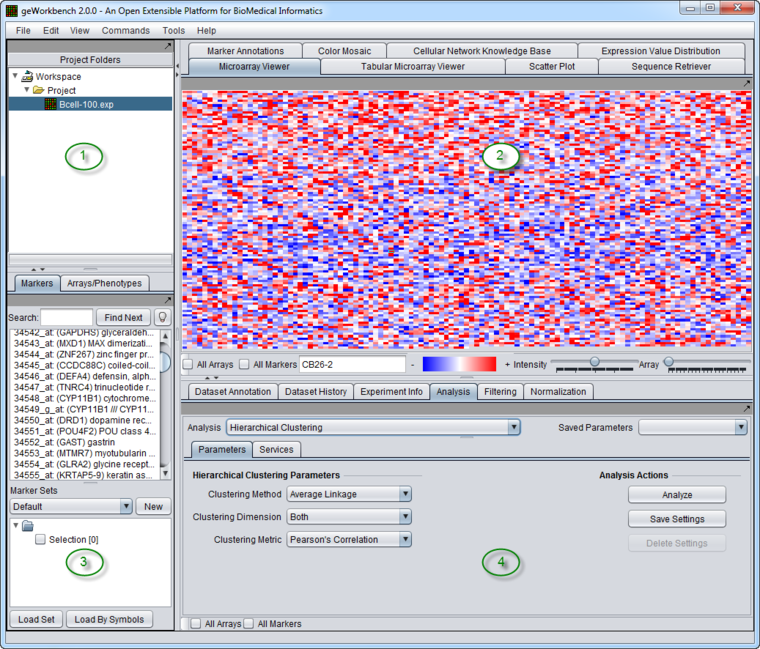
The graphical user interface for geWorkbench is divided into four major sections, for
- Data management - Workspace and Projects (upper left)
- Visualization tools (upper right)
- Marker and Array/Phenotype set selection and management (lower left)
- Analytical tools (lower right)
Areas 2, 3 and 4 are defined for convenience. The actual placement of a given component into any of these three areas is controlled by a configuration file and can be customized as desired.
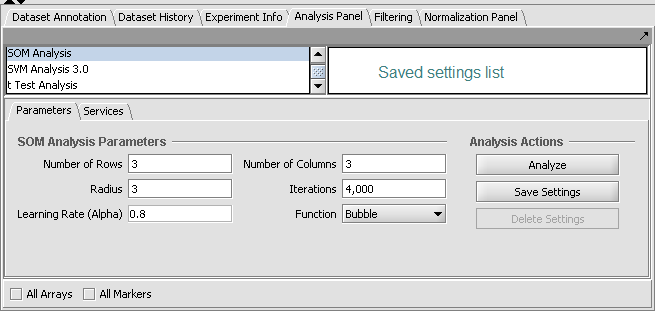
Prior to geWorkbench version 2.3.0, most analysis routines were located in a fixed panel found at lower right in the graphical interface.
At upper left of the framework is a list of available analysis routines (as loaded using the Component Configuration Manager). At upper right is a list (labeled "Saved settings list") which can store named sets of customized parameter settings for each different analysis.
Creating saved parameter sets (prior to geWorkbench 2.3.0)
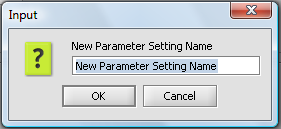
The current parameter settings could be saved by pushing the Save Settings button. A dialog appeared asking for a name for the new set of saved parameters.
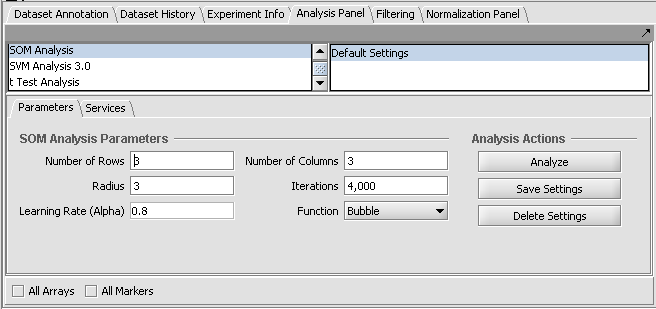
In the below figure, the default settings have been saved to a set called "Default Settings".
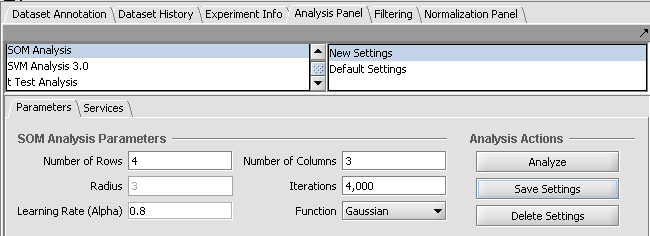
The next figure illustrates changing a couple of parameters and saving them to a new set called "New Settings".
