Difference between revisions of "Plugins"
(→Sequence Analysis & Visualization) |
(→Sequence Analysis & Visualization) |
||
| Line 138: | Line 138: | ||
|- | |- | ||
|- | |- | ||
| − | |Sequence Alignment||Server-based versions of BLAST and Smith-Waterman alignment.||? | + | |Sequence Alignment||Server-based versions of BLAST and Smith-Waterman alignment ([[media:Synteny Blastresults.png|screenshot]]).||? |
|- | |- | ||
|- | |- | ||
Revision as of 16:22, 9 February 2006
Contents
The geWorkbench platform employs a component repository infrastructure to manage a large collection of pluggable components that can be used to customize the application's graphical user interface. This (ever growing) list of plug-in components covers a wide range of fucntionality for a number of different genomic data modalities:
Microarray Visualization
| Plugin | Description | Compatibility |
|---|---|---|
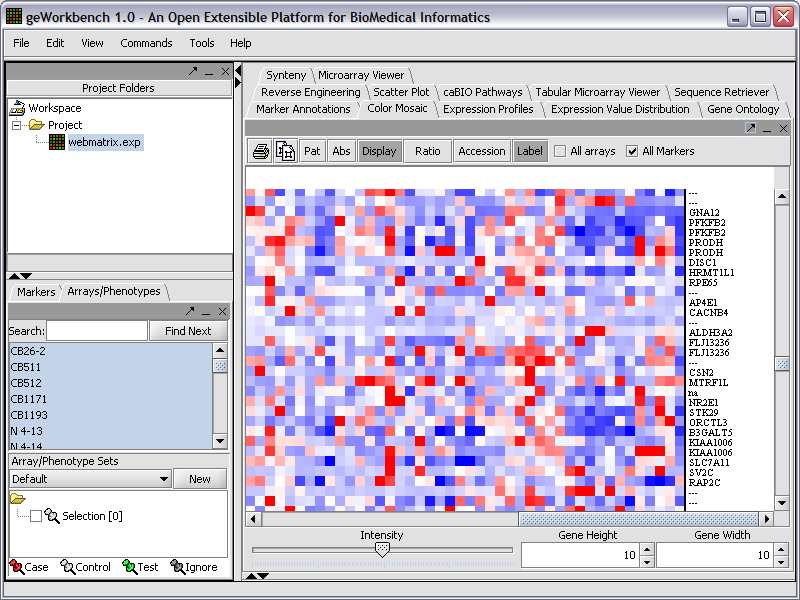
| Color Mosaic | Heat maps for microarray expression data, organized by phenotypic or gene groupings (screenshot). | Verified to work on 3.0 |
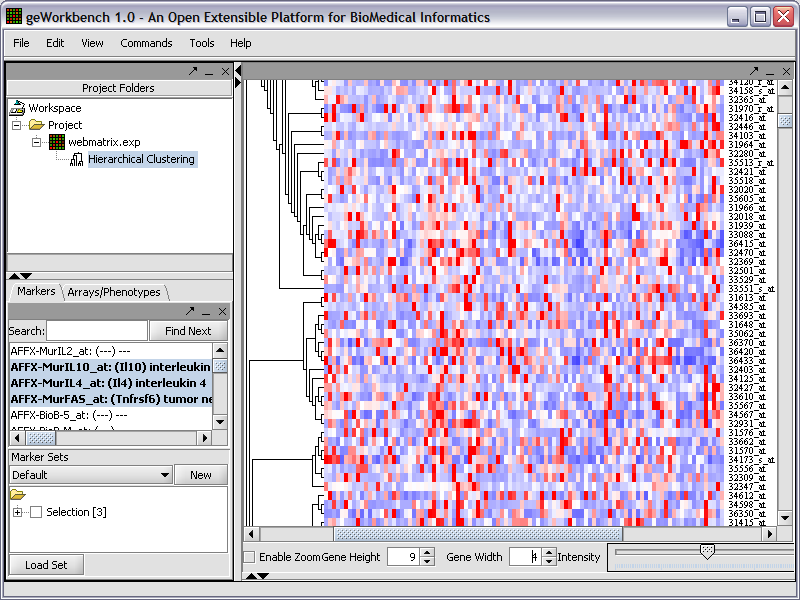
| Dendrogram | Tree-structured diagrams reflecting the results of hierarchical clustering analysis (screenshot). | TBD |
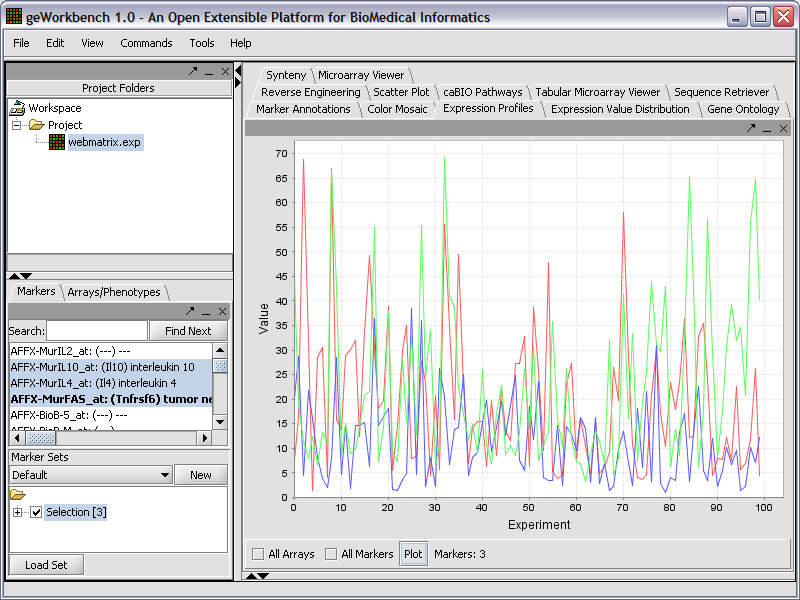
| Expression Profiles | Line graph of genes expression profiles across several arrays/ hybridizations (screenshot). | TBD |
| Expression Value Distribution | Distribution plot of marker expression values across one or more microarrays. | TBD |
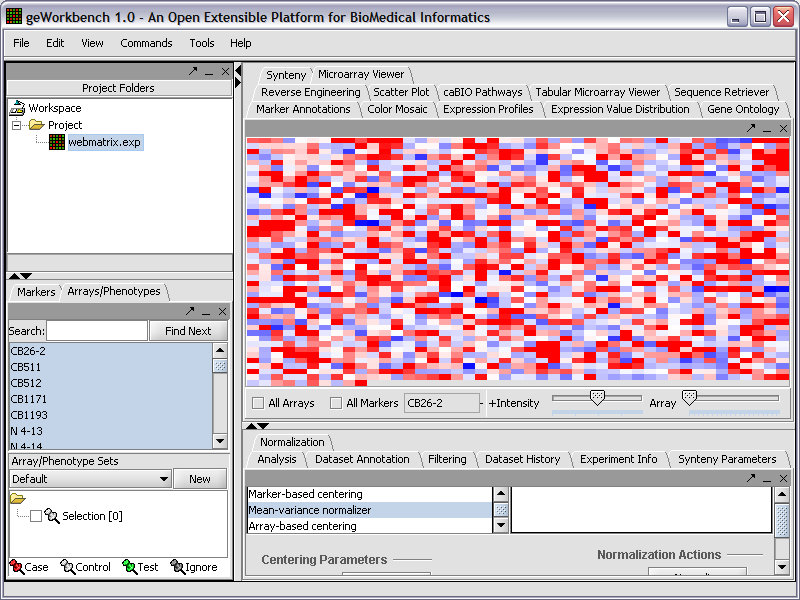
| Microarray Panel | Color-gradient representation of gene expression values (screenshot). | TBD |
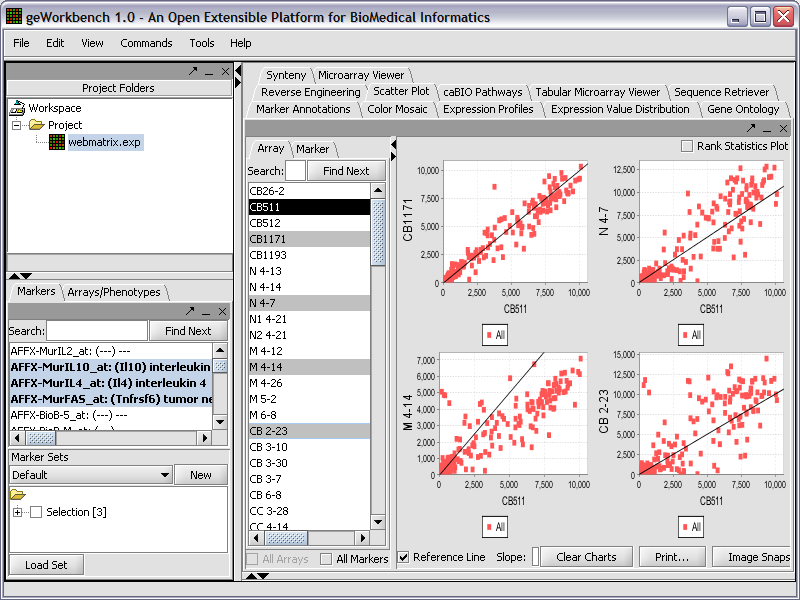
| Scatter Plot | Pairwise (array vs. array and marker vs. marker) comparison and plotting of expression values (screenshot). | TBD |
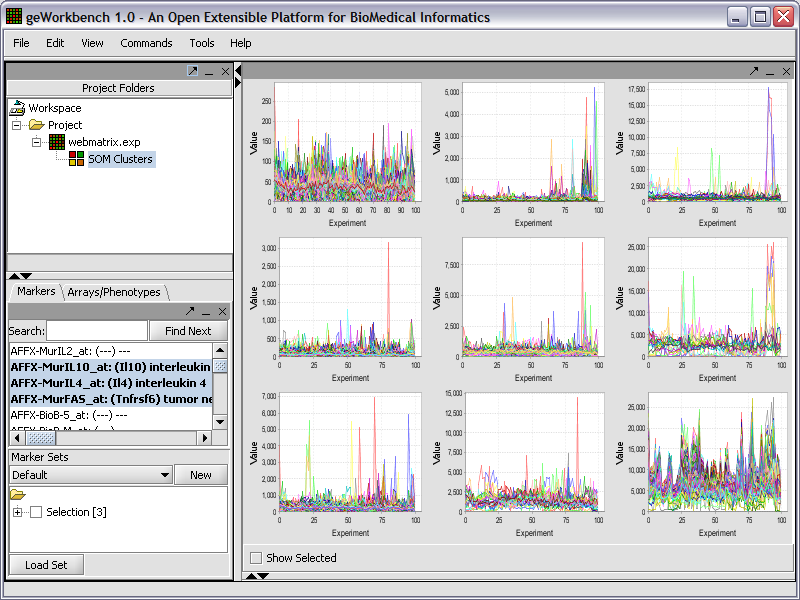
| SOM Clusters Viewer | Visualization of gene clusters produced by the self-organizing maps analysis (screenshot). | TBD |
| Tabular Microarray Panel | Spreadsheet view of all expression measurement in an experiment, one row per individual marker/probe and one column per microarray (screenshot). |
Data Management
| Plugin | Description | Compatibility |
|---|---|---|
| Gene Panel | Definition of data views consisting of marker subgroups. The views control the amount of data displayed. | TBD |
| Phenotype Panel | Definition of data views consisting of microarray subgroups. The views control the amount of data displayed. | TBD |
Normalizers
| Plugin | Description | Compatibility |
|---|---|---|
| Array-Based Centering | Subtraction of the mean or median measurement of a microarray from every measurement in that microarray. | TBD |
| Marker-Based Centering | Subtraction of the mean or median measurement of a marker profile from every measurement in the profile. | TBD |
| Mean-Variance Normalizer | Transformation of expression measurements to standard units: for every marker, the mean measurement of the marker profile (across all microarrays in an experiment) is subtracted from each measurement in the profile and the resulting value is divided by the standard deviation of the profile. | TBD |
| Missing Value Calculation | Replacement of missing values with consensus values. | TBD |
| Threshold Normalizer | Adjustment of values that fall outside a user-specified threshold. | TBD |
| Quantile | Expression measurements in each microarray are adjusted so that the distribution of values is the same across all microarrays in an experiment. | TBD |
| Housekeeping | Normalization of all measurements in a microarray through division by the average expression value of a (user defined) set of housekeeping genes. | TBD |
Annotation
| Plugin | Description | Compatibility |
|---|---|---|
| Dataset History | Log of data transformations induced by data-modifying operations. | ? |
| Dataset Annotation | Free text format box used to annotate data, images and results. Such annotations persist application invocations and can be used as an online "lab notebook". | ? |
| Experiment Information | Microarray machine parameters used in an experiment run. If available, high-level experiment information (e.g., purpose of of experiment) are also displayed | ? |
| Marker Annotations | Retrieval of gene and pathway information for markers on a microarray. | TBD |
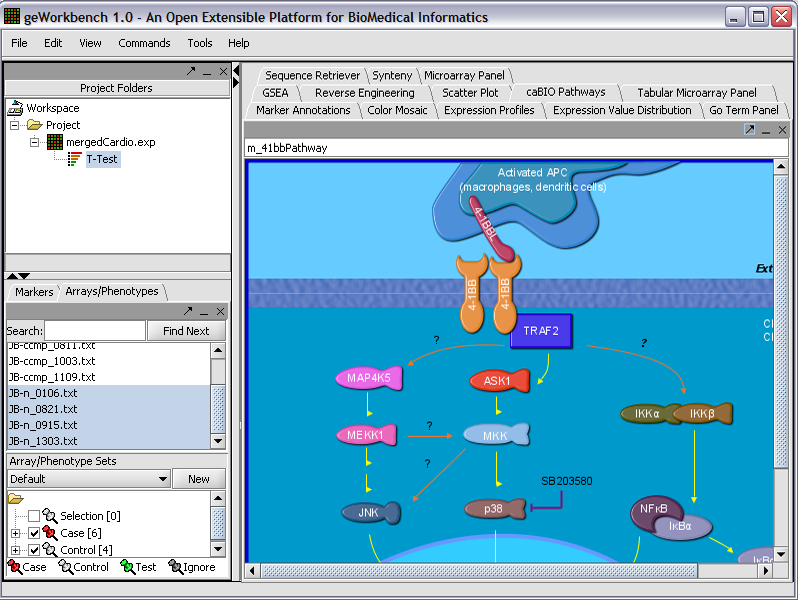
| caBIO Pathway Listing | Visualization of BioCarta pathway diagrams (screenshot). | TBD |
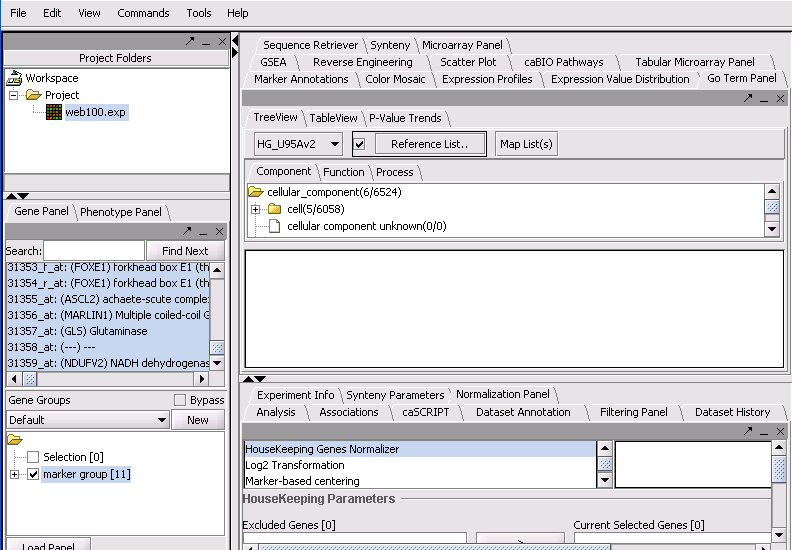
| Go Terms | Enrichment analysis of selected groups of genes against Gene Ontology (http://www.geneontology.org) annotations (screenshot). | TBD |
Network Generation
| Plugin | Description | Compatibility |
|---|---|---|
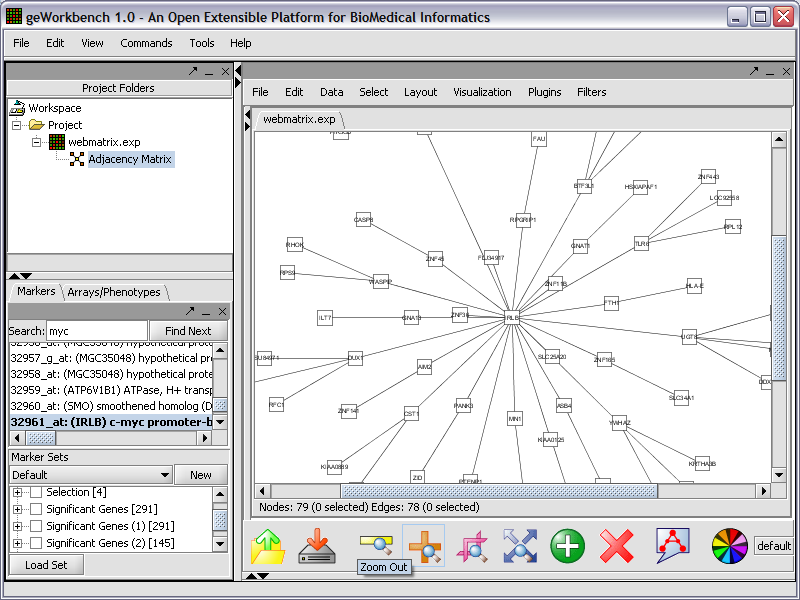
| ARACNE Reverse Engineering | Analysis of large amount of microarray data (typically 100-500 microarrays) to reverse engineer underlying gene regulatory networks (screenshot). | ? |
| Cytoscape | Visualization of gene regulatory network created in Reverse Engineering using Cytoscape 2.0(screenshot). | ? |
Analysis
| Plugin | Description | Compatibility |
|---|---|---|
| Hierarchical Clustering | Clustering of markers and microarrays into hierarchical binary trees. The resulting structures can be visualized in the Dendrogram plugin. | ? |
| Self Organizing Map (SOM) | Clustering of markers using self organizing maps. The resulting clusters can be visualized in the SOM Clusters Viewer plugin. | ? |
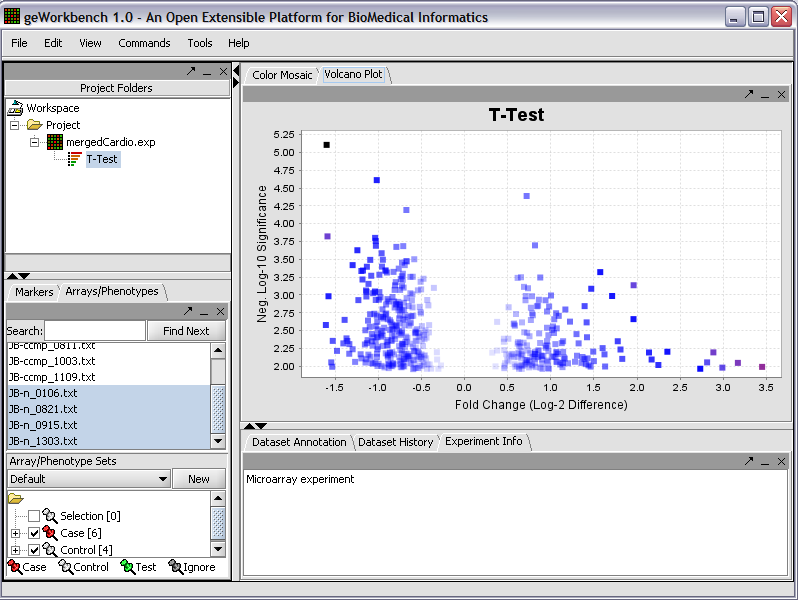
| T Test | Identification of markers with statistically significant differential expression between sets of microarrays. T-testing is used for the determination of significance (screenshot). | ? |
Sequence Analysis & Visualization
| Plugin | Description | Compatibility |
|---|---|---|
| Sequence Alignment | Server-based versions of BLAST and Smith-Waterman alignment (screenshot). | ? |
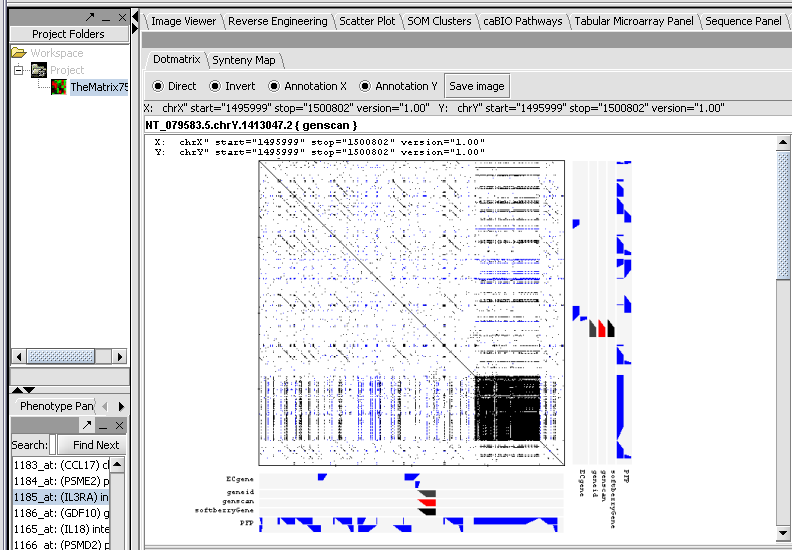
| Synteny | Comparison of sequence similarity between two genomic regions. The comparison results are represented as a dot matrix augmented with detailed annotation for both regions (screenshot). | ? |
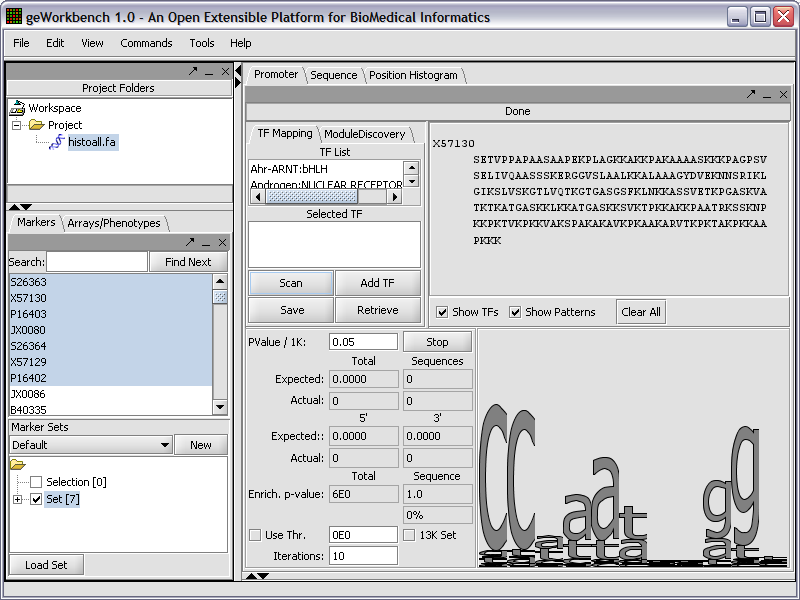
| Promoter Analysis | Identification of putative transcription factor binding sites in DNA sequences (screenshot). The analysis use the profiles in the JASPAR Transcription Factor Binding Profile Database. | ? |
| Pattern Discovey | Discovery of sequence motifs in sets of DNA and protein sequences. | ? |
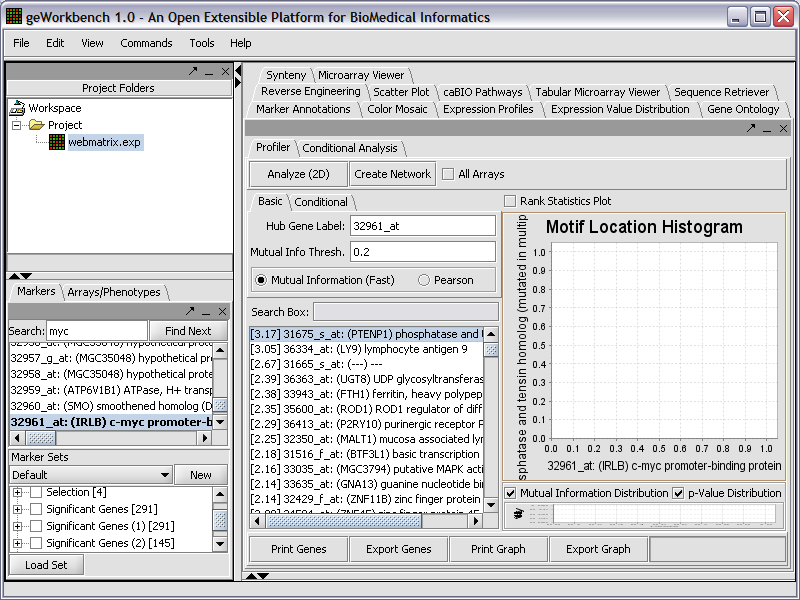
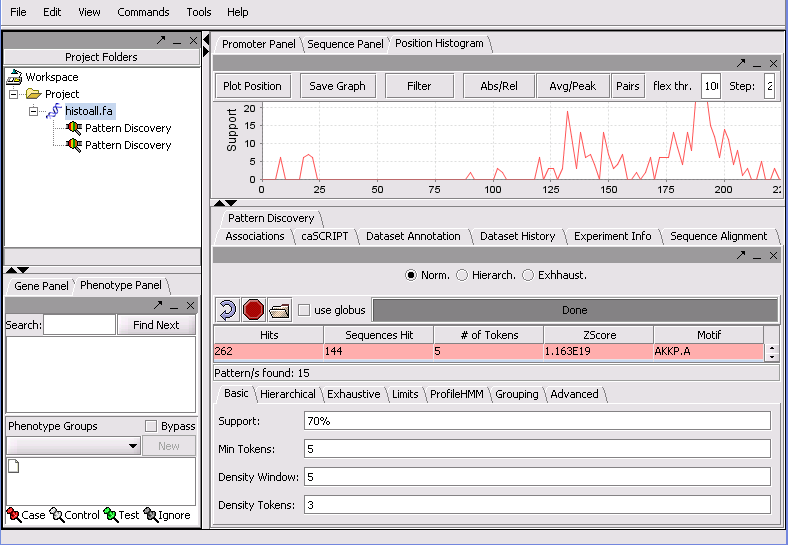
| Position Histogram | Visualization of results from the Pattern Discovery plugin. Motif/pattern support is plotted against relative sequence position of the motif match (screenshot). | ? |
| Sequence Panel | Visualization of results from the Pattern Discovery plugin, displaying the motif match location over each sequence from the input data set. | ? |
Filters
| Plugin | Description | Compatibility |
|---|---|---|
| Affy Detection Call | (Affymetrix data only) Sets all measurements whose detection status is any user-defined combination of A, P or M as missing. | TBD |
| Deviation | Sets all markers whose measurements deviate below a given value across all microarrays as missing. | ? |
| Expression Threshold | Sets all markers whose measurements are inside (or outside) a user-defined range as missing. | ? |
| Genepix Flag Filter | (Genepix data only)Designate as “missing” measurements whose Flags column assume specific user selected values. | ? |
| Missing Values | Discards all markers that have “missing” measurements in a user-defined range of microarrays. Another filter must first be applied however, in order to generate the missing values upon which this filter can operate. | TBD |
| 2-channel Threshold | (Genepix data only) Defines applicable ranges for each channel, and sets all values for which either channel intensity is inside (or outside) the defined range as missing. | TBD |
