Difference between revisions of "Home"
(→Brief Overview of Changes in geWorkbench 2.3.0) |
m (→Brief Overview of Changes in geWorkbench 2.3.0) |
||
| Line 38: | Line 38: | ||
graphical interface to make using analysis, filtering, normalization and visualization components much easier. | graphical interface to make using analysis, filtering, normalization and visualization components much easier. | ||
| − | * The analysis, filtering and visualization components are now reached through a right-click menu directly on the data node, or through the commands menu in the upper menu bar. This allowed the removal of the dedicated "commands" area from the geWorkbench graphical interface, making | + | * The analysis, filtering and visualization components are now reached through a right-click menu directly on the data node, or through the commands menu in the upper menu bar. This allowed the removal of the dedicated "commands" area from the geWorkbench graphical interface, making more room available for the display of results. |
* Switching back and forth between large data nodes is now much faster. | * Switching back and forth between large data nodes is now much faster. | ||
Revision as of 14:37, 19 March 2012
Contents
Quick Start
Please see the Quick Start guide to geWorkbench to see how to get started using geWorkbench right away.
Current Release
Welcome to geWorkbench. The current version is 2.3.0, released March 16th, 2012.
View the geWorkbench 2.3.0 Release Notes.
geWorkbench can be downloaded from the NCI GForge site at https://gforge.nci.nih.gov/frs/?group_id=78. Installation instructions can be found on the Download and Installation page of this Wiki. The Release Notes are also available on GForge.
Overview
geWorkbench (genomics Workbench) is a Java-based open-source platform for integrated genomics. Using a component architecture it allows individually developed plug-ins to be configured into complex bioinformatic applications. At present there are more than 70 available plug-ins supporting the visualization and analysis of gene expression and sequence data. Example use cases include:
- loading data from local or remote data sources.
- visualizing gene expression, molecular interaction networks, protein sequence and protein structure data in a variety of ways.
- providing access to client- and server-side computational analysis tools such as t-test analysis, hierarchical clustering, self organizing maps, regulatory neworks reconstruction, BLAST searches, pattern/motif discovery, etc.
- validating computational hypothesis through the integration of gene and pathway annotation information from curated sources as well as through Gene Ontology enrichment analysis.
geWorkbench is the Bioinformatics platform of MAGNet, the National Center for the Multi-scale Analysis of Genomic and Cellular Networks (one of the 7 National Centers for Biomedial Computing funded through the NIH Roadmap). Additionally, geWorkbench is supported by caBIG®, NCI's cancer Biomedical Informatics Grid initiative.
End-user and developer support for geWorkbench is provided through the caBIG® Molecular Analysis Tools Knowledge Center, a component of the caBIG® Enterprise Support Network.
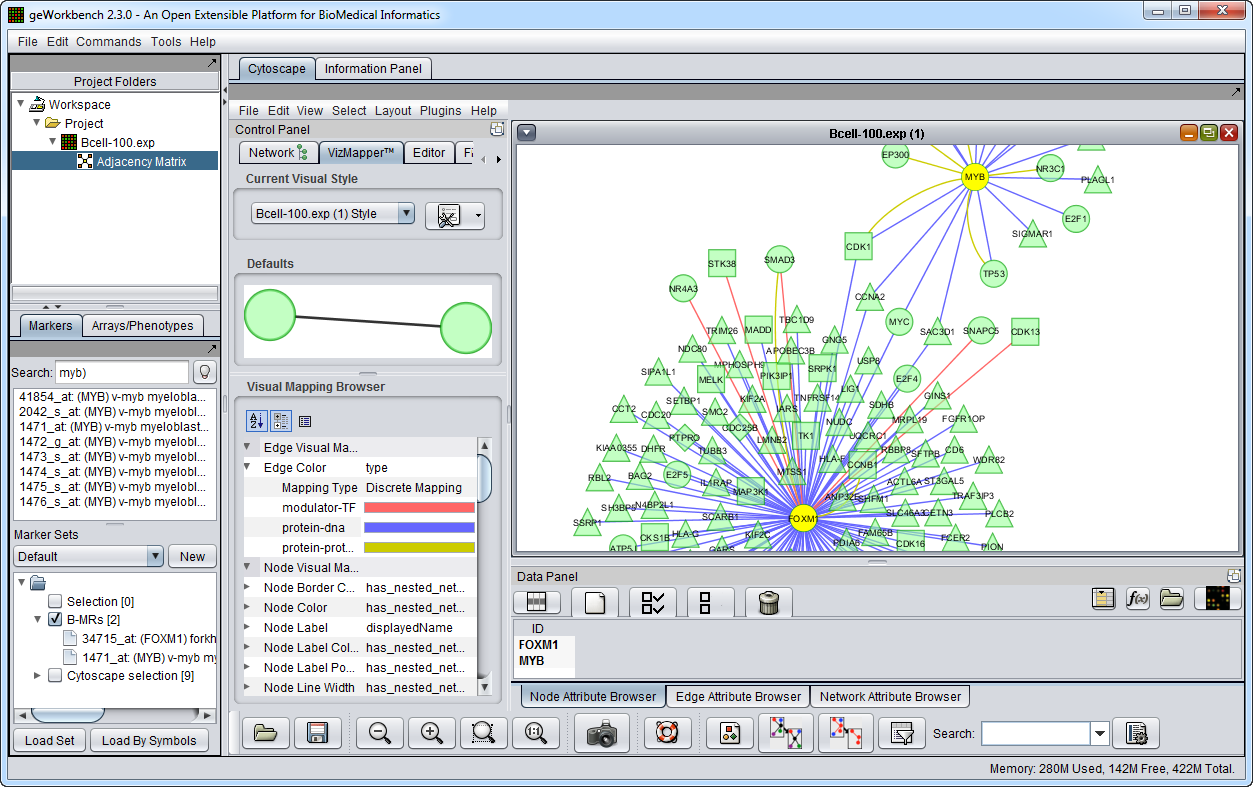
Graphical User Interface
The figure above shows the full geWorkbench graphical user interface. The Cellular Network Knowledge Base B-cell interactome was queried for interactions of two master regulator genes, and the result displayed in Cytoscape.
Brief Overview of Changes in geWorkbench 2.3.0
Release Date: March 16, 2012
geWorkbench v2.3.0 introduces significant improvements in responsiveness and memory usage, and a streamlining of the graphical interface to make using analysis, filtering, normalization and visualization components much easier.
- The analysis, filtering and visualization components are now reached through a right-click menu directly on the data node, or through the commands menu in the upper menu bar. This allowed the removal of the dedicated "commands" area from the geWorkbench graphical interface, making more room available for the display of results.
- Switching back and forth between large data nodes is now much faster.
- caArray downloads have been speeded up dramatically, and memory problems that limited the number of arrays that could be downloaded were resolved. We have test-downloaded 527 arrays of type Affymetrix HT_HG-U133A in 16 minutes with no memory problems.
- Dynamic search for marker and gene names has been added to all filtering components.
- A number of data and result export options have been added. Microarray data can now be exported to a tab-delimited file directly, or from the tabular viewer, allowing subsets of the data to be exported.
- Interactomes stored in the Cellular Network Knowledge Base can now be exported directly into the Project Folders component.
- A new component, IDEA (Interactome Dysregualtion Enrichment Analysis), is included.
Previous Releases
See the Previous Releases page for full details.

