File list
This special page shows all uploaded files.
First page |
Previous page |
Next page |
Last page |
| Date | Name | Thumbnail | Size | User | Description | Versions |
|---|---|---|---|---|---|---|
| 16:07, 14 October 2013 | MRA Detailed listing.png (file) |  |
15 KB | Smith | 5 | |
| 16:06, 14 October 2013 | MRA Summary listing v3.png (file) |  |
28 KB | Smith | 1 | |
| 16:04, 14 October 2013 | MRA viewer GBM FOSL2 v3.png (file) | 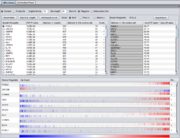 |
88 KB | Smith | 1 | |
| 15:59, 14 October 2013 | Workspace MRA Tooltip.png (file) | 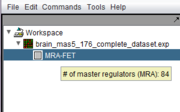 |
8 KB | Smith | 1 | |
| 15:22, 14 October 2013 | Workspace data node.png (file) |  |
6 KB | Smith | 1 | |
| 15:12, 14 October 2013 | MRA-MARINa-CCM.png (file) | 15 KB | Smith | 1 | ||
| 14:38, 14 October 2013 | Workspace Open Files.png (file) |  |
6 KB | Smith | 1 | |
| 13:53, 11 October 2013 | ReleaseNotes 2.5.0.txt (file) | 82 KB | Smith | geWorkbench 2.5.0 Release Notes | 1 | |
| 10:18, 11 October 2013 | GeWorkbench v2.5.0.md5.txt (file) | 473 bytes | Smith | GeWorkbench_v2.5.0.md5 MD5 hash codes | 1 | |
| 16:03, 2 October 2013 | GeWorkbench v2.4.1.md5.txt (file) | 473 bytes | Smith | MD5 Sums for geWorkbench 2.4.1. | 1 | |
| 17:19, 8 August 2013 | Consensus clustering output files.png (file) |  |
26 KB | Smith | 1 | |
| 17:17, 8 August 2013 | Consensus clustering result color mosaic.png (file) | 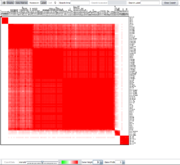 |
48 KB | Smith | 1 | |
| 17:17, 8 August 2013 | Consensus clustering array sets open.png (file) | 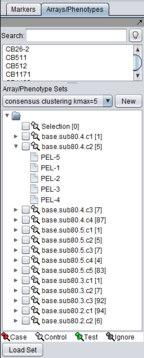 |
26 KB | Smith | 1 | |
| 17:16, 8 August 2013 | Consensus clustering array sets.png (file) | 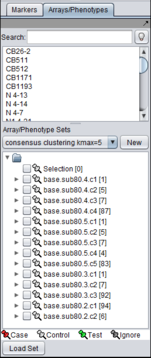 |
25 KB | Smith | 1 | |
| 17:15, 8 August 2013 | Consensus clustering result nodes.png (file) | 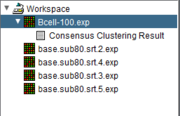 |
6 KB | Smith | 1 | |
| 16:29, 8 August 2013 | Consensus clustering parameters.png (file) | 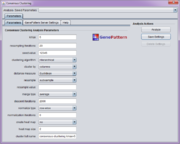 |
62 KB | Smith | 1 | |
| 16:50, 2 August 2013 | Hermes ceRNA Query Result mir-526bstar.png (file) |  |
35 KB | Smith | 1 | |
| 16:48, 2 August 2013 | Hermes ceRNA Query Result STAT3.png (file) | 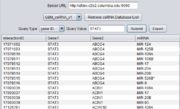 |
36 KB | Smith | 2 | |
| 16:48, 2 August 2013 | Hermes ceRNA Query Interface.png (file) |  |
13 KB | Smith | 2 | |
| 15:05, 2 August 2013 | Hermes ceRNA Query Result mir-519d.png (file) |  |
34 KB | Smith | 1 | |
| 11:05, 16 July 2013 | MarkUs home gallery.PNG (file) |  |
224 KB | Floratos | Results of running the MarkUs structure-based functional annotation pipeline on a protein with an available structure. | 1 |
| 14:33, 15 July 2013 | Volcano plot home gallery.PNG (file) | 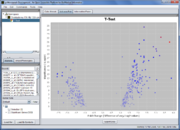 |
132 KB | Floratos | A Volcano plot, displaying the results of differential gene expression analysis. | 1 |
| 14:32, 15 July 2013 | TF binding site prediction home gallery.PNG (file) |  |
146 KB | Floratos | The Promoter component enables the prediction of transcription factor binding sites on DNA sequences. Users can test for binding sites from the JASPAR database or upload any number of custom position specific scoring matrices (PSSMs). | 1 |
| 14:26, 15 July 2013 | Skybase home gallery.PNG (file) | 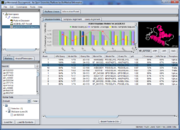 |
150 KB | Floratos | A query protein sequence can be matched against the The Skybase database of computed 3D protein models, to identify putative matching models based on sequence homology. | 1 |
| 14:14, 15 July 2013 | Motif discovery home gallery.PNG (file) |  |
112 KB | Floratos | The SPLASH component (structural pattern localization analysis by sequential histograms) provides the ability to identify sequence motifs in protein and DNA sequences. | 1 |
| 14:12, 15 July 2013 | JMol viewer home gallery.PNG (file) | 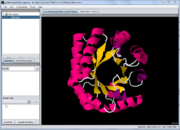 |
155 KB | Floratos | The Jmol viewer (http://jmol.sourceforge.net/) is available as a geWorkbench component and allows the visualization of chemical structures in 3D. | 1 |
| 14:10, 15 July 2013 | Gene Ontology home gallery.PNG (file) |  |
161 KB | Floratos | Gene Ontology (GO) analysis makes it possible to identify GO terms enriched in a user-specified gene signature (e.g., the significant genes from a differential gene expression analysis). | 1 |
| 14:08, 15 July 2013 | Dendrogram home gallery.PNG (file) |  |
217 KB | Floratos | Visualization of the results of a Hierarchical Clustering analysis. | 1 |
| 14:07, 15 July 2013 | CCM home gallery.PNG (file) |  |
132 KB | Floratos | The Component Configuration Manager allows enabling/disabling plugins. It allows configuring geWorkbench to include only components needed by the user. | 1 |
| 14:05, 15 July 2013 | BLAST home gallery.PNG (file) | 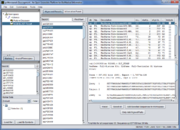 |
145 KB | Floratos | Results of running a BLAST sequence homology query. | 1 |
| 20:42, 14 July 2013 | ARACNe with t-test home gallery.PNG (file) | 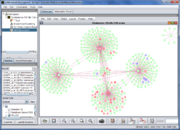 |
278 KB | Floratos | Regulatory network reconstructed using the ARACNe algorithm. Nodes represent genes and edges represent ARACNe-predicted interactions between transcription factors and their putative targets. The results of a prior differential expression analysis have bee | 1 |
| 17:07, 11 July 2013 | Site banner.png (file) | 16 KB | Floratos | 1 | ||
| 15:47, 27 June 2013 | LINCS HeatMap Search Result.png (file) | 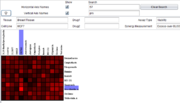 |
20 KB | Smith | 2 | |
| 15:30, 27 June 2013 | LINCS HeatMap Search.png (file) | 7 KB | Smith | 1 | ||
| 15:28, 27 June 2013 | LINCS HeatMap Details.png (file) | 4 KB | Smith | 1 | ||
| 15:20, 27 June 2013 | LINCS HeatMap right-click-menu.png (file) | 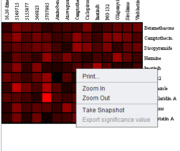 |
8 KB | Smith | 1 | |
| 14:53, 27 June 2013 | LINCS Isobologram example.png (file) | 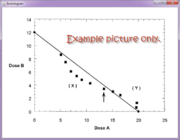 |
75 KB | Smith | 1 | |
| 11:58, 27 June 2013 | LINCS titration select.png (file) | 15 KB | Smith | 1 | ||
| 11:55, 27 June 2013 | LINCS HeatMap Signal bulb hover.png (file) | 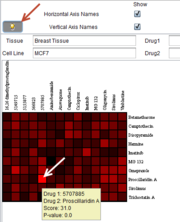 |
19 KB | Smith | 2 | |
| 11:38, 27 June 2013 | LINCS HeatMap Signal Bulb icon.png (file) | 1 KB | Smith | 1 | ||
| 11:36, 27 June 2013 | LINCS HeatMap Signal bulb.png (file) | 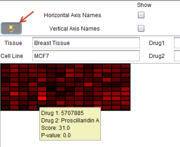 |
12 KB | Smith | 1 | |
| 17:49, 26 June 2013 | LINCS Network MCF7 2 vs all top10.png (file) | 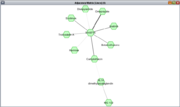 |
43 KB | Smith | 1 | |
| 17:48, 26 June 2013 | LINCS Experimental top10.png (file) |  |
59 KB | Smith | 1 | |
| 17:32, 26 June 2013 | LINCS HeatMap.png (file) |  |
29 KB | Smith | 1 | |
| 17:30, 26 June 2013 | LINCS Computationall.png (file) |  |
115 KB | Smith | 1 | |
| 11:22, 6 March 2013 | SAM R Location Mac.png (file) | 12 KB | Ut2102 | 1 | ||
| 14:14, 26 February 2013 | Basics Analysis t-test.png (file) |  |
26 KB | Smith | 1 | |
| 14:55, 20 November 2012 | Mra grid test.zip (file) | 405 KB | Smith | Data for testing MARINa. | 1 | |
| 17:59, 19 November 2012 | MARINa TableViewer probe shuffling.png (file) | 36 KB | Smith | 1 | ||
| 17:58, 19 November 2012 | MARINa TableViewer sample shuffling.png (file) | 20 KB | Smith | 1 |
First page |
Previous page |
Next page |
Last page |
