Difference between revisions of "Plugins"
(→Data Management) |
|||
| Line 47: | Line 47: | ||
|- | |- | ||
|- | |- | ||
| − | |Gene Panel || | + | |Gene Panel ||Definition of data views consisting of marker subgroups. The views control how much data is displayed by only using values for markers in the defined groups.||TBD |
|- | |- | ||
|- | |- | ||
| − | |Phenotype Panel || | + | |Phenotype Panel ||Definition of data views consisting of microarray subgroups. The views control how much data is displayed by only using values for microarrays in the defined groups..||TBD |
|- | |- | ||
|- | |- | ||
|} | |} | ||
| + | |||
==Normalizers== | ==Normalizers== | ||
{|style="border: 1px solid lightGray" | {|style="border: 1px solid lightGray" | ||
Revision as of 17:03, 6 February 2006
Contents
The geWorkbench platform employs a component repository infrastructure to manage a large collection of pluggable components that can be used to customize the application's graphical user interface. This (ever growing) list of plug-in components covers a wide range of fucntionality for a number of different genomic data modalities:
Microarray Visualization
| Plugin | Description | Compatibility |
|---|---|---|
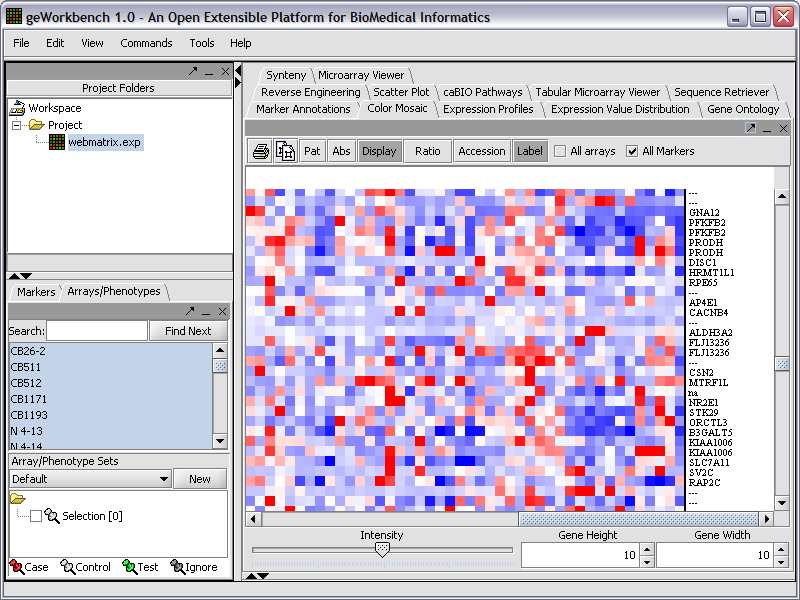
| Color Mosaic | Heat maps for microarray expression data, organized by phenotypic or gene groupings (screenshot). | Verified to work on 3.0 |
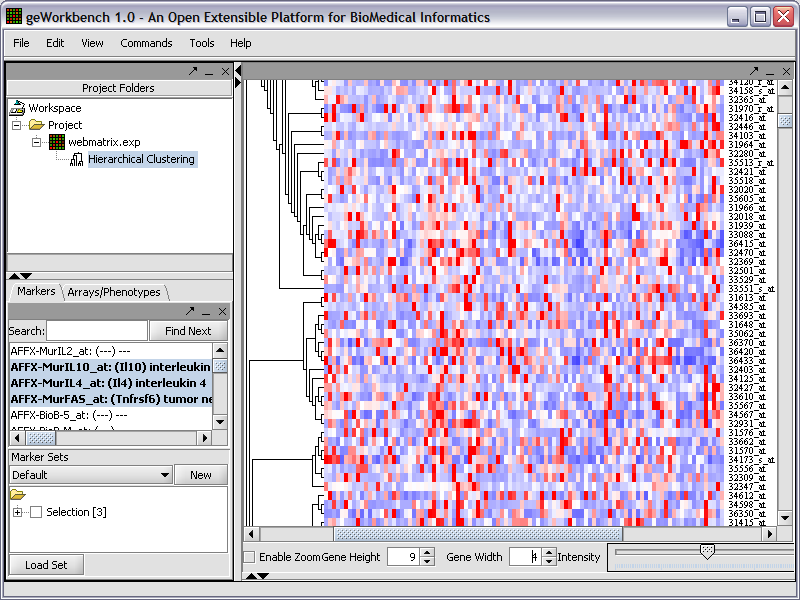
| Dendrogram | Tree-structured diagrams reflecting the results of hierarchical clustering analysis (screenshot). | TBD |
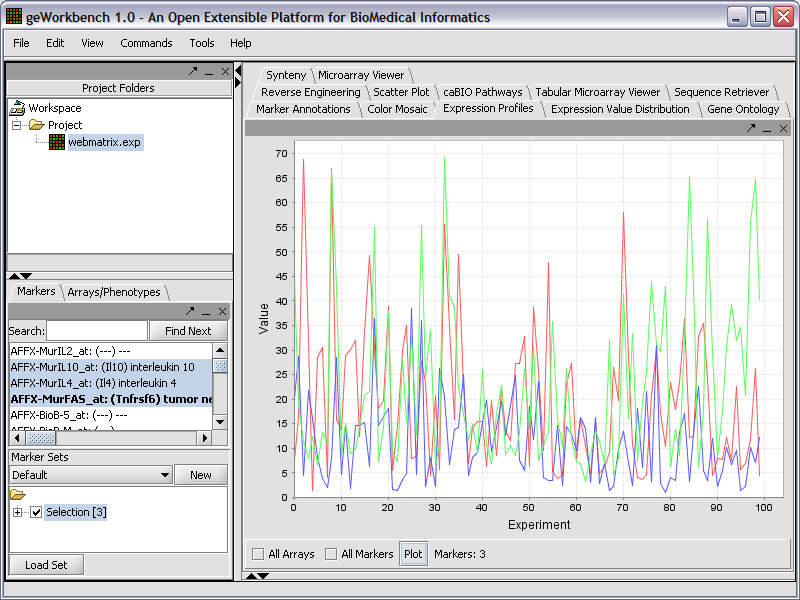
| Expression Profiles | Line graph of genes expression profiles across several arrays/ hybridizations (screenshot). | TBD |
| Expression Value Distribution | Distribution plot of marker expression values across one or more microarrays. | TBD |
| Marker Annotations | Retrieval of gene and pathway information for markers on a microarray. | TBD |
| Microarray Panel | Color-gradient representation of measured gene expression values (screenshot). | TBD |
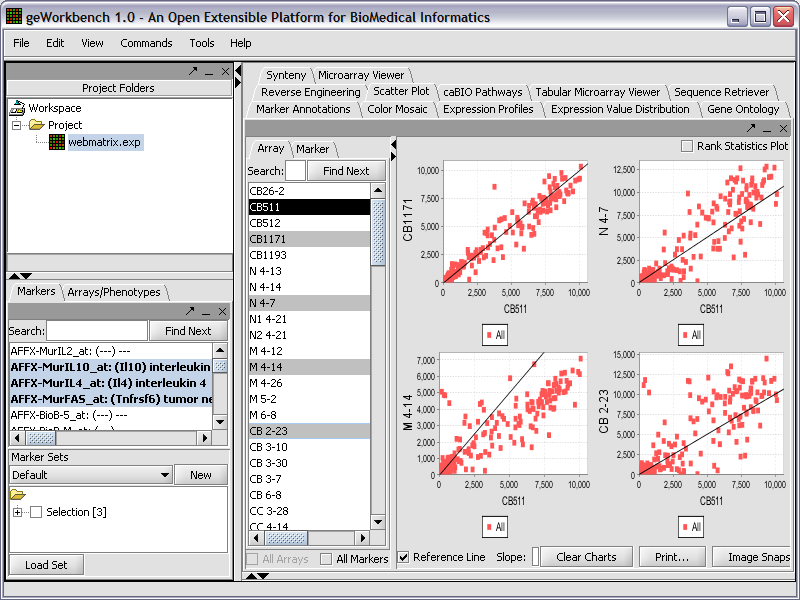
| Scatter Plot | Pairwise (array vs. array and marker vs. marker) comparison and plotting of expression values (screenshot). | TBD |
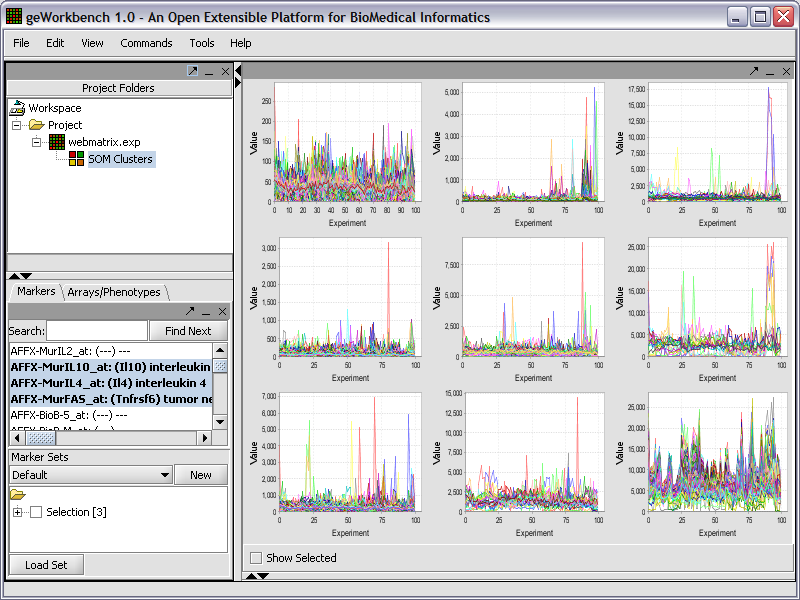
| SOM Clusters | Visualization of gene clusters produced by the self-orgnizing maps analysis (screenshot). | TBD |
| Tabular Microarray Panel | Spreadsheet view of all expression measurement in an experiment, one row per individual marker/probe and one columns per microarray (screenshot). |
Data Management
| Plugin | Description | Compatibility |
|---|---|---|
| Gene Panel | Definition of data views consisting of marker subgroups. The views control how much data is displayed by only using values for markers in the defined groups. | TBD |
| Phenotype Panel | Definition of data views consisting of microarray subgroups. The views control how much data is displayed by only using values for microarrays in the defined groups.. | TBD |
Normalizers
| Plugin | Description | Compatibility |
|---|---|---|
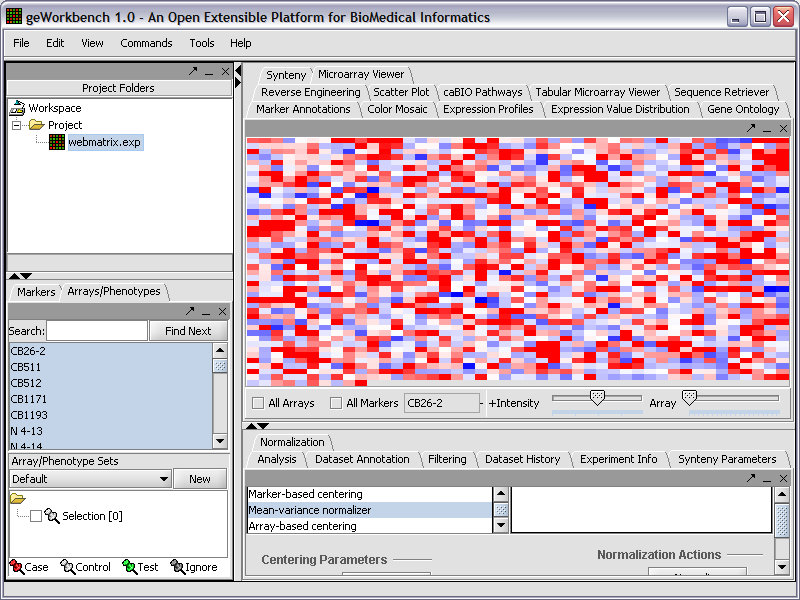
| Array-Based Centering | Subtracts the mean (median) measurement of a microarray from every measurement in that microarray. | TBD |
| Marker-Based Centering | Subtracts the mean (median) measurement of a marker profile from every measurement in the profile. | TBD |
| Mean-Variance Normalizer | For every marker profile, the mean measurement of the entire profile is subtracted from each measurement in the profile and the resulting value is divided by the standard deviation. | TBD |
| Missing Value Calculation | Replaces every missing value with either the mean value of that marker across all microarrays or with the mean measurement of all markers in the microarray. | TBD |
| Threshold Normalizer | All data points whose value is less than (or greater than) a user-specified minimum (maximum) value are raised (reduced) to that minimum (maximum) value. | TBD |
| Quantile | Expression measurements in each microarray is adjusted to reflect the same expression value distribution for all microarrays. | TBD |
| Housekeeping | Normalization based on the average expression of all markers corresponding to user selected housekeeping genes. | TBD |
Annotation
| Plugin | Description | Compatibility |
|---|---|---|
| Dataset History | Lists data transformations induced by data-modifying operations. | ? |
| Dataset Annotation | A free text format box used by users to annotate data files, projects and images. | ? |
| Experiment Information | Displays available experiment information associated with a Microarray dataset. | ? |
| Marker Annotation | Retrieves CGAP annotations for selected genes. | ? |
| caBIO Pathway Listing | Displays BioCarta pathway diagrams for selected genes. | TBD |
| Go Terms | Categorization of selected genes provided by the Gene Ontology Consortium (http://www.geneontology.org) displayed in a tree structure. | TBD |
Network Generation
| Plugin | Description | Compatibility |
|---|---|---|
| Reverse Engineering | Analyzes a large amount of microarray data (typically 100-500 microarrays) to reverse engineer the underlying gene regulatory network. | ? |
| Cytoscape | Visualization of gene regulatory network created in Reverse Engineering using Cytoscape 2.0 (http://www.cytoscape.org/). | ? |
Analysis
| Plugin | Description | Compatibility |
|---|---|---|
| Hierarchical Clustering | Hierarchical clustering groups markers into clusters on the basis of similarities in their expression profiles to form a hierarchical tree that can be viewed in the Dendrogram View window. | ? |
| Self Organizing Map (SOM) | An algorithm to perform clustering of real vectors defined on an instance space of dimensionality. | ? |
| T Test | The t-test determines if for each marker there is a significant difference between two groups.The T-test analysis implementation is based on code from the Multi Experiment Viewer (MEV) platform (http://www.tm4.org/mev.html). | ? |
Sequence Analysis
| Plugin | Description | Compatibility |
|---|---|---|
| Synteny | A utility for comparison of extended genomic regions.- | ? |
Pattern Discovery
| Plugin | Description | Compatibility |
|---|---|---|
| Promoter Panel | This visualization panel uses the JASPAR Transcription Factor Binding Profile Database (http://jaspar.cgb.ki.se/cgi-bin/jaspar_db.pl ). The promoter panel can be used to visualize transcription factor binding sites (TFBS). | ? |
| Sequence Alignment | --. | ? |
| Sequence Panel | Displays result from the Sequence Discovery Component where each sequence in the selected dataset is displayed as a thin red line proportional to the sequence length. | ? |
| Position Histogram | Displays results from the Sequence Discovery analysis plotting the positions of SPLASH motifs as a Position Histogram. | ? |
| Dot Matrix | Displays the syteny analysis results as a comparison of two genomic regions with detailed annotation for both regions. | tbd |
Filters
| Plugin | Description | Compatibility |
|---|---|---|
| Affy Detection Call | (Affymetrix data only) Sets all measurements whose detection status is any user-defined combination of A, P or M as missing. | TBD |
| Deviation | Sets all markers whose measurements deviate below a given value across all microarrays as missing. | ? |
| Expression Threshold | Sets all markers whose measurements are inside (or outside) a user-defined range as missing. | ? |
| Genepix Flag Filter | (Genepix data only)Designate as “missing” measurements whose Flags column assume specific user selected values. | ? |
| Missing Values | Discards all markers that have “missing” measurements in a user-defined range of microarrays. Another filter must first be applied however, in order to generate the missing values upon which this filter can operate. | TBD |
| 2-channel Threshold | (Genepix data only) Defines applicable ranges for each channel, and sets all values for which either channel intensity is inside (or outside) the defined range as missing. | TBD |
