Difference between revisions of "Screenshots"
(→Expression Profile) |
(→Statistical tests and clustering) |
||
| Line 83: | Line 83: | ||
==Statistical tests and clustering== | ==Statistical tests and clustering== | ||
| + | |||
| + | ===Gene Ontology Term Over-representation Analysis=== | ||
| + | |||
| + | [[Image:T_GO_Terms_TableBrowser_Gene_Detail.png]] | ||
===T Test=== | ===T Test=== | ||
Revision as of 18:20, 12 February 2010
Contents
Microarray Data Displays
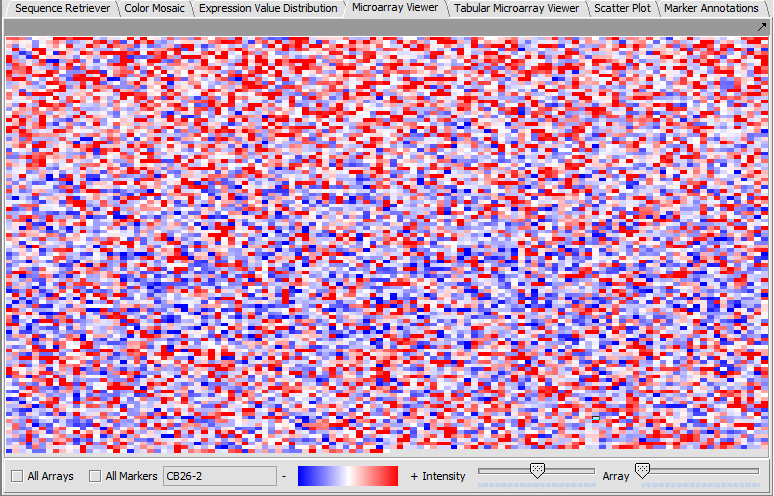
Microarray Viewer
The Microarray Viewer displaying marker values for selected array.
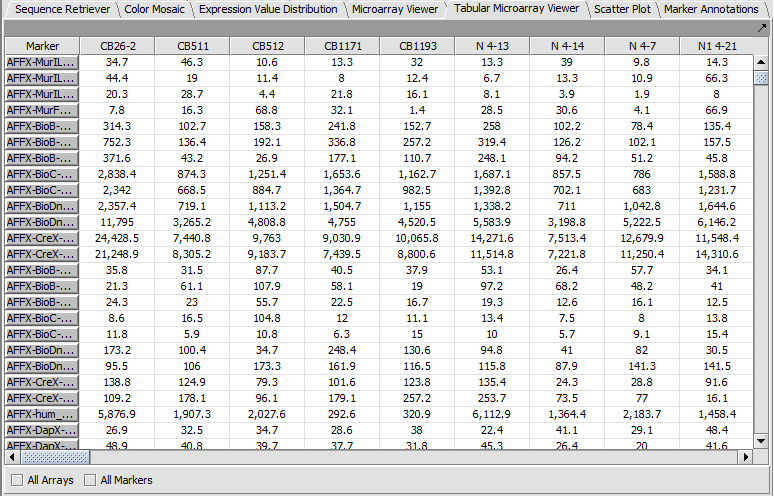
Tabular Microarray Viewer
The Tabular Microarray Viewer displays expression values in spreadsheet format.
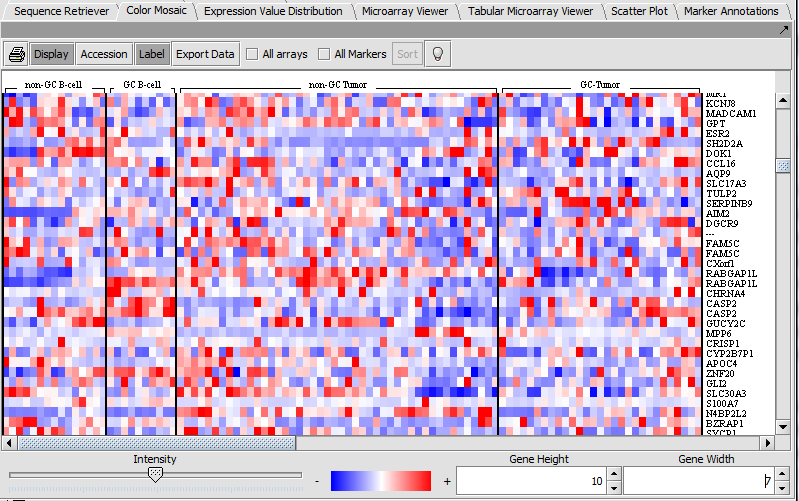
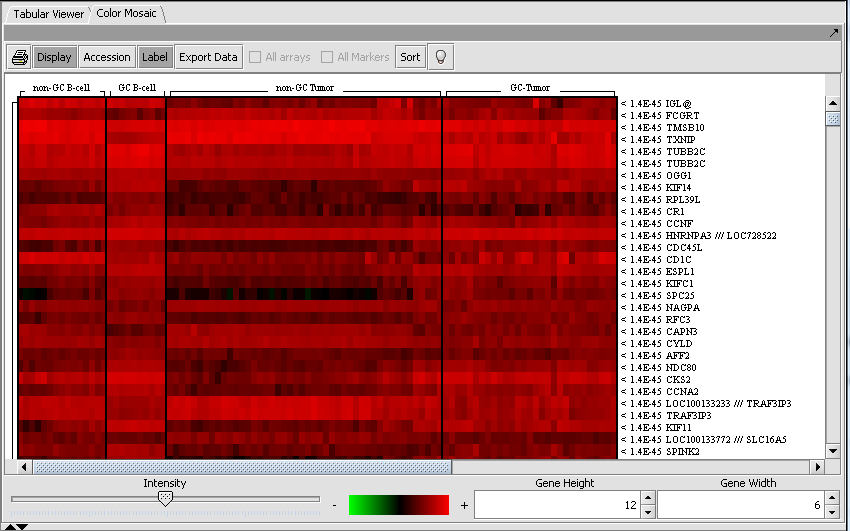
Color Mosaic
The Color Mosaic component displaying selected arrays, group designation and marker names.
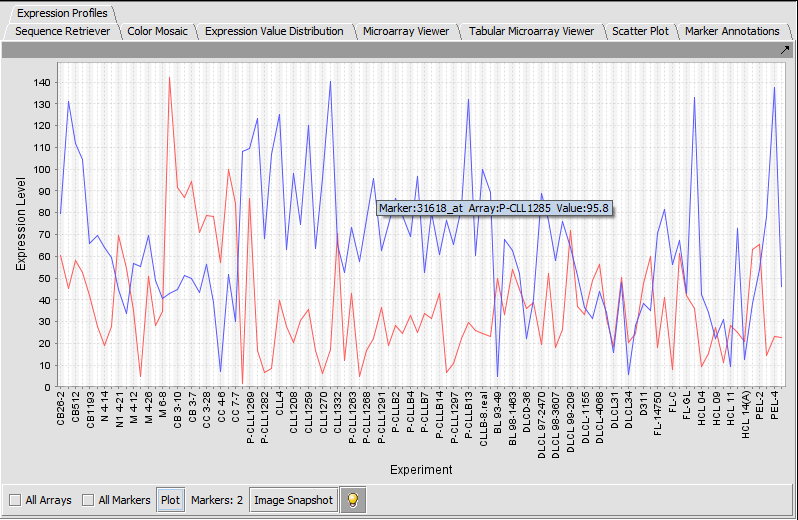
Expression Profile
Expression Profile plotting values for selected markers and arrays.
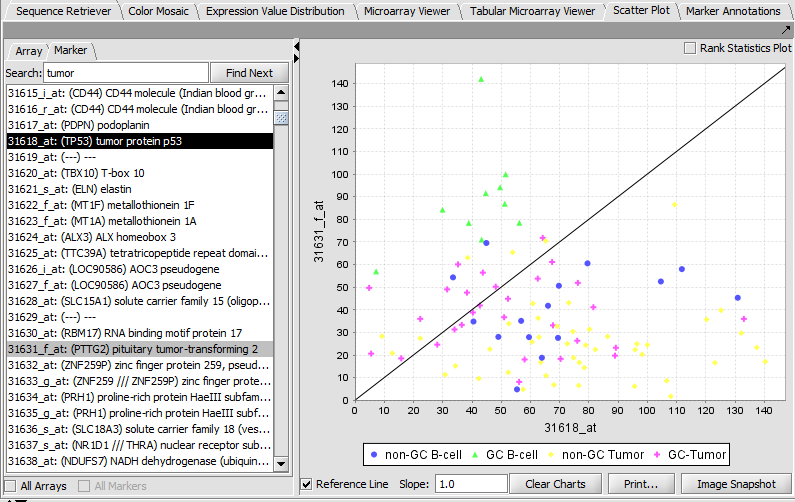
TP53 (31618) and PTTG2 (31631_f_at)
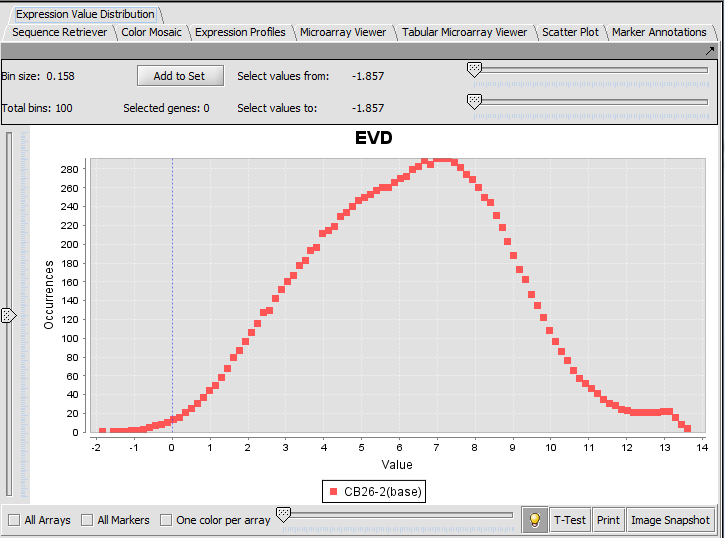
Expression Value Distribution
Scatter Plot
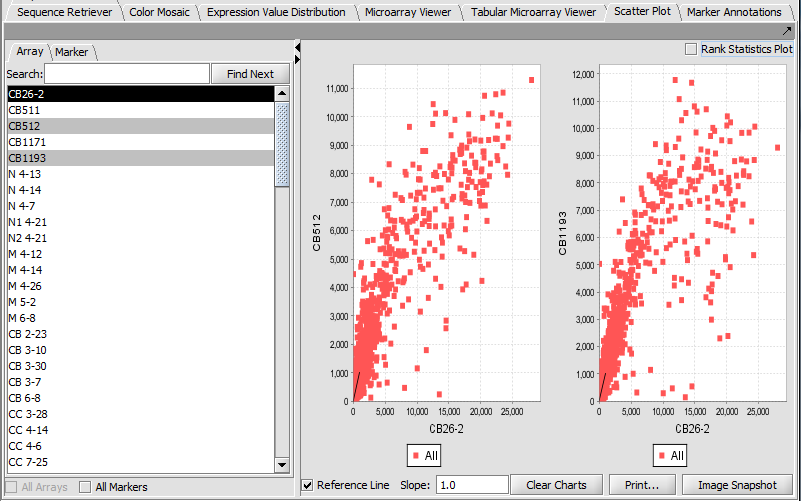
Compare multiple markers or arrays with the standard Scatter Plot analysis.
Array vs Array
Marker vs Marker
Gene and Pathway Annotations
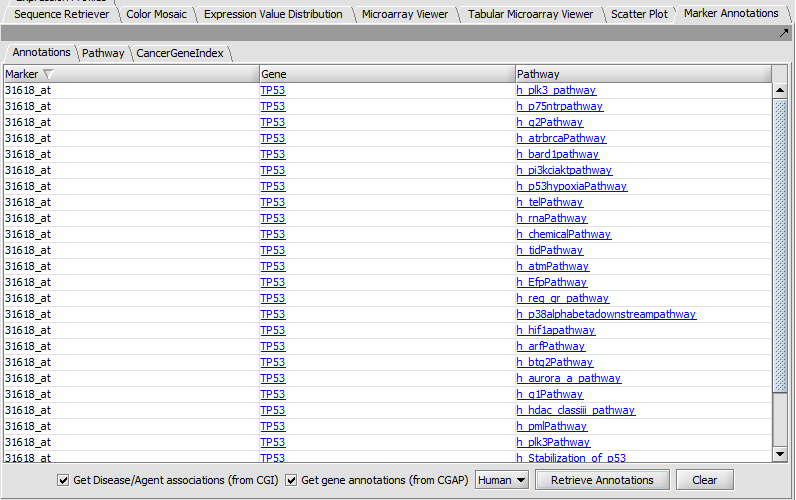
Marker Annotations
Retrieve and display gene and pathway information from CGAP and Cancer Gene Index (CGI).
Marker Annotations - BioCarta Pathways
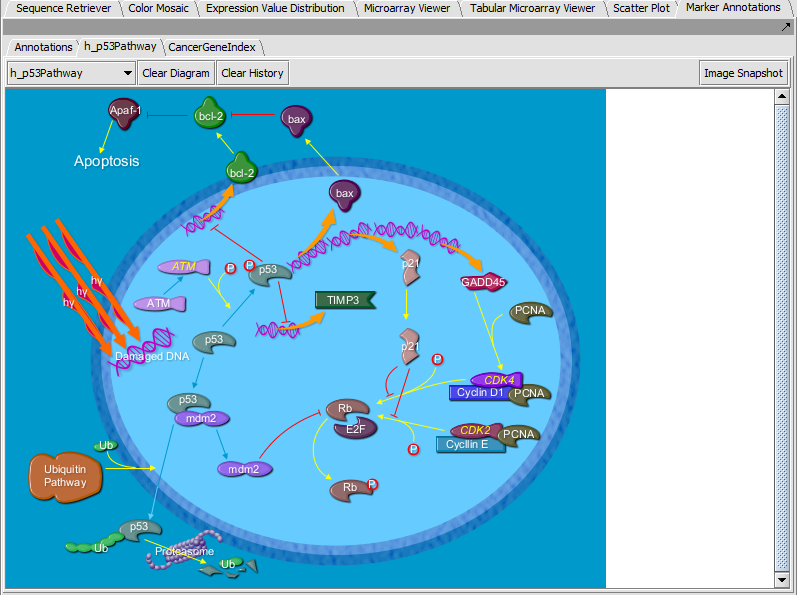
Displays BioCarta images retrieved from caBIO.
Marker Annotations - Cancer Gene Index
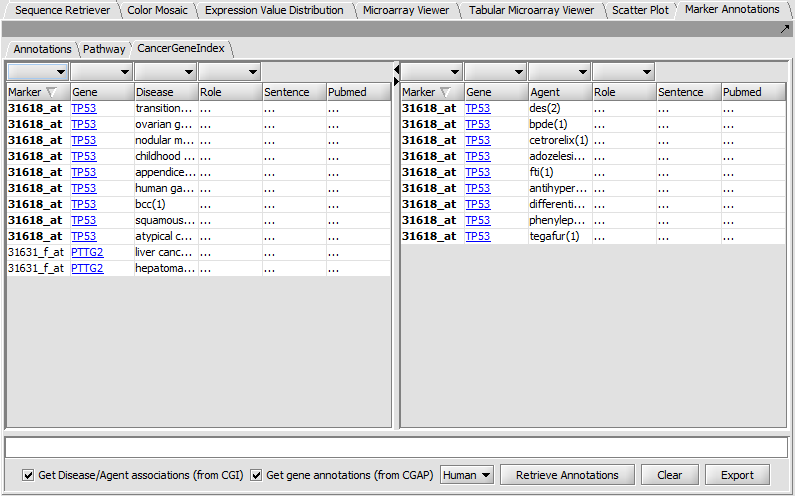
Displays literature citations from the Cancer Gene Index project.
Statistical tests and clustering
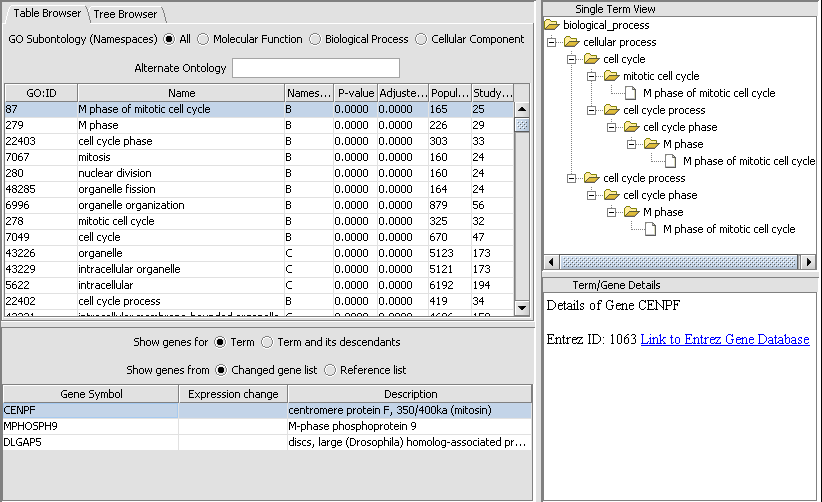
Gene Ontology Term Over-representation Analysis
T Test
Volcano Plot
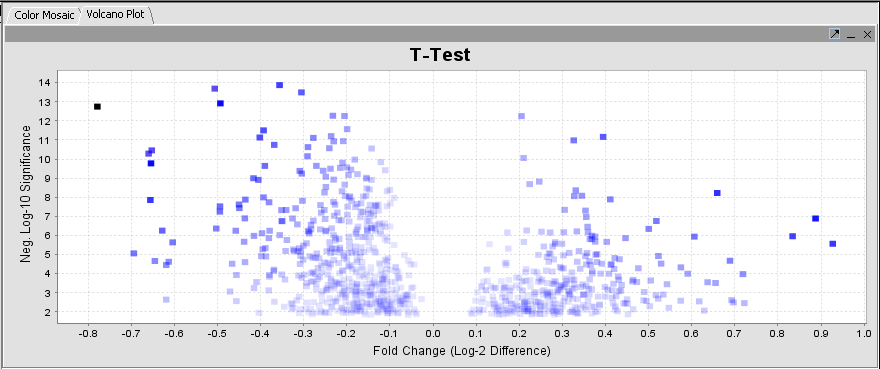
A t-test result display on a "volcano plot": Log significance vs log fold change.
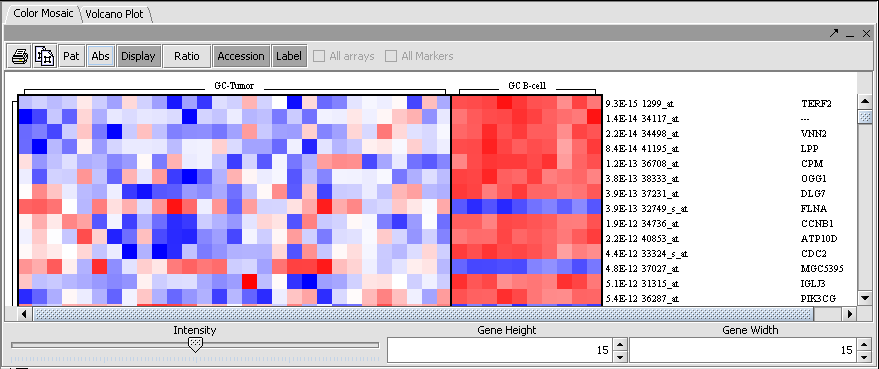
Color Mosaic
The t-test result can also be displayed as a color mosaic.
(Visualization preference setting: Relative)
Analysis of Variance (ANOVA)
Detects markers for which a statistically significant difference exists in a data set containing multiple classes of samples.
(Visualization preference setting: Absolute)
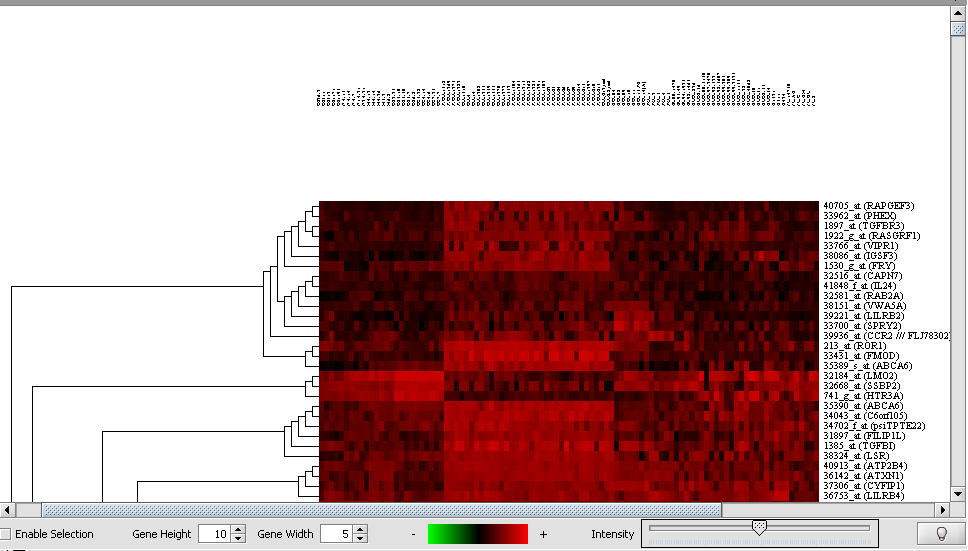
Hierarchical Clustering Dendrogram
A Dendrogram displays the results of the Hierarchical clustering analysis.
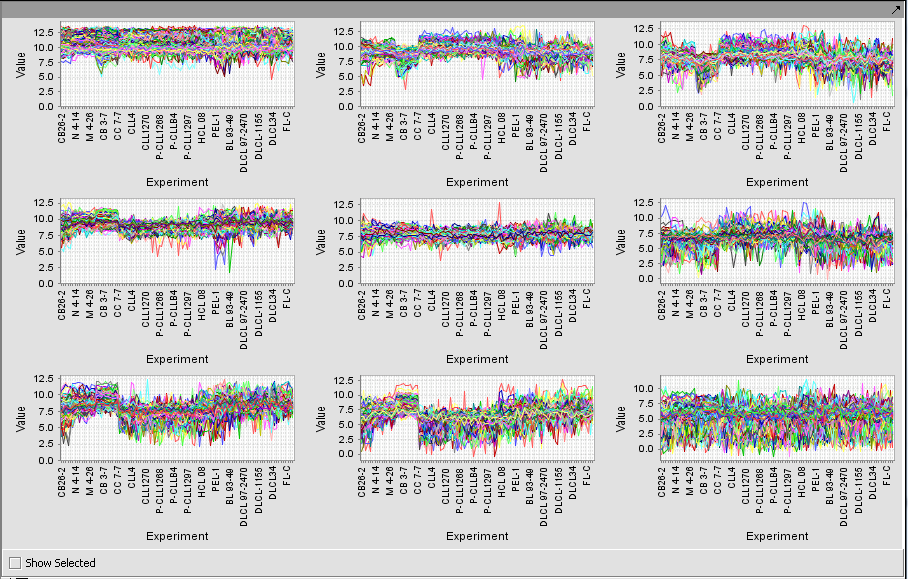
SOM Clustering
Self Ordered Map clustering results are displayed as series of expression profiles corresponding to discovered groupings.
Sequence Analysis / Pattern Discovery
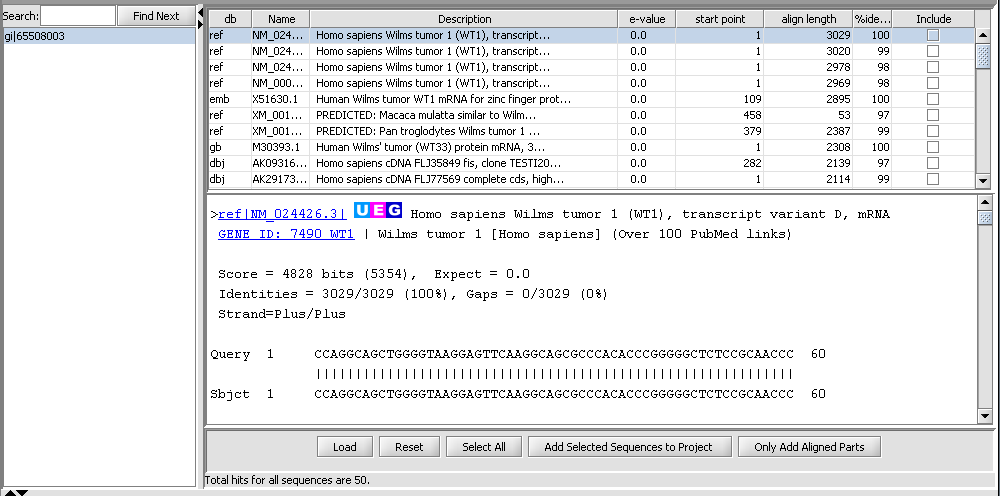
BLAST Queries
The Sequence Alignment component submits BLAST jobs to the NCBI server and displays the results such that individual hits can be used in further analysis steps.
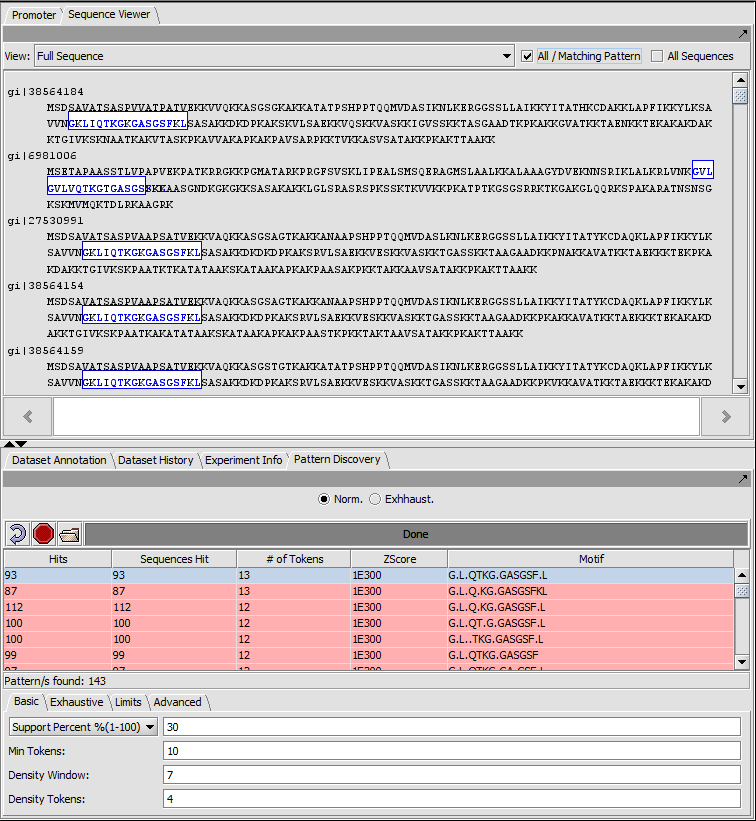
Pattern Discovery
Use the SPLASH algorithm to discover sparse amino or nucleic acid patterns in a loaded sequence.
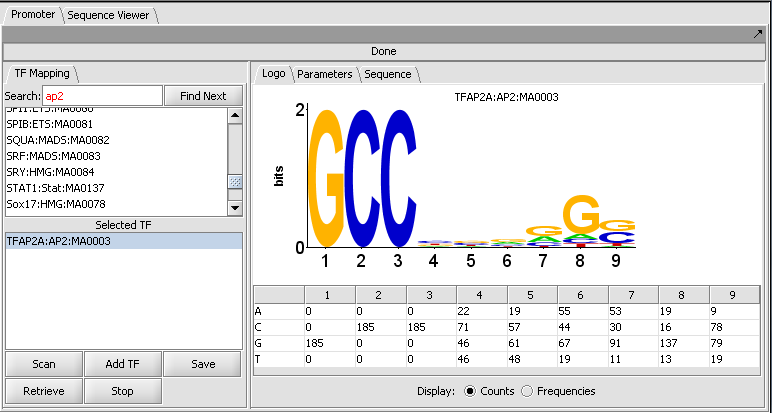
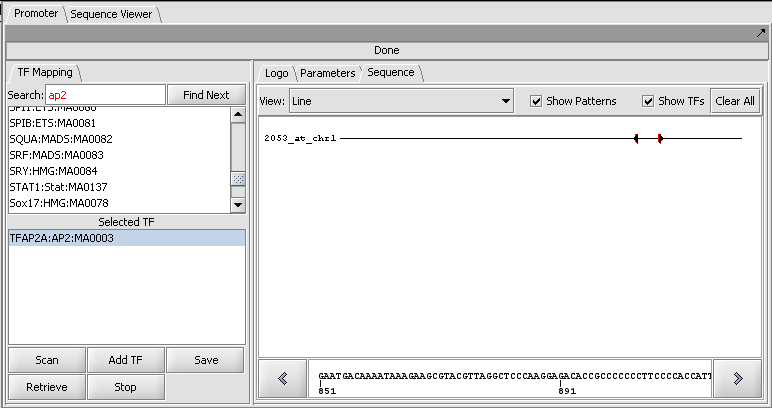
Promoter
Individual motifs from the JASPAR Transcription Factor Binding Profile Database can be scanned against loaded genomic sequences.
Motif selection and Logo display
Result of a scan against a single sequence
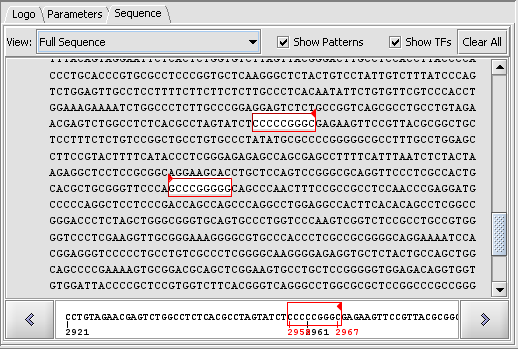
Sequence-level display of match
Network Discovery and Visualization
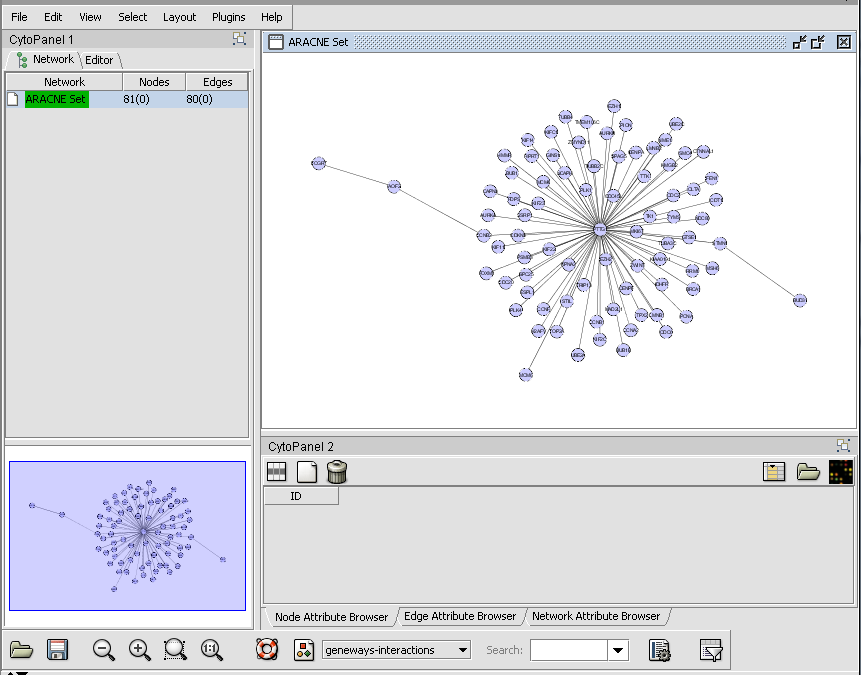
Cytoscape - ARACNe Network display
The adjacency matrix generated by an ARACNe network reverse engineering run displayed in Cytoscape.
Cellular Network Knowledge Base
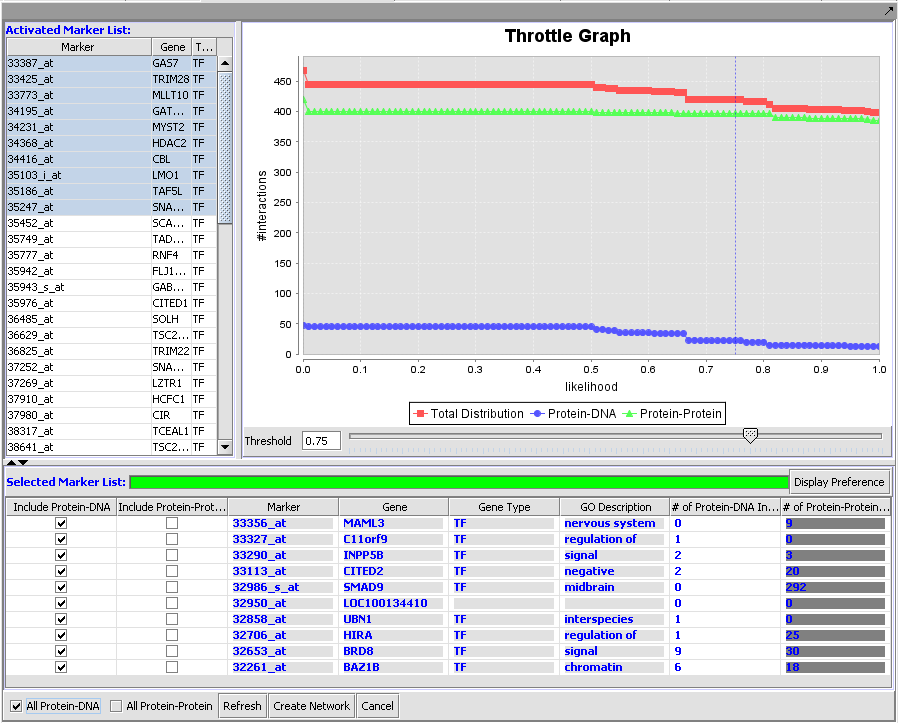
Results of queries against the CNKB can be filtered based on confidence values using the throttle graph.
Query results and Throttle Graph
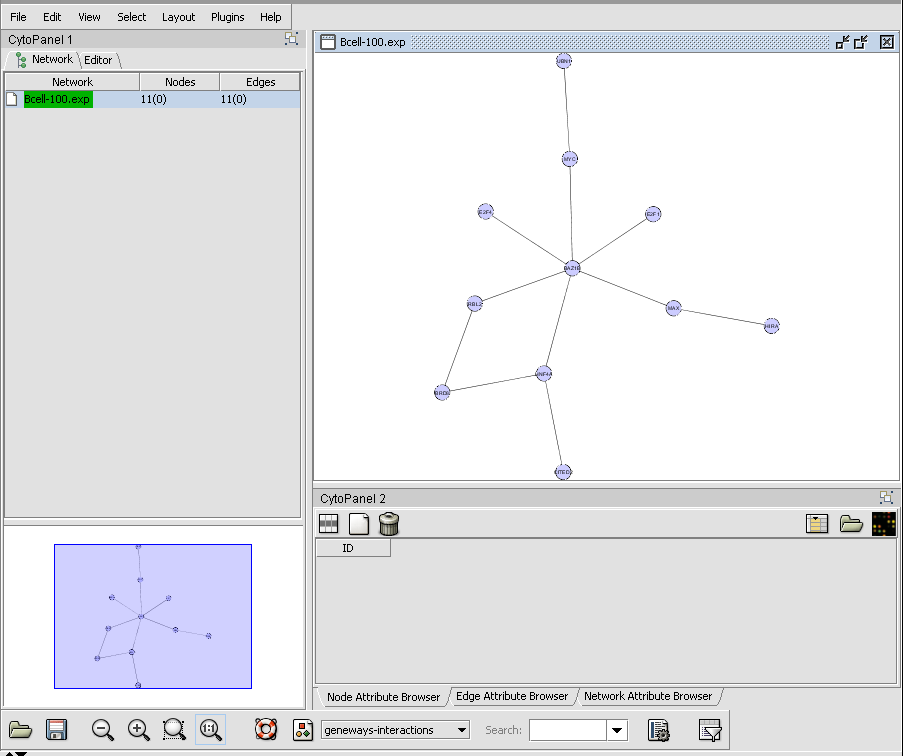
CNKB query results displayed in Cytoscape
Display of protein-DNA interactions produced with throttle graph set at 75% confidence in above picture.
