Difference between revisions of "User talk:Smith"
(→6/2/2006: Sequence) |
(→5/11/2006: Marker Annotations) |
||
| Line 283: | Line 283: | ||
=> This should be explained in more detail. It took me some time to figure out what you meant. | => This should be explained in more detail. It took me some time to figure out what you meant. | ||
| + | |||
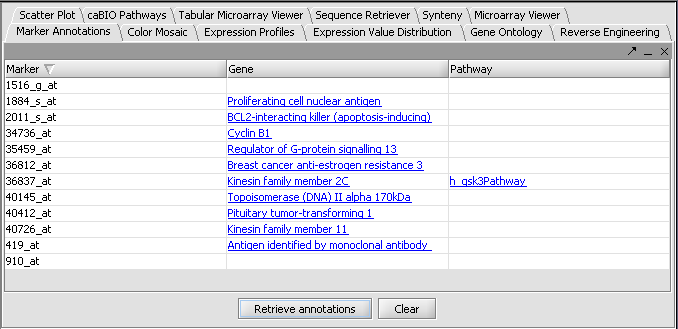
| + | KCS - I added a link to a picture of selecting markers in the Markers component. | ||
| Line 293: | Line 295: | ||
This obviously needs some further thoughts and discussions. | This obviously needs some further thoughts and discussions. | ||
| − | |||
| − | |||
===5/11/2006:; Sequence Retrieval=== | ===5/11/2006:; Sequence Retrieval=== | ||
Revision as of 17:31, 14 July 2006
Contents
- 1 Notes from Bernd on Tutorials, plus responses.
- 1.1 5/9/2006:T-Test
- 1.2 5/9/2006: Clustering
- 1.3 5/10/2006:Basics
- 1.4 5/10/2006: Project and Data Files
- 1.5 5/10/2006: Data subset
- 1.6 5/10/2006: remote data
- 1.7 5/10/2006: Viewing microarray dataset
- 1.8 5/10/2006: Filtering and Normalization
- 1.9 5/11/2006: Marker Annotations
- 1.10 5/11/2006:; Sequence Retrieval
- 1.11 5/11/2006: Blast
- 1.12 5/11/2006: Pattern Discovery
- 1.13 5/15/2006: Promoter Analysis
- 1.14 5/15/2006: Reverse Engineering
- 1.15 5/15/2006: GO Term enrichment
- 1.16 6/2/2006: Sequence
- 2 NOTES
- 3 stuff cut out from other pages for possible later reuse:
Notes from Bernd on Tutorials, plus responses.
5/9/2006:T-Test
Comments on:
http://www.geworkbench.org/workbench/index.php/Tutorial_-_Differential_Expression
All in all nothing much to complain, great example (i.e. it is working for me and I understood, at least I think so)
- Where is the Multi T Test sample?
KCS RESPONSE - I have added a multi-t-test example.
- A reference for the T-test would be nice.
KCS RESPONSE - I have added a web-site link to a description of the t-test.
- Why is it “T Test” and not “T-test” or something else? (it just looks strange, but I don’t know what is right)
KCS RESPONSE - I have at least made it t-Test or t-test now. It is still a bit inconsistent.
T Test analysis identifies markers with statistically significant differential expression between two sets of microarrays. The t-test (T Test???) determines for each marker if there is a significant difference between the two groups (case and control). To perform this analysis, you must classify the panels(sets of microarrays) as “case” and “control”, set the analysis parameters and view the results in the visualization components. A detailed description of the T Test parameters is described in the online help.
- I don’t have “Gene Panel” but rather “Marker” for the results.
KCS RESPONSE - fixed.
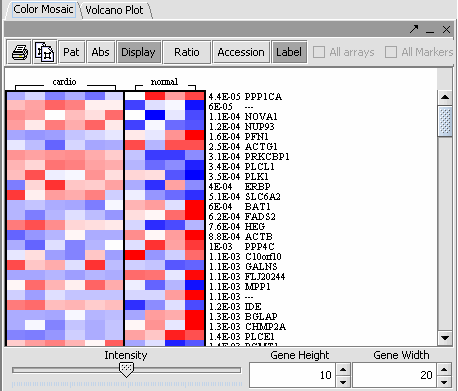
- The label to the right displays the Significance value (the lower the value, the more likely different) and gene name for the displayed genes. The genes are displayed in ascending order by Significance Value.
KCS RESPONSE - please restate this as a question.
- Pat, Abs, Ratio Overlapping Pages Icon: Not the T Test display. => why italic? For me they don’t do anything, does it mean they shouldn’t be there?
KCS RESPONSE - no, they don't seem to do much. I have taken out the extraneous text.
As to the functionality:
- Gene height and gene width can take negative values, this is a bug! (Color Mosaic)
- Pat, Abs, etc don’t do anything (see above)
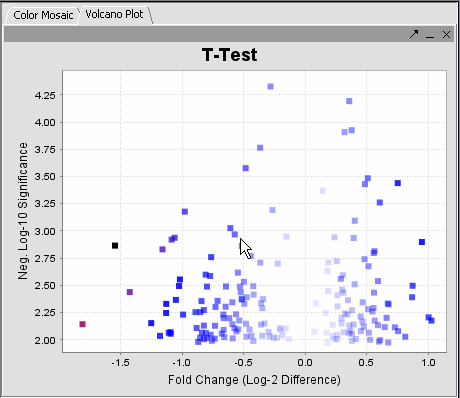
- Marking a gene in the Markers panel doesn’t do anything in the Volcano Plot.
- I can only zoom into the plot, but not mark any spots in either of the visualization panels
5/9/2006: Clustering
Comments on:
http://www.geworkbench.org/workbench/index.php/Tutorial_-_Clustering
- I guess you know that the data set is not available for download ;-)
KCS RESPONSE - it is there now (as of a few weeks ago now).
- "Go to the Analysis component, and select Fast Hierarchical Clustering Analysis"
- I believe there should be somewhere something said about the algorithm used for fast hierarchical clustering. Not all parameters are self explanatory.
KCS RESPONSE - there is a little problem with the algorithm right now....
- Should the check box called “enable zoom” or maybe “enable selection”? I think it might be kind of confusing this way.
KCS RESPONSE - good point, it is not really a zoom is it? I have entered this into Mantis.
And after this nice tutorial I am left with the question: And now what? Or, why did I do this, again?
KCS RESPONSE - I have added a bit of context at the beginning....
5/10/2006:Basics
Comments on:
http://www.geworkbench.org/workbench/index.php/Tutorial_-_Basics
- The Data Management area can hold one workspace, and a workspace in turn can hold one or more projects. Projects can be used as wished {remove} to group different data sets. Each opened data file or analysis result is stored in a project [This is not really clear. Especially I would like to know something about the general concept of merging files vs. not merging files]. A workspace with all the data [what about the state of the data, especially what happened to like analyzing the data and its results?] it contains can be saved and returned to later.
- The GUI provides a menu bar at top with a standard choice of commands. Many commands that are available in the menu bar are also available by right-clicking on data objects.
That is not entirely true. Usually you have an exit function under File, which is missing
In general I would like to see some more details on the Project/File concept as eluded on earlier. I think this is a good place to put this information and I haven’t seen it anywhere else
RESPONSE by KCS - I have added a section about data representation which introduces files and merging. There is another section of the tutorials called Projects and Data Files which describes some of the mechanics.
5/10/2006: Project and Data Files
Comments on:
http://www.geworkbench.org/workbench/index.php/Tutorial_-_Projects_and_Data_File
KCS - These responses were added 6/2/2006.
- Affymetrix File Matrix - this is the native file type created by geWorkbench
- I actually don’t know how to create this file from geWorkbench…
KCS - I have added more about merging....
- By the way you when we were talking about Matlab you said you only support free software: What about Affymetrix??? Are Genepix RMA Express free as well???
KCS - Affymetrix is our primary data source. Matlab is an analysis program that we do not have ourselves.
- What are Pattern Files?
- What are Genotypic data Files (should be files not Files, same for FASTA Files and Pattern Files and others)
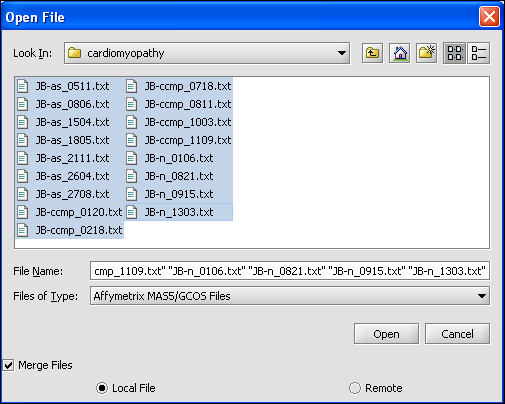
- We select the 10 MAS5 format text files from the directory geworkbench\data\training\cardiogenomics.med.harvard.edu, which is included in the geWorkbench download as shown in the picture below.
- I don’t get the message that you show
KCS - you probably had already loaded a file of that type, so its definition did not need to be reloaded.
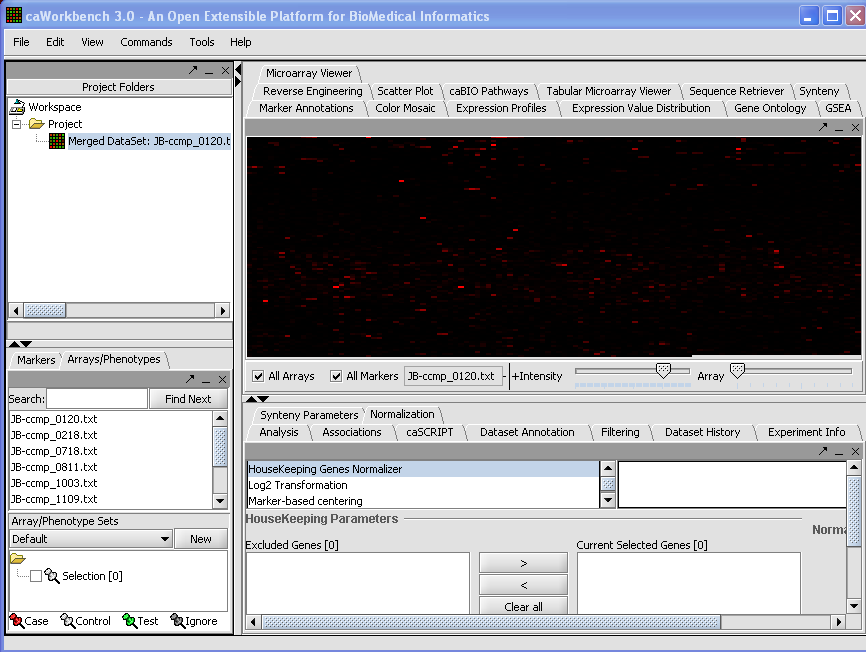
- The merged dataset is listed in the Project folder. The data is displayed, in single array format, in the Microarray Viewer. Note we have increased the intensity slider to maximum here.
- Here you should mention that you only see the first/last array and that you can scroll through the arrays with the array slider
KCS - I have added this.
- There are no Okay buttons, but rather OK
KCS - fixed.
- I mentioned this somewhere else already: When you want to delete/remove a bunch of data nodes you can select them, right click them, but only one file is then removed = BUG!
KCS - You should add this to Mantis.
- Ah, now I see how you can save your special geWorkbench file. Maybe you should mention here that this is actually saving the data in this particular format. (At least I assume it does so)
KCS - added more explanatory text.
- For the remote upload: The difference between Open and Go is not clear to me. Here is THE place for me where I am missing the mouse over help messages.
KCS - added explanatory text.
- The first image is not correct. For me it doesn’t show all the array experiments
KCS - The image is correct as far as I know...
- It is totally NON intuitive to have to right-click on a remote dataset to get additional information. It was at first not even obvious that there is additional data available…
KCS - I completely agree, this is the oddest thing....
- It is interesting that you chose this example, because it seems that only four or so of all the entries actually have derived assays. ;-)
KCS - not by chance....
- Maybe you want to explain what derived assays are?
KCS - Added....
- Also for the remote source, I would like to know what other sources are there and how the interface should look like. I have no clue what and why and how I should link other sources.
KCS - there are actually no other sources. This is for future reference.
- Maybe this is another place to put some more information about merging files…
KCS - another mention of merging has been added.
5/10/2006: Data subset
Comments on:
http://www.geworkbench.org/workbench/index.php/Tutorial_-_Data_Subsets
- I would like to see a reference to the paper/web page where you took your example from. This way the interested reader can get some insights into the biological question…
KCS RESPONSE - I have added this info to the Tutorial_-_Data page.
- I don’t think you the Activate/Deactivate functions under the right mouse click.
KCS RESPONSE - Activate/Deactivate work for me.
5/10/2006: remote data
Are you sure that the remote data function is working correctly. I seam to have trouble loading some of the data… KCS - RESPONSE 6/5/2006 - I can load caArray data normally
5/10/2006: Viewing microarray dataset
Comments on
http://www.geworkbench.org/workbench/index.php/Tutorial_-_Viewing_a_Microarray_Dataset
- in the visualization panel I don’t think the alignment of properties and corresponding names is ideal, but that is just optical
KCS RESPONSE - I don't understand the comment - what exactly are you refering too?
- Why does it say “+ Intensity”?
KCS RESPONSE - If you stretch out the display horizontally a bit, you will see the color-code bar appear, which shows the color spectrum from - to + expression maxima. It is probably a bug that this disappears when screen real-estate gets tight.... I have entered it into Mantis.
- Why is there a bluish bar underneath the slider of Intensity?
KCS RESPONSE - I think it is for esthetics.
- When removing object, maybe the delete button should do the same thing
KCS RESPONSE - The same thing as what? I don't understand the comment.
- The images created (right click, image snapshot) can be saved and exported (File-> export).
- When analyzing sets of arrays, wouldn’t it be helpful to have a mean/median function over all spots at specific positions. This way systematic errors can be detected.
KCS RESPONSE - I am not sure what you mean. We should discuss this in person.
- Expression Profiles: This is a line graph of gene[s] expression profiles across several arrays/ hybridizations. [space] Each marker is a separate color line.
KCS RESPONSE - rewrote section.
- Scatter Plot: A pairwise (array vs. array and marker vs. marker) comparison and plotting of expression values. [One array servers as the reference (x-axis serves, set by right-clicking and selecting x-axis, dark background) and subsequent arrays are plotted against this reference in different sub images. Up to six sub images can be created.]
KCS RESPONSE - changes incorporated.
- Genepix Value Computation: You can specify how to compute the value displayed for a Genepix array. The default setting is Option (Mean F635 - Mean B635) / (Mean F532 - Mean B532).
KCS RESPONSE - corrected.
- I don’t know anything about Genepix, but I assume that everyone playing around with geWorkbench and microarrays would know this, right?
- Select Relative for the visualization preference. Note that this choice will not take effect until the next time you load a data set.
- I would consider this as a bug!
KCS RESPONSE - I don't know why this is so, you can enter it as an enhancement request.
Great page!
5/10/2006: Filtering and Normalization
Comments on:
http://www.geworkbench.org/workbench/index.php/Tutorial_-_Filtering_and_Normalizing
KCS RESPONSE - all corrections/suggestions below were acted on. The page was mostly rewritten, and all new screenshots supplied. The detailed example 1 was added, which explains how the normalized and filtered data set used in many of the other tutorials was created.
Affy Detection Call
Applicable to Affymetrix data only. Sets all measurements whose detection status is any user-defined combination of A, P or M as missing.
- are you sure that everyone knows A, P, or M?
4. Choose the maximum number of arrays that can have missing values before a/the marker is removed – default is 0.
- Somehow I have difficulties to understand what is going on, but that can be me or my sleepyness…
Normalizers:
AS you know, I don’t much about micro array analysis, but from what I understood from my friends, is that normalization is a BIG issue. So I would guess that there should be done much more on this front. When the starting data is not optimal you can’t expect much from later analysis. Therefore I would make this a high priority.
- You haven’t mentioned the quantile Normalizer in the list of normalizers. What about houseKeeping Genes Normalizer
- It is either missing value computation (as in my program) or missing value calculation (web-page)
5/11/2006: Marker Annotations
Comments on:
http://wiki.c2b2.columbia.edu/workbench/index.php/Tutorial_-_Marker_Annotations
1. The desired marker set is activated by checking its box in the Marker Sets component.
=> This should be explained in more detail. It took me some time to figure out what you meant.
KCS - I added a link to a picture of selecting markers in the Markers component.
Otherwise everything is straight forward.
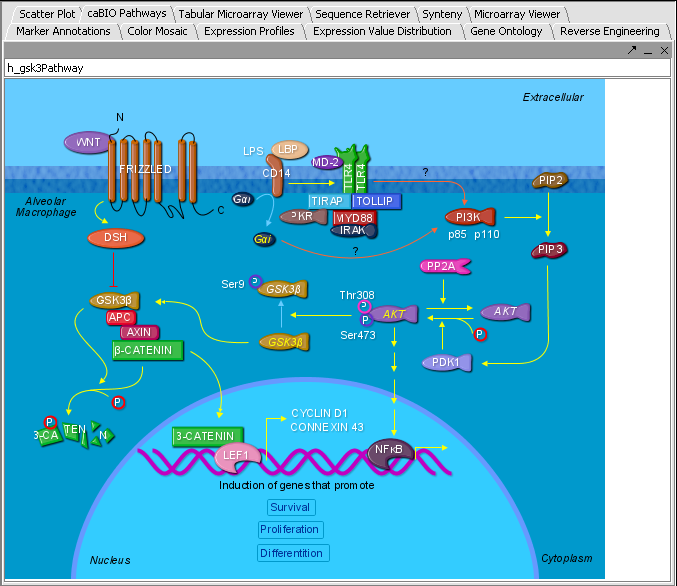
There is much you can do here. It would be good if you could incorporate some of the information into geWorkbench for further analysis. Of the top of my head I can think about retrieving sequence for alignments, combining pathway information: which common elements are within the pathways my array/experiment came up with etc…
This obviously needs some further thoughts and discussions.
5/11/2006:; Sequence Retrieval
Comments on:
http://wiki.c2b2.columbia.edu/workbench/index.php/Tutorial_-_Sequence_Retrieval
You forgot to mention that you have to add the sequence to the project, they are not automatically imported.
When playing with the sequence features, I realized that the distinction between the visualization panel and the analysis panel is not clear enough.
There is no scroll bar for the sequences = BUG!!
The squence that is displayed should be marked in the window, otherwise it has no meaning.
I saw some stretches of “EEEEEEEEEEEEEEEEEEEEEE” are those correct, never saw them in NCBI.
Where do the promoters in the Promoter panel come from? Where are they located on the sequence?
Is the length of the squence normalized? I believe that the line in the visual panel represents the sequence, but why are the all the same length?
Is this the squence from the array or the sequence from the associated gene/ predicted associated gene?
When using the analysis try to modify the vertical size of the panel: You will see that the BLAST/STOP buttons disapear pretty soon and it look awkward what is happening there.
How long does BLAST run, but I guess this belongs in the next page.
5/11/2006: Blast
Comments on:
http://wiki.c2b2.columbia.edu/workbench/index.php/Tutorial_-_BLAST
I don’t think it is a good idea to put the advanced options on a separate page next to all the other tools. Does this mean that those advanced options are also for HMM etc?
Service is now called Server_Info
I don’t have the NCBI option.
Also the All Markers and total sequence number is not displayed.
There is no Main tab
You can mouse over the result set to see how many sequences are in it
ð I can’t
The “Add Selected Sequence to Project” button looks more like an editable field than a button. Somehow the colors seem weird.
The selected sequence show up on the same level as the target sequence, is this correct? What if I have several Blast searches and select from all of them some sequences?
I can’t combine the sequence into a dataset
In the pane at left in the picture below, the name of the input query sequence is shown.
ð what do you mean?
It would be probably nice to be able to sort the output table by the description or name etc
The part of the window with the actual alignment should show the beginning of the alignment not the end = BUG
All in all I don’t think this is solved in an optimal way…
It seems that you were using an older/other version of geWorkbench for the web tutorial….
5/11/2006: Pattern Discovery
Comments on
http://wiki.c2b2.columbia.edu/workbench/index.php/Tutorial_-_Pattern_Discovery
There is no ‘Create” button but rather the circular arrow that does the job.
The server is not set with the default “splash.cu-genome.org”
Viewing all patterns can be VERY slow
There should be a link included to the paper describing SPLASH
The result of the search can be viewed both in the Pattern Discovery module itself and in other sequence viewer modules such as "Sequence" and "Promoter".
- I can’t see the pattern in promoter
- in Sequence only ONE pattern can be selected at a time = BUG??
- it can be viewed only in the parent sequence (at least I hope)
It seems that tool is actually quite interesting. It would be good to be able to use these patterns to search for additional sequences that have this pattern, for example in all the up regulated sequences from a micro array experiment.
I have tried “Add patterns to Project” but I don’t think I was successful….
At some point the application became very slow to respond. I am not really sure why though.
5/15/2006: Promoter Analysis
Comments on:
http://wiki.c2b2.columbia.edu/workbench/index.php/Tutorial_-_Promoter_Analysis
The Promoter Component allows a set of sequences to be scanned by selected motifs of known transcription factor binding sites. These motifs are derived from the Jasper project. The motifs are in the form of PSSM - Position Specific Scoring Matrices. One or more of the motifs can be selected by double-clicking on them in the list box. The selected motif will be added to the search box just below. When the desired search [space] is ready, hit the scan button. The results of the search will be shown superimposed on lines representing the sequences just to the right. Hits from different TF motifs will be displayed in different colors.
Where can I find “clusterTree38_Sequences.fasta”?
When opening geWorkbench it should start with an empty project.
Why is the scanning so slow?
The names of the TFs should be color coded as well
Stop button doesn’t work
5/15/2006: Reverse Engineering
Comments on:
http://wiki.c2b2.columbia.edu/workbench/index.php/Tutorial_-_Reverse_Engineering
After the Mutual Information algorithm has been run, an adjacency matrix will be placed in the Projects Folder:
ð you forgot to mention that running means “create network”
switching to organic is COOL!!!
In Cytoscape the window cannot be changed by clicking on the panel heads, only by selecting the network name.
I don’t know if this should be corrected, but anyway: I accidentally resized a node in the graph. When switching back and forth between two networks the original size was restored. I didn’t find any other way to this, other by changing the size back manually, even remodeling the graph by doing another “organic” didn’t work…
With all the links to different browsers why not one to pubmed?
What is the graph with Probability/Score for?
5/15/2006: GO Term enrichment
Comments on:
http://wiki.c2b2.columbia.edu/workbench/index.php/Tutorial_-_GO_Term_Enrichment
building a tree is not really that fast….
And once it finished, I can’t execute the map lists again, I didn’t get any results
So I don’t really know what is going on…
Looking at the synteny tutorial, there is not much more to do… ;-)
6/2/2006: Sequence
- When loading a sequence from GenBank the name of the sequence is the identifier from GenBank. I believe the name should not only be a number but there should be information that identifies the number as a GenBank id. E.g. gi_1234
- It should be possible to select and copy portions of the sequence.
- When resizing the window, the number of characters to be displayed is adjusted. This takes a lot of time, but looks kind of nice, too. I still think that this can be done faster
- In the parameters window the parameters are centered, this somehow looks awkward, but I can’t think of anything better, having it either on the top or bottom would create a large space underneath…
- when double clicking on the line sequence, the View doesn’t change from Line to Full sequence even though the view changes as expected
- After I removed a project the sequence is still there. It seems the sequence and the data associated with the project are not really destroyed.
- Freeing memory seems not to be working
- I have loaded two sequences. The visual pane remembers which of (Promoter, Sequence, Position Histogram) panes is used for each sequence. But it doesn’t remember the individual options within those panes for each sequence. E.g. when I select the line view for one sequence and the Full sequence for the other, it will display the last selected viewing option.
- How can I display two sequences in one window?
- In line view the sequence is displayed in the lower section. In the description it says that the sequence is centered, but when I click on the line at a position 170 (show by the mouse over function) the sequence displayed is from 121-290.
- After the pattern discovery, there is something wrong with the mouse-over function for the sequence position (this also happens with the regular sequence window): The sequence position is displayed in a box next to the mouse. This is true for the whole sub-window and not only around the sequence line. When dragging the mouse over the sequence on the bottom of the screen then the part right of the mouse is removed and never restored even after moving back in the upper window.
- After sequence patterns have been generated and one or more patterns have been selected not all marked regions are correct. I had problems with sequence patterns TTG.TTTT. Here the pattern is displayed in blue on top of the original sequence, making it almost impossible to read those sections.
- with “All / Matching Patters” selected one has to double click the pattern to show the line display. Single click give a blank screen after I scrolled down in the pattern list.
- the numeric positions are displayed every 40 characters and not every 20 as described in the use case.
- left and right shift arrows are not present
NOTES
HistoneDB
The Histone Database: A Comprehensive Resource for Histones and Histone Fold-Containing Proteins Leonardo Marin˜ o-Ramı´rez,1 Benjamin Hsu,2 Andreas D. Baxevanis,2 and David Landsman1* PROTEINS: Structure, Function, and Bioinformatics 62:838–842 (2006) http://www.ncbi.nlm.nih.gov/CBBresearch/Marino/reprints/Proteins_838.pdf
http://research.nhgri.nih.gov/histones/web/complete.shtml
stuff cut out from other pages for possible later reuse:
When working with microarrays, geWorkBench uses the term marker to refer to a gene probe (in other cases, it can be individual items from other data sets, such as sequences).
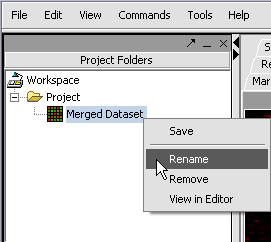
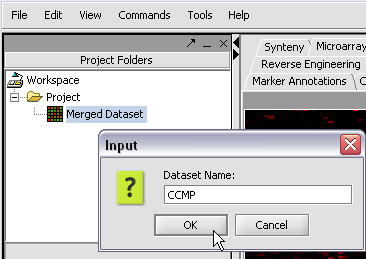
We can also rename the merged dataset by clicking on its entry in the Project Panel.
Here we will call it CCMP.
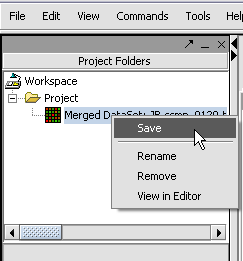
With the datasets merged, classified and named, we can save the dataset for future use. We will call it "cardiomyopathy.exp" (.exp is the default extension for the geWorkbench matrix file type).
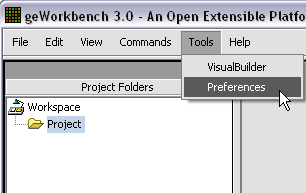
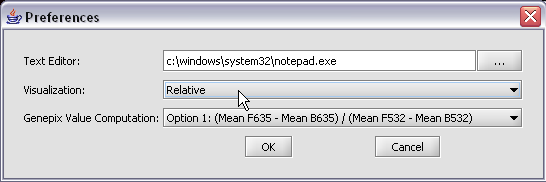
The default display of microarray data is an absolute display. We can change it to a relative display by selecting Tools:Preferences from the top menubar. We have removed the dataset so that we can read it back in using the new preferences.
Here we select the relative display type.
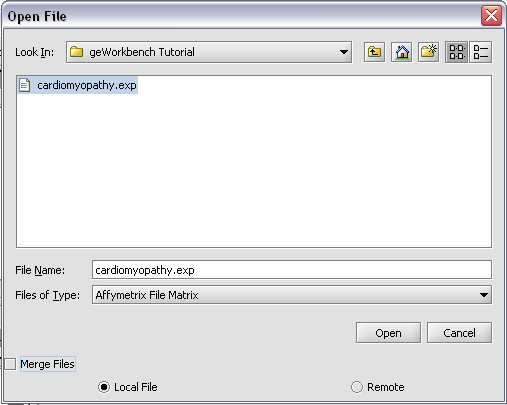
Returning to the Open File dialog as we before by right-clicking on the project entry, we will select the "cardiomyopathy.exp" file we previously saved...
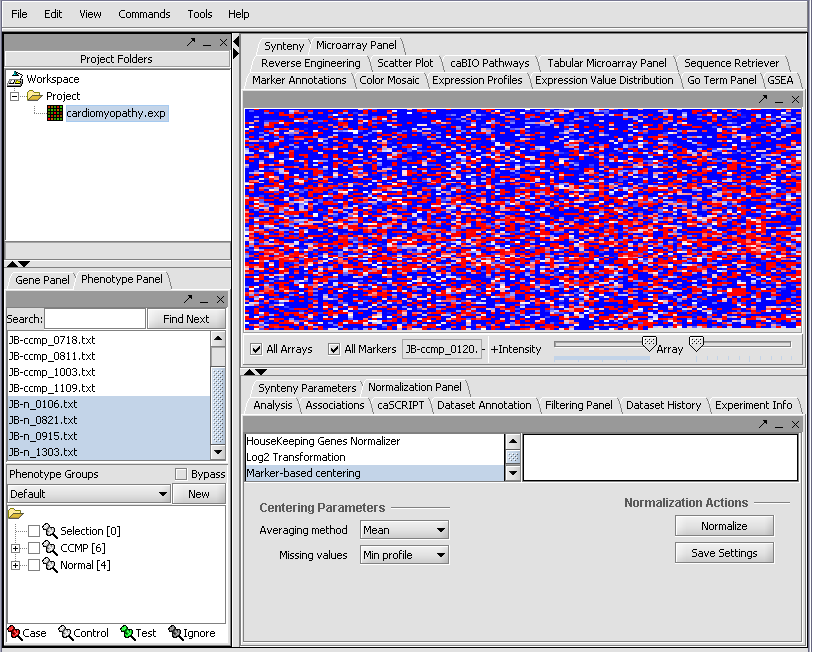
Resulting in the following colorful display of the array data for the first array....
Your File Nodes will now be Merged into one Project folder.
| Markers which met the significance test are included in a new Marker Set called “Significant Genes”. | 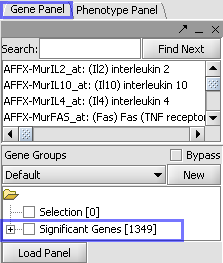
| |
| Ancillary dataset is created in the project window. | 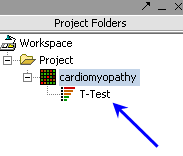
|
The values of the t-Test can be seen in the Color Mosaic panel and the Volcano Plot.
