User talk:Smith
Notes from Bernd on Tutorials, plus responses.
Contents
5/9/2006:T-Test
Comments on:
http://www.geworkbench.org/workbench/index.php/Tutorial_-_Differential_Expression
All in all nothing much to complain, great example (i.e. it is working for me and I understood, at least I think so)
   * Where is the Multi T  Test sample?
   * A reference for the T-test would be nice.
   * Why is it “T Test” and not “T-test” or something else? (it just looks strange, but I don’t know what is right)
T Test analysis identifies markers with statistically significant differential expression between two sets of microarrays. The t-test (T Test???) determines for each marker if there is a significant difference between the two groups (case and control). To perform this analysis, you must classify the panels(sets of microarrays) as “case” and “control”, set the analysis parameters and view the results in the visualization components. A detailed description of the T Test parameters is described in the online help.
o I don’t have “Gene Panel” but rather “Marker” for the results.
o The label to the right displays the Significance value (the lower the value, the more likely different) and gene name for the displayed genes. The genes are displayed in ascending order by Significance Value.
o Pat, Abs, Ratio Overlapping Pages Icon: Not the T Test display. => why italic? For me they don’t do anything, does it mean they shouldn’t be there?
As to the functionality:
Gene height and gene width can take negative values, this is a bug! (Color Mosaic)
Pat, Abs, etc don’t do anything (see above)
Marking a gene in the Markes panel doesn’t do anything in the Volcano Plot.
I can only zoom into the plot, but not mark any spots in either of the visualization panels
5/9/2006: Clustering
Comments on:
http://www.geworkbench.org/workbench/index.php/Tutorial_-_Clustering
I guess you know that the data set is not available for download ;-)
· Go to the Analysis component, and select Fast Hierarchical Clustering Analysis
I believe there should be somewhere something said about the algorithm used for fast hierarchical clustering. Not all parameters are self explanatory.
Should the check box called “enable zoom” or maybe “enable selection”? I think it might be kind of confusing this way.
And after this nice tutorial I am left with the question: And now what? Or, why did I do this, again?
5/10/2006:Basics
Comments on:
http://www.geworkbench.org/workbench/index.php/Tutorial_-_Basics
* The Data Management area can hold one workspace, and a workspace in turn can hold one or more projects. Projects can be used as wished {remove} to group different data sets. Each opened data file or analysis result is stored in a project [This is not really clear. Especially I would like to know something about the general concept of merging files vs. not merging files]. A workspace with all the data [what about the state of the data, especially what happened to like analyzing the data and its results?] it contains can be saved and returned to later.
o The GUI provides a menu bar at top with a standard choice of commands. Many commands that are available in the menu bar are also available by right-clicking on data objects. That is not entirely true. Usually you have an exit function under File, which is missing
In general I would like to see some more details on the Project/File concept as eluded on earlier. I think this is a good place to put this information and I haven’t seen it anywhere else
5/10/2006: Project and Data Files
Comments on:
http://www.geworkbench.org/workbench/index.php/Tutorial_-_Projects_and_Data_File
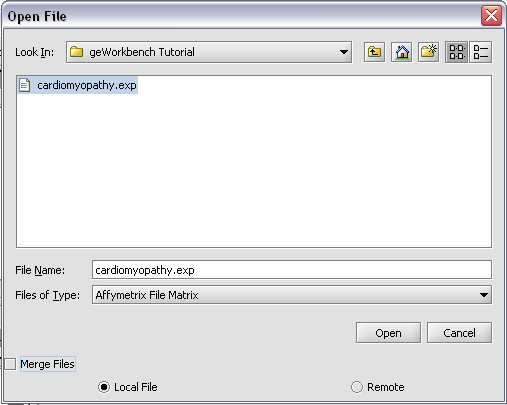
   * Affymetrix File Matrix - this is the native file type created by geWorkbench
     => I actually don’t know how to create this file from geWorkbench…
   * By the way you when we were talking about Matlab you said you only support free software: What about Affymetrix??? Are Genepix RMA Express free as well???
   * What are Pattern Files?
   * What are Genotypic data Files (should be files not Files, same for FASTA Files and Pattern Files and others)
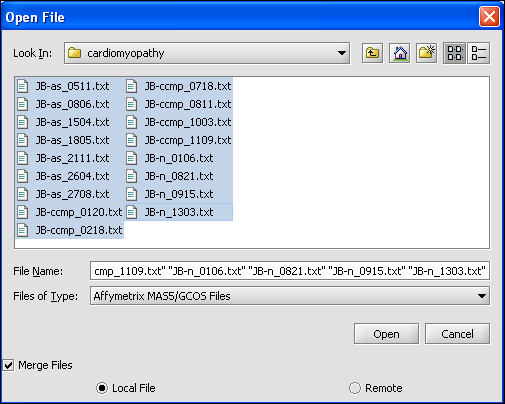
o We select the 10 MAS5 format text files from the directory geworkbench\data\training\cardiogenomics.med.harvard.edu, which is included in the geWorkbench download as shown in the picture below.
o I don’t get the message that you show
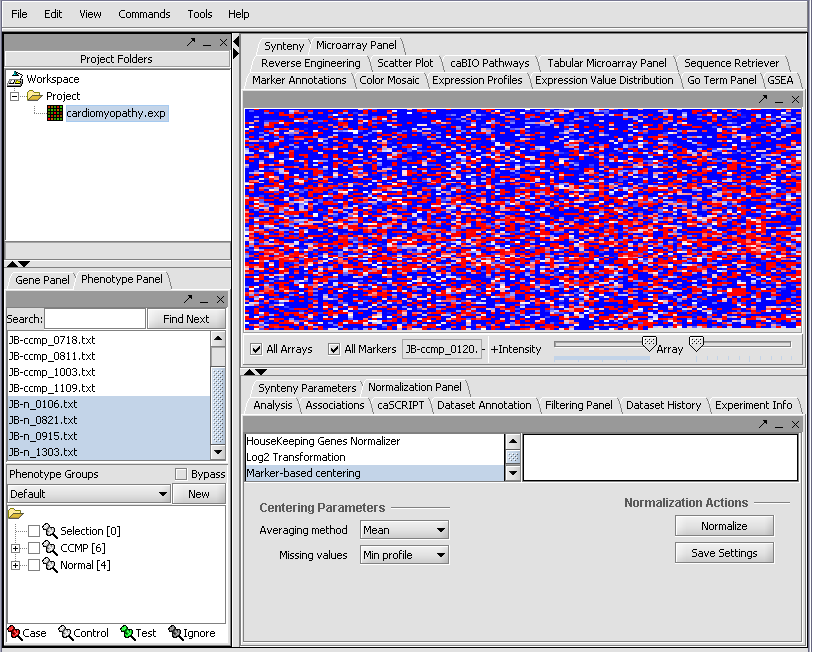
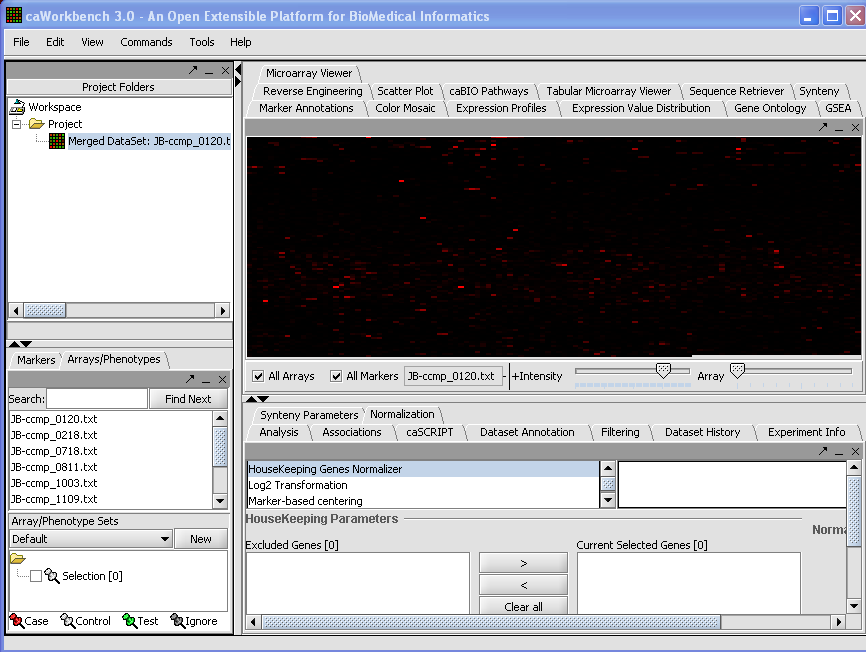
o The merged dataset is listed in the Project folder. The data is displayed, in single array format, in the Microarray Viewer. Note we have increased the intensity slider to maximum here. => Here you should mention that you only see the first/last array and that you can scroll through the arrays with the array slider
o There are no Okay buttons, but rather OK
o I mentioned this somewhere else already: When you want to delete/remove a bunch of data nodes you can select them, right click them, but only one file is then removed = BUG!
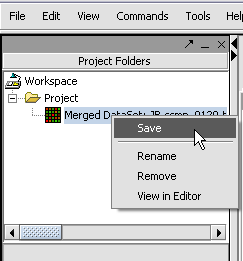
o Ah, now I see how you can save your special geWorkbench file. Maybe you should mention here that this is actually saving the data in this particular format. (At least I assume it does so)
o For the remote upload: The difference between Open and Go is not clear to me. Here is THE place for me where I am missing the mouse over help messages.
o The first image is not correct. For me it doesn’t show all the array experiments
o It is totally NON intuitive to have to right-click on a remote dataset to get additional information. It was at first not even obvious that there is additional data available…
o It is interesting that you chose this example, because it seems that only four or so of all the entries actually have derived assays. ;-)
o Maybe you want to explain what derived assays are?
o Also for the remote source, I would like to know what other sources are there and how the interface should look like. I have no clue what and why and how I should link other sources.
o Maybe this is another place to put some more information about merging files…
5/10/2006: Data subset
Comments on:
http://www.geworkbench.org/workbench/index.php/Tutorial_-_Data_Subsets
   * I would like to see a reference to the paper/web page where you took your example from. This way the interested reader can get some insights into the biological question…
   * I don’t think you the Activate/Deactivate functions under the right mouse click
5/10/2006: remote data
Are you sure that the remote data function is working correctly. I seam to have trouble loading some of the data…
5/10/2006: Viewing microarray dataset
Comments on
http://www.geworkbench.org/workbench/index.php/Tutorial_-_Viewing_a_Microarray_Dataset
   * in the visualization panel I don’t think the alignment of properties and corresponding names is ideal, but that is just optical
   * Why does it say “+ Intensity”?
   * Why is there a bluish bare underneath the slider of Intensity?
   * When removing object, maybe the delete button should do the same thing
   * The images created (right click, image snapshot) can be saved and exported (File-> export).
   * When analyzing sets of arrays, wouldn’t it be helpful to have a mean/median function over all spots at specific positions. This way systematic errors can be detected.
   * Expression Profiles: This is a line graph of gene[s] expression profiles across several arrays/ hybridizations. [space] Each marker is a separate color line.
   * Scatter Plot: A pairwise (array vs. array and marker vs. marker) comparison and plotting of expression values. [One array servers as the reference (x-axis serves, set by right-clicking and selecting x-axis, dark background) and subsequent arrays are plotted against this reference in different sub images. Up to six sub images can be created.]
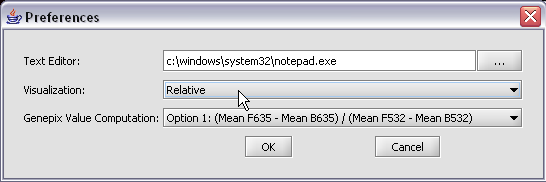
   * Genepix Value Computation: You can specify how to compute the value displayed for a Genepix array. The default setting is Option (Mean F635 - Mean B635) / (Mean F532 - Mean B532).
   * I don’t know anything about Genepix, but I assume that everyone playing around with geWorkbench and microarrays would know this, right?
   * Select Relative for the visualization preference. Note that this choice will not take effect until the next time you load a data set.
     => I would consider this as a bug!
Great page!
stuff cut out from other pages for possible later reuse:
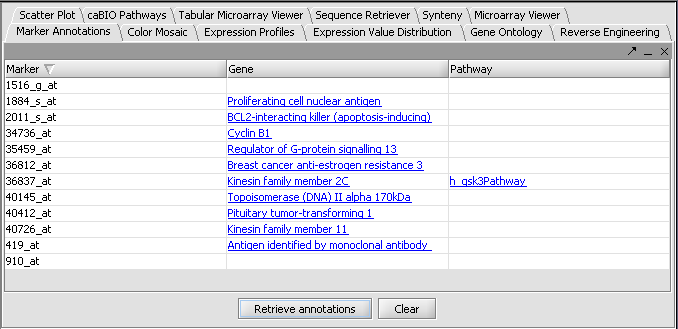
When working with microarrays, geWorkBench uses the term marker to refer to a gene probe (in other cases, it can be individual items from other data sets, such as sequences).
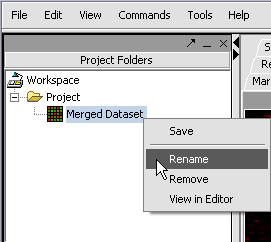
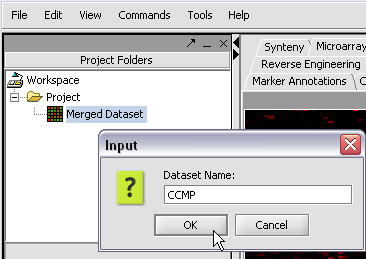
We can also rename the merged dataset by clicking on its entry in the Project Panel.
Here we will call it CCMP.
With the datasets merged, classified and named, we can save the dataset for future use. We will call it "cardiomyopathy.exp" (.exp is the default extension for the geWorkbench matrix file type).
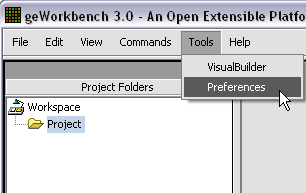
The default display of microarray data is an absolute display. We can change it to a relative display by selecting Tools:Preferences from the top menubar. We have removed the dataset so that we can read it back in using the new preferences.
Here we select the relative display type.
Returning to the Open File dialog as we before by right-clicking on the project entry, we will select the "cardiomyopathy.exp" file we previously saved...
Resulting in the following colorful display of the array data for the first array....
Your File Nodes will now be Merged into one Project folder.
