Tutorial - temp
ARACNe
ARACNe (Algorithm for the Reconstruction of Accurate Cellular Networks) is an information-theoretic algorithm used to identify transcriptional interactions between gene products using microarray expression profile data. The resulting network is displayed using the Cytoscape component. ARACNe can be used to predict potential functional associations among genes, or to predict novel functions for uncharacterized genes, by identifying statistical dependencies between genes. The results take the form of a matrix of candidate interactions, also called an adjacency matrix, which can be used for further network visualization and analysis.
ARACNe can perform two separate calculations:
- Mutual Information: The mutual information (MI) of one or more marker's expression profile(s) is calculated against all other active markers.
- Data Processing Inequality (DPI): The DPI calculation (triangle inequality) is used to remove the weakest interaction (edge) between any three markers. That is, if a MI value is available between each of three possible pairings of three markers, the weakest interaction of the three will be removed from the output. This has the intent of removing indirect interactions. For example, if A->B->C, the interaction A->C will likely be weaker than A->B or B->C and would be removed. A tolerance can be set which relaxes this screening to account for uncertainty in the MI calculation.
Parameters described below allow one to incorporate a list of putative transcription factors and optimize the run to discover targets that they may regulate.
Run ARACNe
- Load or select a microarray data set, or select an existing adjacency matrix in the project folders area of geWorkbench.
- In the analysis pane (lower right), select ARACNE analysis from the analysis list.
- Populate the parameters used for this analysis method (see below for details).
- Click on Analyze. If successful, the resulting adjacency matrix is added to the Project Folders component as a child of its parent dataset. The Dataset history captures the analysis parameters. The network will be depicted visually in the Cytoscape component.
Quick Example:
- Load the tutorial dataset Bcell-100.exp.
- Note - the parameter files calculated in the preprocessing step (see below) for this dataset are included with geWorkbench and will be used as needed by default.
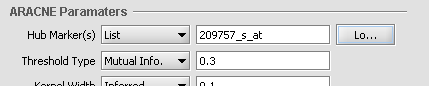
- Select the hub gene option "List" (version 1.6.3) or "From Sets" (version 1.7.0) and enter probe 1973_s_at.
- Other parameters left at default settings.
- Click "Analyze".
New Parameters in geWorkbench 1.7.0
geWorkbench 1.7.0 includes a new release of ARACNe, referred to as ARANCe2. ARACNe2 includes two important new parameters, Algorithm and Mode.
Algorithm
Two algorithms are now offered, Adaptive Partitioning and Fixed Bandwidth.
Adaptive Partitioning
Adaptive Partitioning was added with the incorporation of the ARACNe2 code into geWorkbench in version 1.7.0. Adaptive Partitioning is much faster than the Fixed Bandwidth method, and is also considered to produce superior results. Adaptive Partitioning is now the recommended algorithm for all purposes. Unlike the Fixed Bandwidth method, it does not used a fixed kernel-width when calculating the MI.
Fixed Bandwidth
Fixed Bandwidth was the only algorithm offered with geWorkbench 1.6.3 and earlier and is included for compatibility with previous versions. This method uses a kernel-width parameter for a Gaussian function used to calculate the MI.
Mode
Preprocessing
In this mode, runtime parameters are calculated, but no MI calculation is performed. Preprocessing for a given combination of dataset and algorithm need be run only once. The results are written to one or two files in the geWorkbench root directory. The names used for these files incorporate both the name of the dataset and the name of the algorithm, and thus are specific to the particular combination. Each time ARACNe is run in Discovery mode, it will look for the dataset-specific parameter files in its root directory. If the files are not found (Preprocessing has not been run), default parameter values will be used.
- Fixed Bandwidth (FBW) algorithm - two files are written to the geWorkbench root directory, one containing parameters for calculating the kernel width, and the other containing parameters for calculating a MI threshold from a specified P-value.
- Adaptive Partitioning (AP) algorithm - only the parameter file for calculating a MI threshold from a specified P-value is written. No kernel-width parameter is used.
Preprocessing files included with geWorkbench
Preprocessing as described above was run on the Bcell-100.exp dataset included with geWorkbench. The resulting ARACNe parameter files are also included in the geWorkbench root directory. They will be used by default when the Bcell-100.exp dataset is used in tutorials. Note that if you rerun the preprocessing step, the relevant file(s) will be overwritten.
The parameter files included in geWorkbench are:
- Bcell-100.exp_ARACNe_AP_threshold.txt - Adaptive Partitioning, Pvalue-to-MI threshold conversion parameters.
- Bcell-100.exp_ARACNe_FBW_kernel.txt - Fixed Bandwidth, kernel width calculation parameters.
- Bcell-100.exp_ARACNe_FBW_threshold.txt - Fixed Bandwidth, Pvalue-to-MI threshold conversion parameters.
Discovery
The ARACNe mutual information and the DPI (if selected) calculations are run. If dataset-specific parameter files are present, they will be used as needed (based on settings selected for Kernel Width and Threshold).
Complete
A preprocessing run will be performed followed immediately by a Discovery run. The dataset-specific parameter files created during the Preprocssing step will be used if needed (based on settings selected for Kernel Width and Threshold).
When is preprocessing not needed?
The preprocessing step can be time consuming. If you are for example using Adaptive Partioning, and decide you do not need to specify a p-value threshold for accepting edges, then you can just set a MI value as the threshold and proceed directly to Discovery mode. This will however make interpreting results more difficult.
If ARACNe does not find the dataset-specific parameter files it needs as described above, it will use by default parameters calculated from the B-cell dataset (see Margolin et al., 2006).
Specific Parameter settings
Version 1.6.3 and previous:

Version 1.7.0

Settings specific to version 1.7.0 and later
Hub Marker(s)
Specifies which gene markers will be treated as "hubs" in the ARACNE mutual information (MI) calculation. The mutual information is calculated for each specified hub marker against all other markers in the submitted dataset.
- All vs All - The MI of every pair of markers in the dataset is computed, that is, each is used as a hub.
- From Sets - allows a set of markers defined in the Markers component to be chosen from a pulldown menu. Alternatively, the user can type in the names of desired markers directly as a comma separated list.
- From File - allows a comma-separated list of markers to be read in from a file by clicking Load Markers..
Algorithm
Choose the algorithm used to calculate the pairwise mutual information values (see above for further details).
- Adaptive Partitioning (default) - should generally be used for all new calculations.
- Fixed Bandwidth - previous, slower algorithm using a fixed Gaussian kernel.
Mode
Used to control the calculation and use of runtime parameters from the input dataset (see above for further details).
- Preprocessing - calculates the required parameters and writes them to parameter files.
- Discovery - The ARACNe mutual information calculation is run. Uses pre-calculated parameter files as needed if they are present.
- Complete - Preprocessing and Discovery runs are combined into a single step.
Settings specific to version 1.6.3 and earlier
Hub Marker(s)
Specifies which gene markers will be treated as "hubs" in the ARACNE mutual information (MI) calculation. The mutual information is calculated for each specified hub marker against all other markers in the submitted dataset.
- All vs All - The MI of every pair of markers in the dataset is computed, that is, each is used as a hub.
- List - the hub marker(s) are taken from a user-entered list. A comma-separated list of marker IDs can be typed directly into the component, or the list can be loaded from a CSV file by clicking Load.

Other Parameters
The remaining parameters are the same in all versions (except as noted).
Threshold Type
This drop-down specifies the type of threshold to be used and can take the values “Mutual Info” or “P-value”. The actual value entered into the adjacent text area is always a number between 0 and 1.
Kernel width
The Kernel width is a scaling parameter used for fitting a Gaussian function to the data when running the FIXED_BANDWIDTH algorithm only, otherwise this field is disabled. If used, the value can be either inferred or specified directly.
- Inferred: If PREPROCESSING has been run on the dataset (mode is set to PREPROCESSING or COMPLETE), the kernel width is calculated directly from those results. If PREPROCESSING has not been run, the kernel width is inferred based on parameters fitted to a large B-cell dataset (Margolin et al, 2006), extrapolated for the number of samples in the dataset being tested.
- Specify: The user can enter a value for the kernel width directly, e.g. based on a prior calculation with this dataset.
DPI Tolerance
The Data Processing Inequality (triangle inequality)can be used to remove the effects of indirect interactions, e.g. if TF1->TF2->Target, DPI can be used to remove the indirect action of TF1 on the target. Stated another way, the DPI can be used to remove the weakest interaction of those between any three markers. The DPI tolerance specifies the degree of sampling error to be accepted, as with a finite sample size an exact value MI can not be calculated. The higher the tolerance specified, the fewer the edges that will be removed.
- Do Not Apply - Do not use the DPI.
- Apply - DPI is applied using the threshold value (between 0.0 and 1.0) specified in the adjacent text field. The higher the threshold, the weaker the screening and the more edges will be included in the final output.
DPI Target List
The DPI target list can be used to limit the ARACNE calculation to transcriptional networks. It is used to screen out spurious regulatory interaction signals of genes that are tightly co-expressed but are not in a regulatory relationship to each other, for example genes for two proteins that are in a physical complex and hence always produced in the same amounts. A comma-separated list can be typed in, or it can be loaded from an external file. If used, the DPI Target List should contain all markers that are annotated as transcription factors. Signaling proteins could also be included.
- Details: If the box is checked, the user selects and loads a file which specifies markers (which should be a list of one or more presumptive transcription factors) which will be given preferential treatment during the DPI edge-removal step. Edges originating from markers on this list will not be removed by edges originating from markers not on this list. However, for DPI calculations where all three markers are members of the list, the weakest connecting edge may still be removed.
Array and Marker Set Overrides
- All Markers: checking this box overrides any activated marker set in the Markers component.
- All Arrays: checking this box overrides any activated array set in the Arrays/Phenotypes component.
Bootstrapping
Bootstrap analysis can be used to generate a more reliable estimate of statistical significance for the interactions. Please see Margolin et al. 2006, Nature Protocols, Vol 1, No. 2, pg. 663-672 for further details (full reference below). Briefly, repeated runs of ARACNE are made, with arrays drawn at random from the full dataset with replacement. The same number of arrays is drawn each time as is present in the original dataset. A permutation test is then used to obtain a null distribution, against which the statistical significance of support for each network edge connection (interaction) can be measured.
- Bootstrap number: Specifies the number of bootstrapping runs to perform.
- Consensus threshold (for bootstrapping only): After the bootstrapping runs are made, a permutation test is used to estimate the significance of interactions. The consensus threshold sets the cutoff point for calling the interactions significant and returning them in the final adjancency matrix
ARACNe Example
1. (optional but recommended) - Obtain the latest HG-U95Av2 annotation file from the Affymetrix NetAffx website (http://www.affymetrix.com/analysis/index.affx). As of this writing, the latest version is "HG_U95Av2.na28.annot.csv".
2. If you have not already done so, go to the Component Configuration Manager and load the ARACNe analysis. This will also load the Cytoscape Viewer.
3. Load the data file Bcell-100.exp as type "Affymetrix File Matrix". When asked for an annotation file, navigate to and select the file you obtained above - e.g. "HG_U95Av2.na28.annot.csv".
4. In the Marker Sets component, load the file "70_TFs_from_HG-U95Av2.na28.csv". This file is included in the geWorkbench tutorial data.

5. In the geWorkbench commands area, select the "ARACNe" analysis.
6. Set up the ARACNe parameters as shown
- Hub Markers: From Sets - Choose the set of 70 loaded above "70_TFs_from_HG-U95Av2.na28".
- Threshold: Mutual Info - Set value of 0.5.
- Algorithm: Adaptive Partitioning.
- Mode: Discovery
- DPI Tolerance: Do Not Apply

7. Press the "Analyze" button to launch the job. On a current generation desktop machine expect this example to run for several minutes.
8. When the calculation is finished, the result is returned as an "adjacency matrix" - that is, a list of nodes which have above-threshold MI values - and placed into the Project Folders component.
9. The adjacency matrix will be visualized automatically in the Cytoscape component, as shown below.

There is now 2-way interaction available between Cytoscape and geWorkbench.
- Nodes selected in Cytoscape appear in the Marker Sets component in the set "Cytoscape selection".
- In addition, any set of markers in the Marker Sets component can be projected onto the Cytoscape display, where they will appear highlighted.
This interaction is demonstrated further on the Cytoscape tutorial page.
References
Margolin, A., Wang, K., Lim, W.K., Kustagi, M., Nemenman, I., and Califano, A. Reverse Engineering Cellular Networks. Nature Protocols (2006), Vol 1, No. 2, pgs. 663-672
