User:Daly
Contents
- 1 Overview
- 2 Tutorials
- 2.1 Getting Started
- 2.2 Loading Data
- 2.3 Working with Marker and Phenotype Panels
- 2.4 Visualize Gene Expression
- 2.5 Filter and Normalize Data
- 2.6 Clustering Gene Expression Data
- 2.7 Differential Expression
- 2.8 Regulatory Network
- 2.9 Integrated Annotation Information
- 2.10 Enrichment Analysis
- 2.11 Sequence Analysis
- 2.12 Pattern Discovery
- 2.13 Promoter Analysis
Overview
'(who uses this , why/ what for? background )
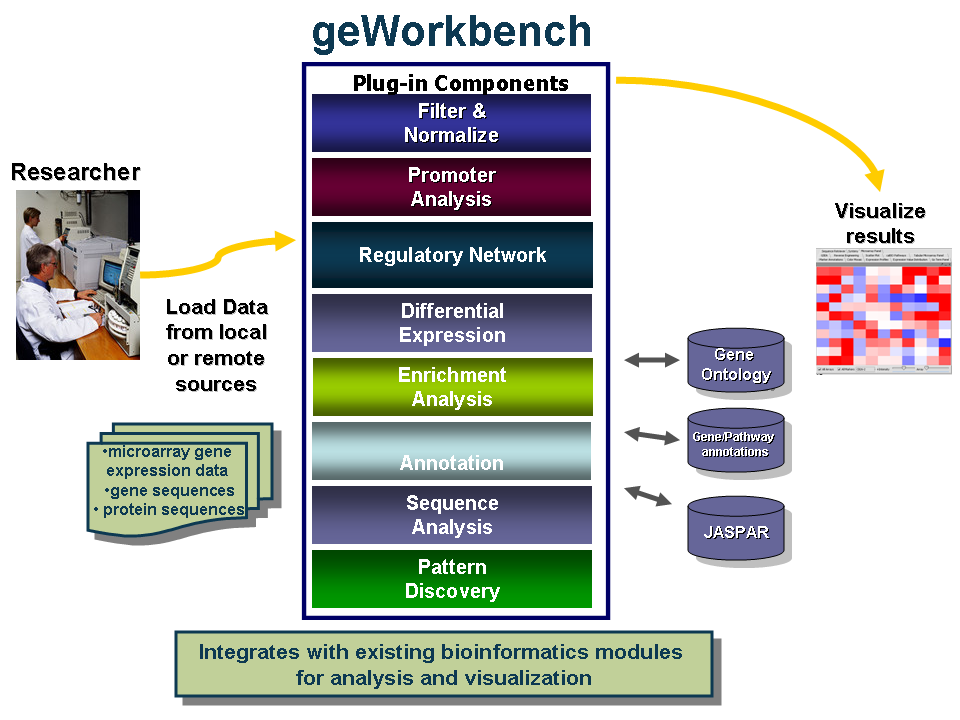
geWorkbench is an open-source bioinformatics platform that offers a comprehensive and extendible collection of tools for the management, analysis, visualization and annotation of biomedical data.
Benefits include:
- Integrates with existing bioinformatics modules for analysis and visualization.
- Support for a variety of genomic data including microarrays, sequences, pathways, networks, alignments and phenotypes.
- Access to remote servers and clusters for the performance of computationally intensive calculations.
- Integration of analyses with biological annotations from the National Cancer Institute.
- Flexible import options: allows user to merge files from various sources.
- Community: decribe this aspect
- developer benefit
Intro graphic
Tutorials
The following { insert description)
Getting Started
- Starting the application
- GUI elements
- Panels
- Navigation
Loading Data
- Data formats
Working with Marker and Phenotype Panels
- Creating panels
- Visualizing
Visualize Gene Expression
Filter and Normalize Data
Clustering Gene Expression Data
- Hierarchical Clustering
- Self Organizing Map (SOM)
Differential Expression
- T Test
- Multi Test
- Volcano Plot
- Color Mosaic
Regulatory Network
- Reverse Engineering
- Cytoscape
Integrated Annotation Information
Enrichment Analysis
- Go Term
- Go Miner
Sequence Analysis
- Sequence Retrieval
- Sequence Homology Analysis
- Blast
- Other
Pattern Discovery
- Position Histogram

