Difference between revisions of "Cytoscape Network Viewer"
(→Selecting nodes in Cytoscape) |
|||
| Line 34: | Line 34: | ||
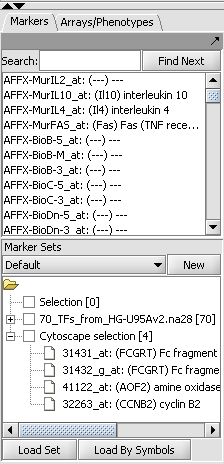
| − | The result from selecting the three nodes above is transferred to the Cytoscape selection set in the Markers component. Note that four | + | The result from selecting the three nodes above is transferred to the Cytoscape selection set in the Markers component. Note that four probesets are hit by the three genes selected, as a gene may be represented by multiple probesets. |
| + | |||
[[Image:T_Cytoscape_selected_set.png]] | [[Image:T_Cytoscape_selected_set.png]] | ||
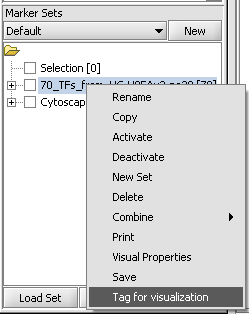
| + | The diagram below illustrates projecting a set defined in the Markers component back onto the Cytoscape network diagram. In this case, the set of transcription factors originally used in the ARACNe run is labeled with "tag for visualization" by right-clicking on it and selecting this menu option. | ||
[[Image:T_Cytoscape_tag_for_vis.png]] | [[Image:T_Cytoscape_tag_for_vis.png]] | ||
Revision as of 11:53, 14 July 2009
Overview
Cytoscape (www.cytoscape.org) is a sophisticated network and pathway visualization tool that has been incorporated into geWorkbench as a component. Within geWorkbench, Cytoscape is used to depict putative interaction networks, for example as created from running ARACNe or a Cellular Network Knowledgebase query. Both of these tools return "adjacency matrices", that is, interaction networks, to the Project folders component. Currently, Cytoscape version 2.4.7 used in geWorkbench.
Cytoscape has been integrated into geWorkbench in such a way that it can communicate in both directions with the Markers component.
- Nodes in a Cytoscape network can be selected indivudually or by drawing a selection box around them. This will result in the selected nodes being placed into the "Cytoscape selection" set in the Markers component.
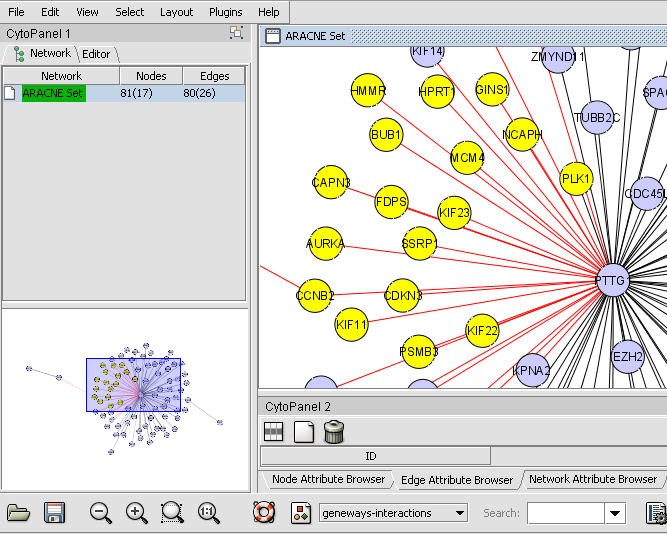
- A set of markers in the Markers component can be labeled with the "tag for visualization" property, which will project that set onto the network depicted in Cytoscape. Those markers in the intersection of the tagged set and the network display will be hightlighted in yellow.
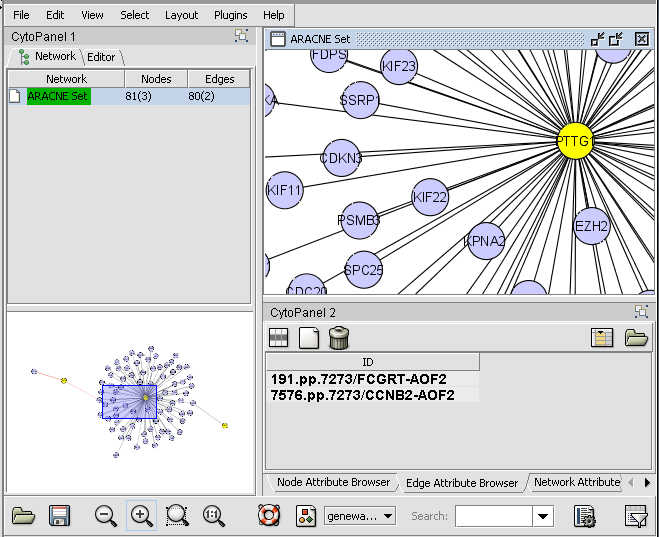
The use of Cytoscape and its interactions with geWorkbench are described in the following sections. First we will describe the layout of the Cytoscape graphical interface. The network diagram depicted was calculated using ARACNe in the ARACNe tutorial.
Layout of the Cytoscape component
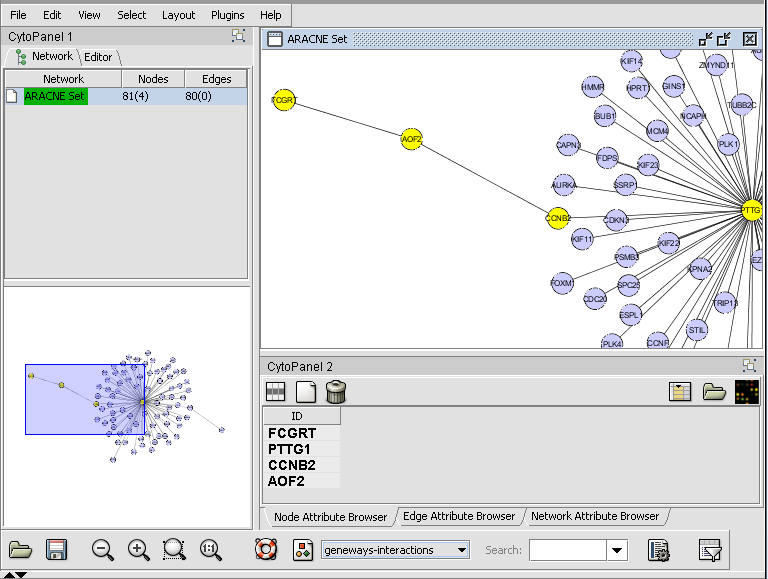
The Cytoscape component has 4 main areas:
- At upper left is a list of networks that have been loaded into Cytoscape, showing the network name, and the number of nodes and edges. in addition, the numbers in parantheses show the numbers of nodes and edges which have been highlighted (selected) in the network depiction.
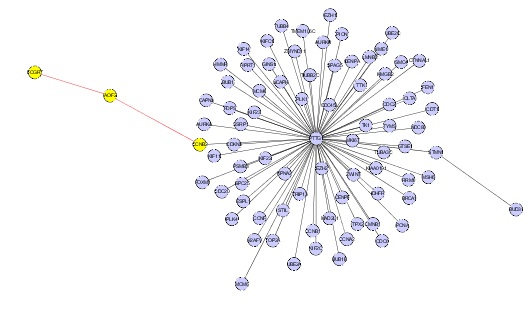
- At upper right is the main network depiction pane. Gene or protein symbols/names will be depicted if available. However, if for examle an Affymetrix microarray dataset was read in but no annotation file was associated with it, then only probeset names would appear. Nodes which have been selected are depicted in yellow and are returned to the "Cytoscape selection" set in the Markers component. Edges which have been selected are depicted in red.
- At lower left is a navigation tool, which shows the entire network and a representation (purple rectangle) of where the viewing pane described above is situated. The purple viewing pane can be moved by using the mouse to visualize different parts of the network as desired. This is done by left-clicking with the mouse in the purple rectangle and moving it.
- At lower right is a list of selected nodes.
Selecting nodes in Cytoscape
- Individual nodes and/or edges can be selected in Cytoscape by clicking on them with the mouse.
- To select multiple nodes or edges, hold down the Shift key while making the selection.
- Alternatively, a selection box can be drawn around both nodes and edges by left-clicking in the network diagram and selecting the desired targets.
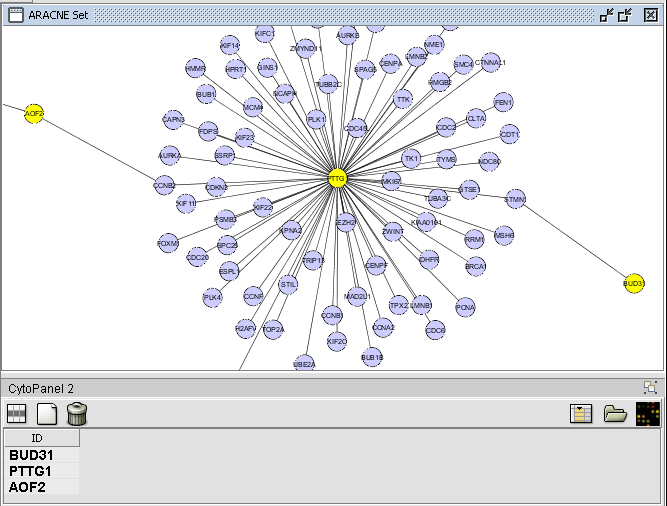
The figure below shows three nodes selected.
The result from selecting the three nodes above is transferred to the Cytoscape selection set in the Markers component. Note that four probesets are hit by the three genes selected, as a gene may be represented by multiple probesets.
The diagram below illustrates projecting a set defined in the Markers component back onto the Cytoscape network diagram. In this case, the set of transcription factors originally used in the ARACNe run is labeled with "tag for visualization" by right-clicking on it and selecting this menu option.
