Difference between revisions of "Overview"
(→Introduction) |
|||
| Line 1: | Line 1: | ||
==Introduction== | ==Introduction== | ||
| − | geWorkbench is an open-source bioinformatics platform that offers a comprehensive and extensible collection of tools for the management, analysis, visualization and annotation of biomedical data. Many kinds of analysis are supported - for microarrays, there are filtering and normalization, basic statistical analyses, clustering, network reverse engineering, as well as many common visualization tools. For sequence data there are routines such as BLAST, pattern detection, transcription factor mapping, and syntenic region | + | geWorkbench is an open-source bioinformatics platform that offers a comprehensive and extensible collection of tools for the management, analysis, visualization and annotation of biomedical data. Many kinds of analysis are supported - for microarrays, there are filtering and normalization, basic statistical analyses, clustering, network reverse engineering, as well as many common visualization tools. For sequence data there are routines such as BLAST, pattern detection, transcription factor mapping, and syntenic region analysis. Furthermore, genomic sequences around markers of interest found in microarray experiments can be easily retrieved and, for example, used for promoter/transcription factor analysis. |
Specific types of data supported include: | Specific types of data supported include: | ||
| Line 22: | Line 22: | ||
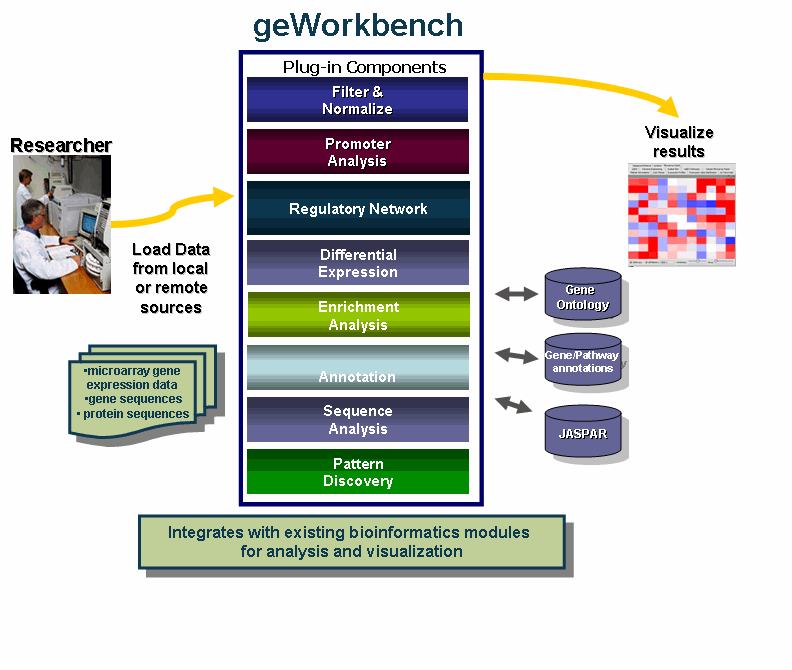
[[Image:slide1.gif]] | [[Image:slide1.gif]] | ||
| − | |||
==Developing for geWorkbench== | ==Developing for geWorkbench== | ||
Revision as of 13:26, 23 March 2006
Contents
Introduction
geWorkbench is an open-source bioinformatics platform that offers a comprehensive and extensible collection of tools for the management, analysis, visualization and annotation of biomedical data. Many kinds of analysis are supported - for microarrays, there are filtering and normalization, basic statistical analyses, clustering, network reverse engineering, as well as many common visualization tools. For sequence data there are routines such as BLAST, pattern detection, transcription factor mapping, and syntenic region analysis. Furthermore, genomic sequences around markers of interest found in microarray experiments can be easily retrieved and, for example, used for promoter/transcription factor analysis.
Specific types of data supported include:
- Microarray Gene Expression
- Affymetrix GCOS/MAS5
- Matrix format (geWorkbench)
- RMAExpress
- GenePix
- DNA and Protein Sequences
- FASTA
- Pathways
- BioCarta
- Patterns
- Regular Expressions
- Gene Ontology
- Networks
Most importantly, geWorkbench provides an environment which supports moving from one data type to another in a seamless fashion, e.g. from gene expression to sequences to patterns.
Developing for geWorkbench
geWorkbench has been designed using a plug-in framework which allows new modules to be developed with relative ease. A repository will be maintained for community-developed modules. Developers can take advantage of all the existing capabilities for data management and visualization, and thus concentrate development efforts on the more important, novel aspects of their project.
geWorkbench as an interface to external data and computational resources
geWorkbench provides access to a variety of external data sources, including:
- Microarray gene expression repositories (caArray)
- Gene annotation pages (via CGAP)
- DNA sequence retrieval
- Pathway diagrams (BioCarta)
geWorkbench also provides a gateway to several computational services currently hosted on Columbia servers and clusters, including:
- BLAST
- Pattern Discovery
- Synteny
Basic Layout of the Graphical User Interface
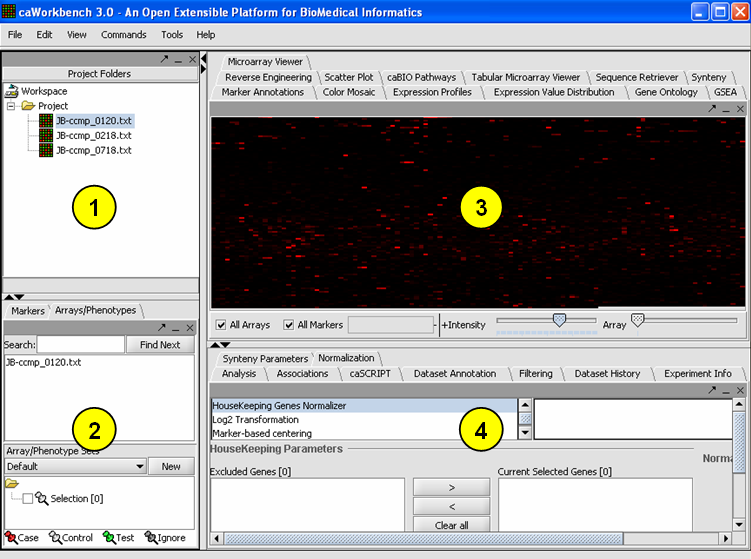
The graphical user interface for geWorkbench is divided into four major sections, for
1. Projects - Data management (upper left)
2. Marker and Array/Phenotype set selection and management (lower left)
3. Visualization tools (upper right)
4. Analytical tools (lower right)
The Data Management area can hold one workspace, and a workspace in turn can hold one or more projects. Projects can be used as wished to group different data sets. Each opened data file or analysis result is stored in a project. A workspace and all the data it contains can be saved and returned to later.
The GUI provides a menu bar at top with a standard choice of commands. Many commands that are available in the menu bar are also available by right-clicking on data objects.


