Difference between revisions of "PCA"
m (→Results Viewer) |
(→Results Viewer) |
||
| Line 41: | Line 41: | ||
A plot can be produced by selecting two or three components in the list and pushing the "Plot" button. | A plot can be produced by selecting two or three components in the list and pushing the "Plot" button. | ||
| − | Selecting two components will produce a 2-D graph, while selecting 3 components will produce a 3-D graph. | + | Selecting two components will produce a 2-D graph, |
| + | |||
| + | |||
| + | |||
| + | [[Image:PCA_Projection_2D.png]] | ||
| + | |||
| + | |||
| + | while selecting 3 components will produce a 3-D graph. | ||
The 3-D graph can be rotated by grabbing any data point by left-clicking on it and dragging it with the mouse. | The 3-D graph can be rotated by grabbing any data point by left-clicking on it and dragging it with the mouse. | ||
Revision as of 18:17, 26 November 2013
Contents
Principle Component Analysis (PCA)
Principle component analysis is used to find the most important contributors to the variance in a dataset.
geWorkbench can dispatch a PCA job to a GenePattern server, and display the returned result.
The analysis can be done either in terms of experiments (arrays) or genes. The result will be the most important features of the experiments or genes in explaining the data.
Parameters
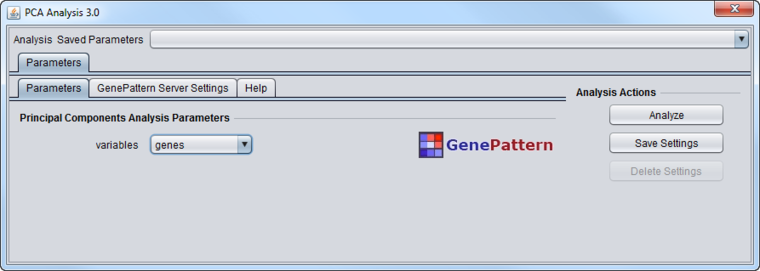
The PCA component analysis interface is shown below.
Variables
- Genes - analyze the principle components in terms of genes. Each component will be composed from the weighted contributions of each gene.
- Experiments - analyze the principle components in terms of experiments. Each component will be composed from the weighted contributions of each experiment.
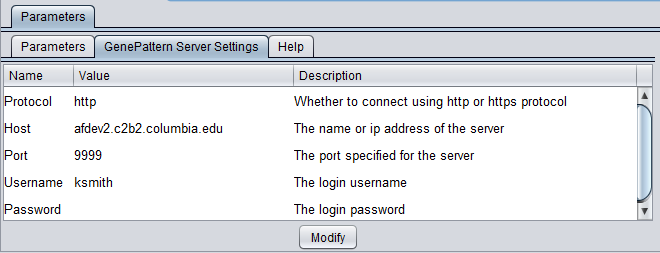
GenePattern Server Settings
- Protocol - http
- Host - enter the URL of an available GenePattern server.
- Port - Enter the port number of the GenePattern server you are using.
- Username - enter a GenePattern username
- Password - the GenePattern password for username, if required.
Results Viewer
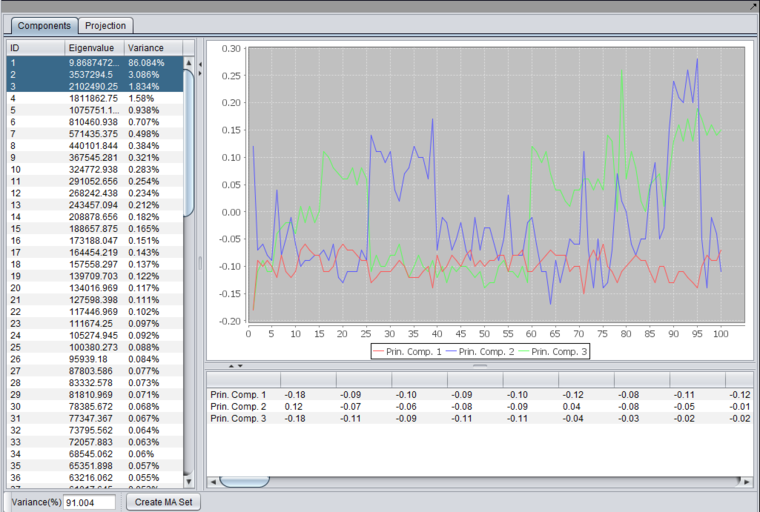
After running an analysis, any number of components can be graphed as to the weight of the contribution from each original variable by highlighting the desired components. Each principle component is shown as a line with a different color. In the table below the graph, the individual weights defining each principle component are shown.
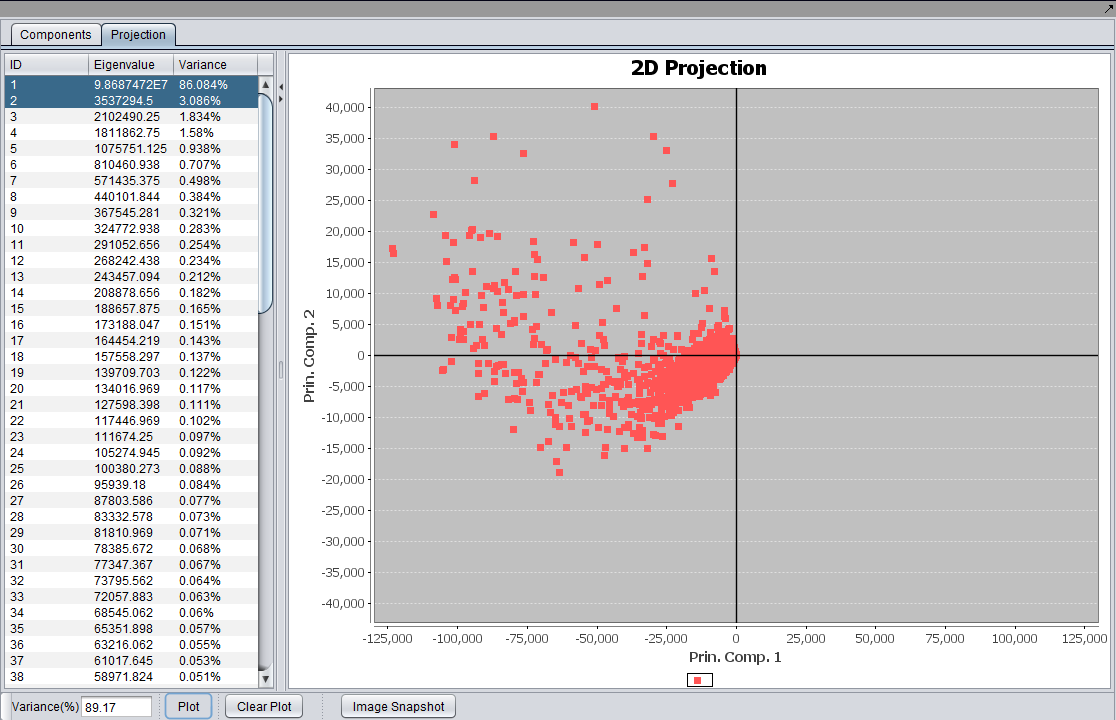
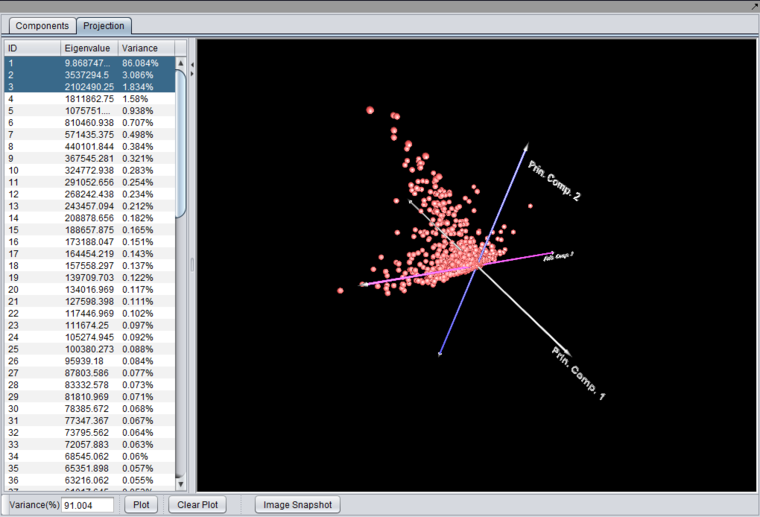
A plot can be produced by selecting two or three components in the list and pushing the "Plot" button.
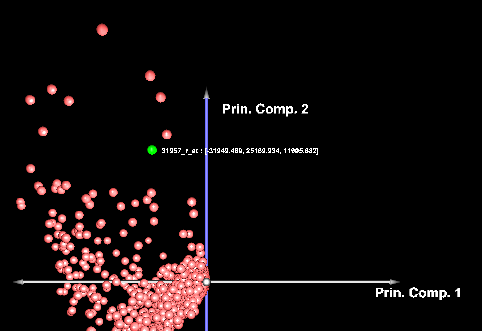
Selecting two components will produce a 2-D graph,
while selecting 3 components will produce a 3-D graph.
The 3-D graph can be rotated by grabbing any data point by left-clicking on it and dragging it with the mouse.
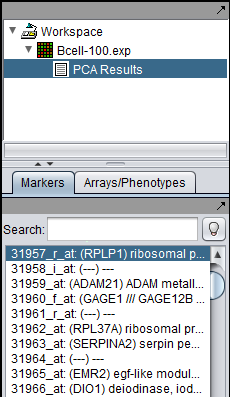
Left-clicking on a data point will also cause it to be highlighted in the Markers component.
Below, the PCA result node is shown in the Workspace, along with a highlighted gene.
