PCA
Contents
Principle Component Analysis (PCA)
Principle Component Analysis (Raychaudhuri et al., 2000) is used to find the most important contributors to the variance in a dataset.
geWorkbench can dispatch a PCA job to a GenePattern server, and display the returned result.
The analysis can be done either in terms of experiments (arrays) or genes. The result will be the most important features of the experiments or genes in explaining the data.
Note - due to memory limitations, analysis on a full set of genes may not be possible. Instead, you may need to filter the dataset or define a Marker Set with a relevant subset of genes.
For further information on the GenePattern implementation of PCA, please see the GenePattern documentation at GenePattern Analysis:Modules.
Requirements
The PCA 3D visualization does not currently work when using 64-bit Java, which is now the default on all platforms. It will work if a 32-bit version of Java is used to run geWorkbench (not available for Mac OS X).
The PCA 3D viewer requires that the computer display driver support OpenGL version 1.2 or higher. If it does not, a warning message will be displayed at the time the user attempts to create a 3D plot. Any recent graphics card should provide this support.
Parameters
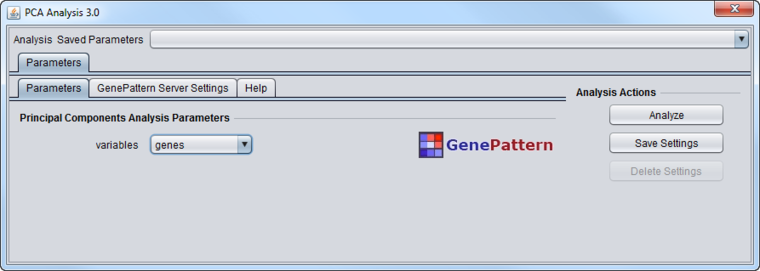
The PCA component analysis interface is shown below.
Variables
- Genes - analyze the principle components in terms of genes. Each component will be composed from the weighted contributions of each gene. Available memory will limit how many genes can be successfully analyzed.
- Experiments - analyze the principle components in terms of experiments. Each component will be composed from the weighted contributions of each experiment.
Special behavior for activated Marker and Array Sets
The PCA component defines a special behavior with respect to activated Marker or Array sets.
If the analysis variable is "experiments", then activated array sets will be respected, but activated marker sets will be ignored - all markers will be used.
If the analysis variable is "genes", the activated marker sets will be respected, but activated array sets will be ignored - all arrays will be used.
GenePattern Server Settings
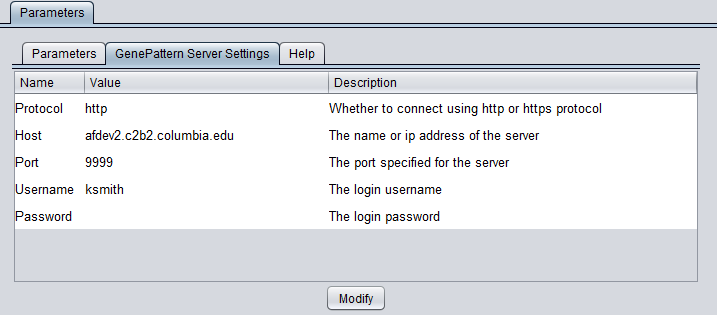
You can connect to any running GenePattern server to run the analysis (provided it has the required module installed). An example configuration of the "GenePattern Server Settings" tab is shown here:
To run GenePattern components, a GenePattern account is required.
Pushing "Modify" brings up an editing box where any of the settings can be changed.
- Protocol - HTTP or HTTPS, depending on the server being used.
- Host - URL of a GenePattern server.
- Port - Port at which the GenePattern server is located on the Host machine.
- Username - A valid user name on the specified GenePattern server.
- Password - A password, if required by the specified server.
Results Viewer
Components tab
Principle Components List
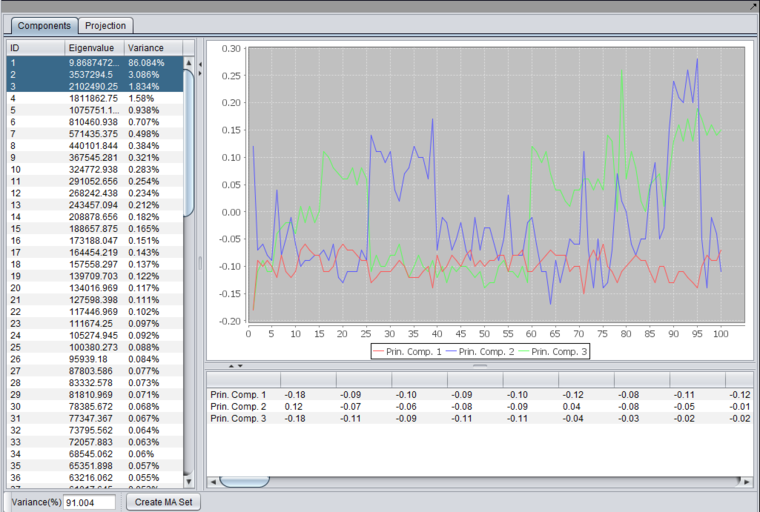
- Listing - The list at the left of the component shows each principle component, along with its Eigenvalue, and the percentage of the variance that each component explains. Individual components can be selected for plotting.
- Variance(%) - below the list, a text box displays the total variance for principle components that have been selected in the list.
Graphs and Tabular View
After running an analysis, any number of components can be graphed as to the weight of the contribution from each original variable by highlighting the desired components. Each principle component is shown as a line with a different color. In the table below the graph, the individual weights defining each principle component are shown.
The data displayed in the table can be copied to a new top-level dataset in the Workspace by pushing the "Create MA Set" button.
Right-Click Menu
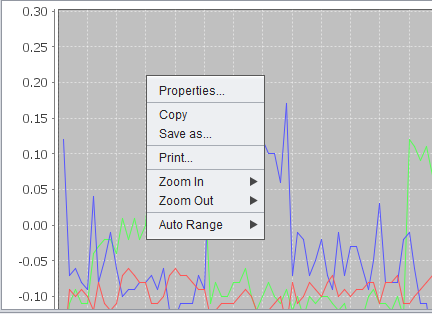
Right-clicking on the 2D graph produces a menu with several options.
- Properties - Set title, plot and other properties.
- Copy - Copy the graph image to the clipboard (e.g. to paste into another document)
- Save As - Save the graph as a PNG image file.
- Print - Print the graph image.
- Zoom In - Options are Both Axes, Domain Axis, and Range Axis
- Zoom Out - Options are Both Axes, Domain Axis, and Range Axis
- Autorange - Automatically set the range. Options are Both Axes, Domain Axis, and Range Axis
Create MA Set
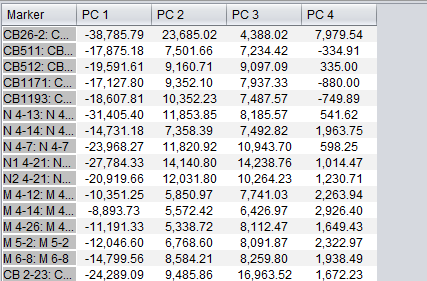
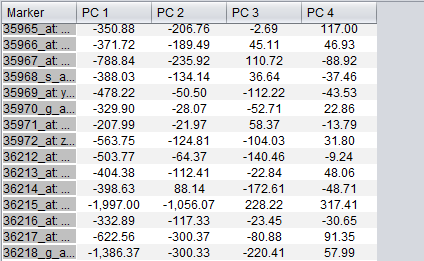
This button will copy the principal components being displayed in the tabular view to a new data matrix, which is then placed in the Workspace as a new, top-level "microarray set" (hence "Create MA Set"). Here, the matrix of principle components can be further displayed and analyzed, for example using the Tabuluar Microarray Viewer, the Scatter Plot, or other appropriate components.
If the initial analysis variable was "genes", the items displayed e.g. in the Tabular Microarray Viewer will be the experiments, that is, microarrays. Their names will appear in the Tabular Microarray Viewer column labeled "Markers", as this labeling is currently fixed.
If the initial analysis variable was "experiments", the items displayed e.g. in the Tabular Microarray Viewer will be the markers (genes). Their names will appear in the Tabular Microarray Viewer column labeled "Markers".
Projection tab
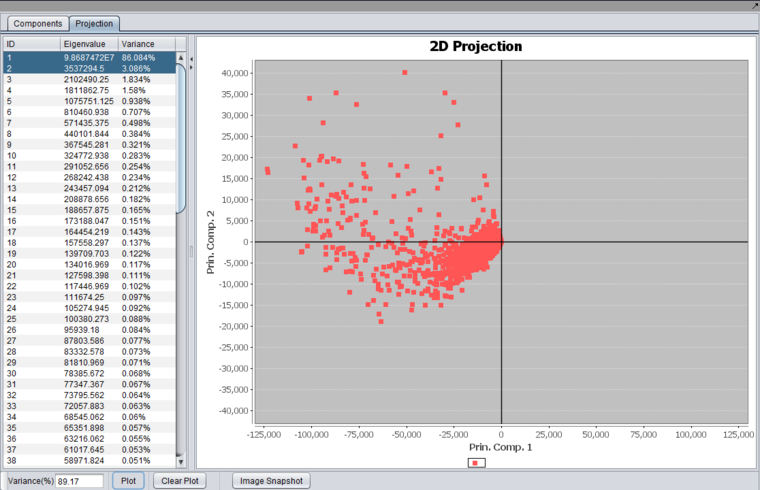
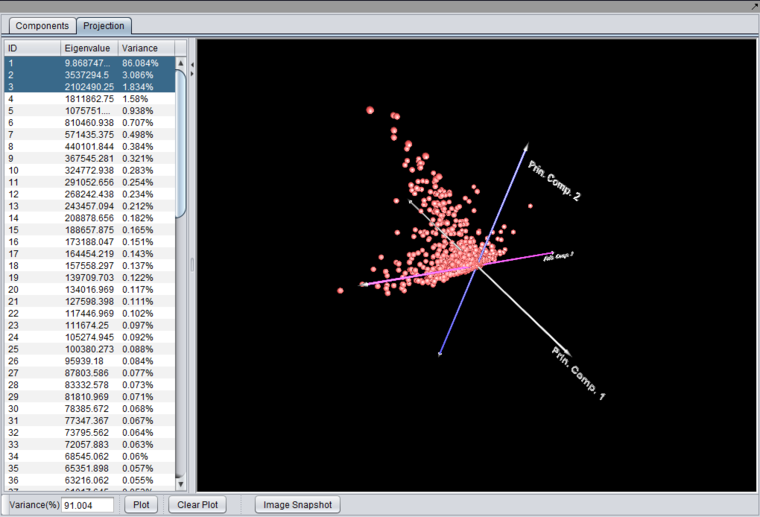
In the Projection tab, a plot can be produced by selecting two or three components in the list and pushing the "Plot" button.
Set intersection display
For either the 2D or 3D projections, activated marker or array sets can be used to focus on specific data points. These sets are in addition to any that might have been used in the initial analysis.
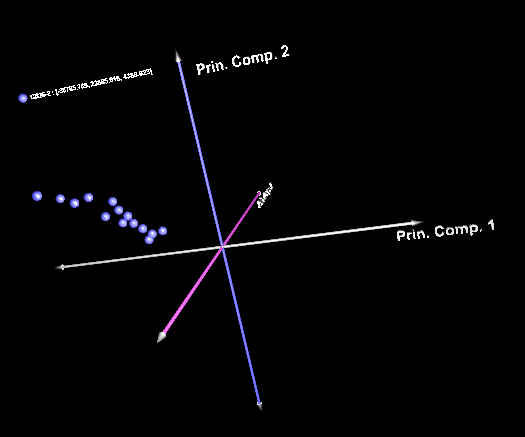
If a marker or array set (depending on whether markers or arrays are displayed in the plot) is activated (in the Markers or Arrays components, respectively), only the intersection of that set and the analysis result will be displayed.
For example, if the analysis was in terms of experiments, then the plotted data represents markers (genes), and can be limited by activating a marker set. Only those markers that are both in the analysis result, and are in the activated set, will then be displayed.
Common Controls
- Variance (%) - shows the total variance accounted for by all currently selected components.
- Plot - Draw a plot for the selected components (2 or 3).
- Clear Plot - Erase the current plot.
- Image Snapshot - save a snapshot of the projection to the Workspace.
2D Projection
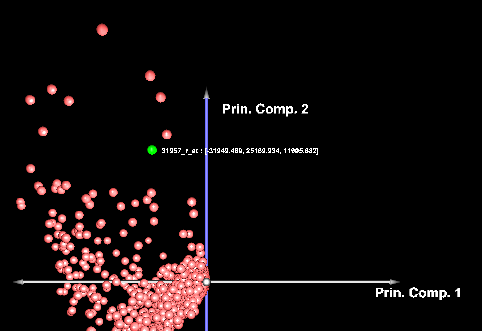
Selecting two components and pushing "Plot" will produce a 2-D graph,
3D Projection
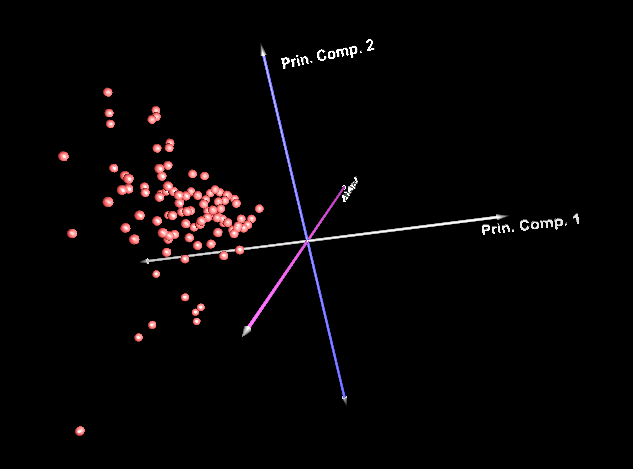
Selecting 3 components and pushing "Plot" will produce a 3-D graph.
The 3-D graph can be rotated by grabbing any data point by left-clicking on it and dragging it with the mouse.
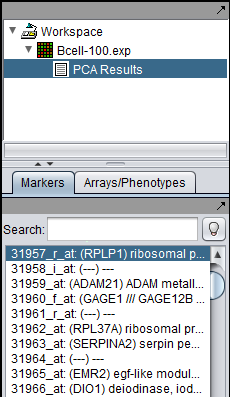
Left-clicking on a data point will also cause it to be highlighted in the Markers component.
Below, the PCA result node is shown in the Workspace, along with a highlighted gene.
Below is a 3D projection of arrays (the analysis variable was genes)
and now with an array set activated, showing only the intersection:
References - GenePattern
- Reich M, Liefeld T, Gould J, Lerner J, Tamayo P, Mesirov JP (2006) GenePattern 2.0 Nature Genetics 38 no. 5 (2006): pp500-501 doi:10.1038/ng0506-500. (PubMed 16642009)
- GenePattern website.
- GenePattern modules documentation.
References - PCA
- Raychaudhuri S, Stuart JM, and Altman RB. (2000) Principal components analysis to summarize microarray experiments: application to sporulation time series. Pac. Symp. Biocomput. 455-466. PubMed ID 10902193.
