File list
This special page shows all uploaded files.
| Date | Name | Thumbnail | Size | Description | Versions |
|---|---|---|---|---|---|
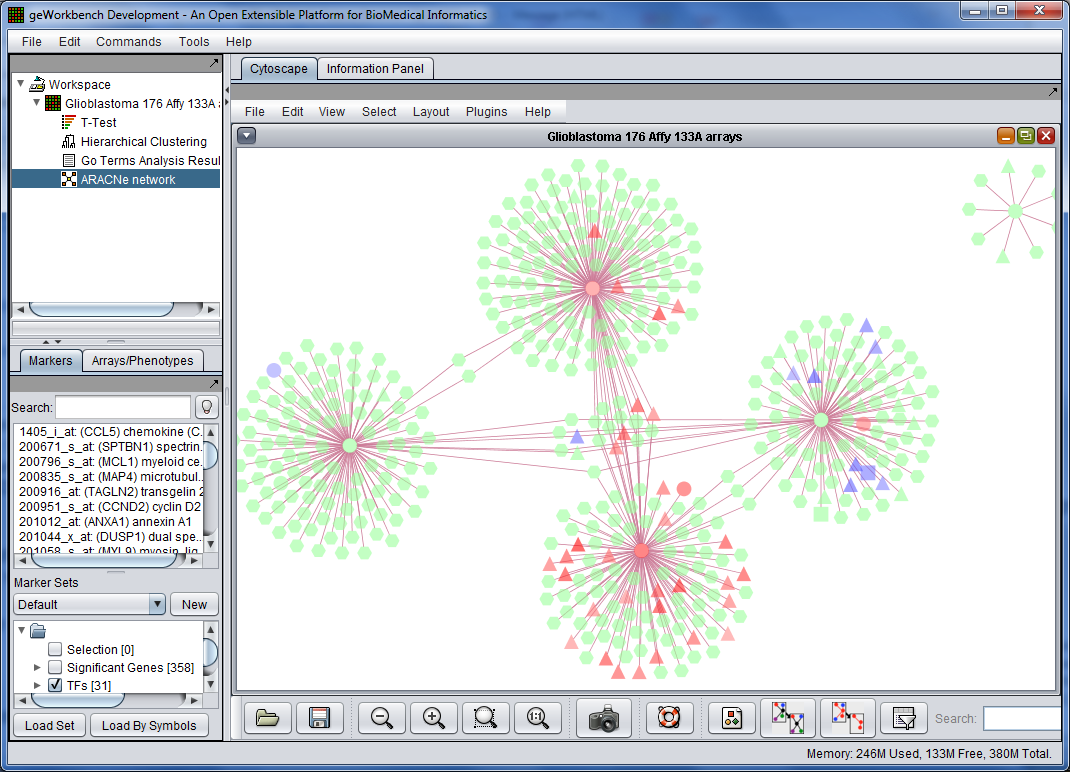
| 20:42, 14 July 2013 | ARACNe with t-test home gallery.PNG (file) |  |
278 KB | Regulatory network reconstructed using the ARACNe algorithm. Nodes represent genes and edges represent ARACNe-predicted interactions between transcription factors and their putative targets. The results of a prior differential expression analysis have bee | 1 |
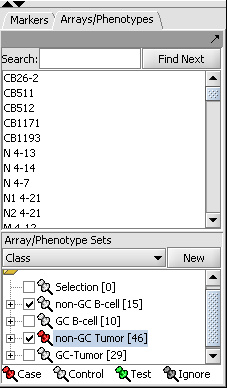
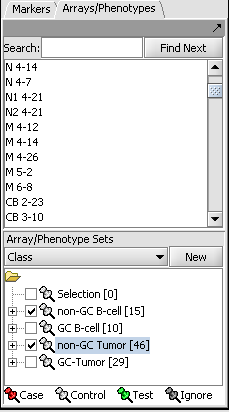
| 22:30, 19 October 2009 | Array set class assignment (MRA).png (file) | .png) |
7 KB | 1 | |
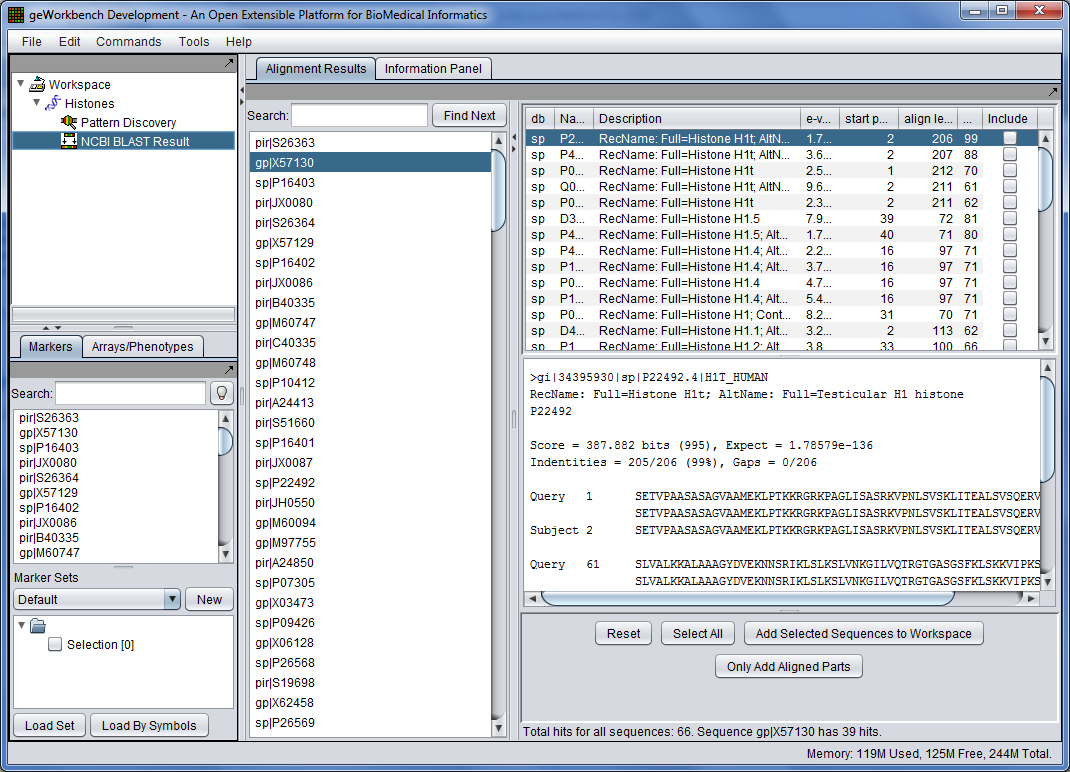
| 14:05, 15 July 2013 | BLAST home gallery.PNG (file) |  |
145 KB | Results of running a BLAST sequence homology query. | 1 |
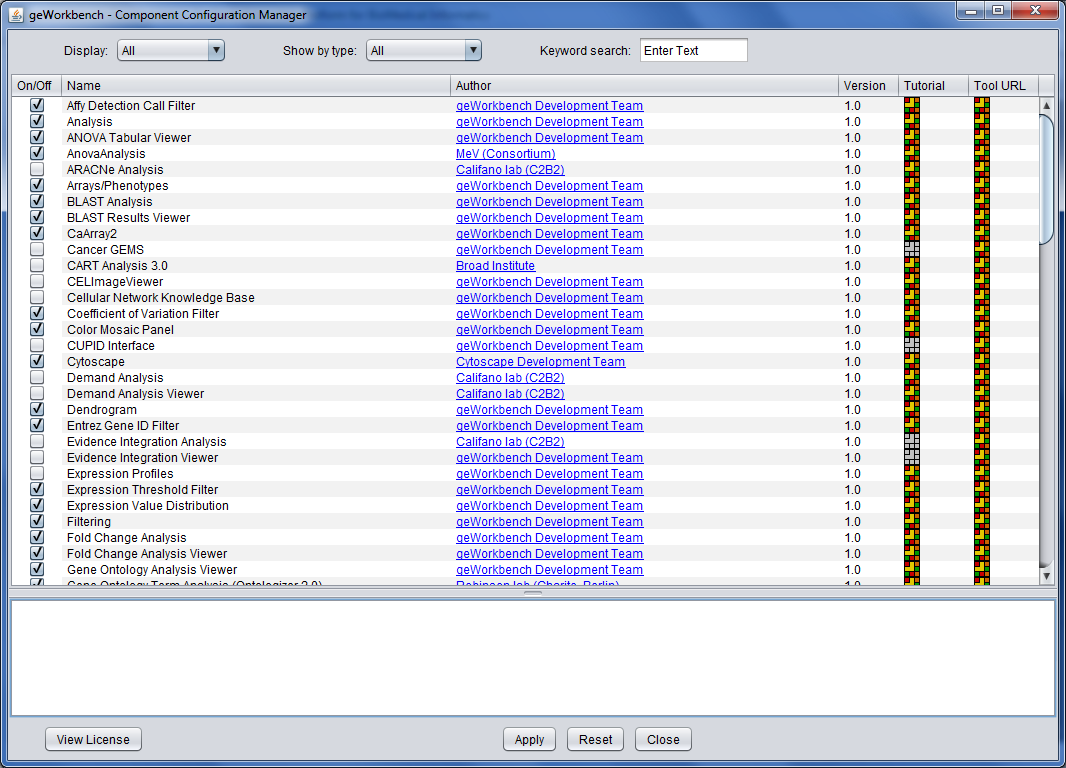
| 14:07, 15 July 2013 | CCM home gallery.PNG (file) |  |
132 KB | The Component Configuration Manager allows enabling/disabling plugins. It allows configuring geWorkbench to include only components needed by the user. | 1 |
| 23:58, 11 August 2009 | CGI all retrieved.png (file) |  |
17 KB | 1 | |
| 13:40, 4 March 2022 | Columbia Logo.jpg (file) | 6 KB | 1 | ||
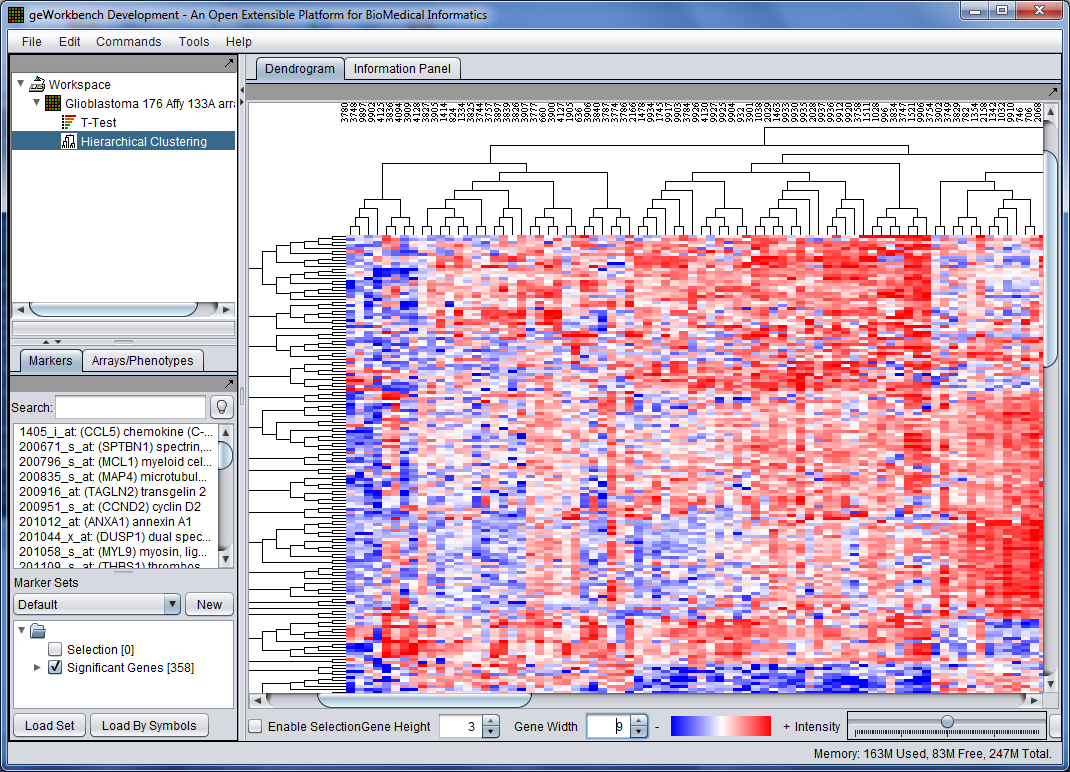
| 14:08, 15 July 2013 | Dendrogram home gallery.PNG (file) |  |
217 KB | Visualization of the results of a Hierarchical Clustering analysis. | 1 |
| 22:28, 19 October 2009 | Experiment data node (MRA).png (file) | .png) |
5 KB | 1 | |
| 14:52, 28 September 2006 | GeWorkbench1.0 UserGuide.pdf (file) | 1.87 MB | 1 | ||
| 16:57, 21 May 2007 | GeWorkbench 1.0 User Manual Supplement 1.pdf (file) | 1.19 MB | 1 | ||
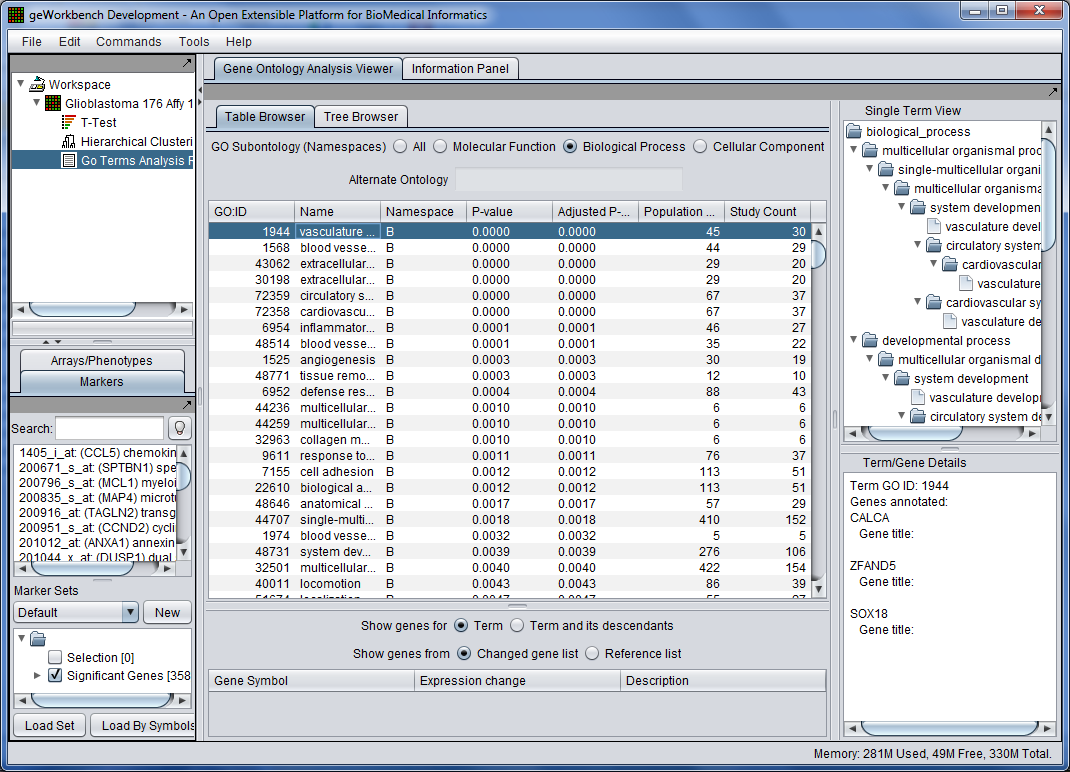
| 14:10, 15 July 2013 | Gene Ontology home gallery.PNG (file) |  |
161 KB | Gene Ontology (GO) analysis makes it possible to identify GO terms enriched in a user-specified gene signature (e.g., the significant genes from a differential gene expression analysis). | 1 |
| 17:27, 3 March 2022 | Geworkbench banner.png (file) | 38 KB | 2 | ||
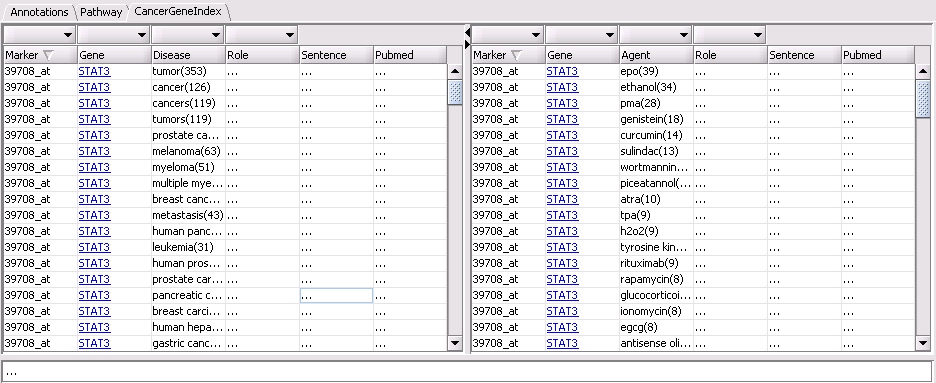
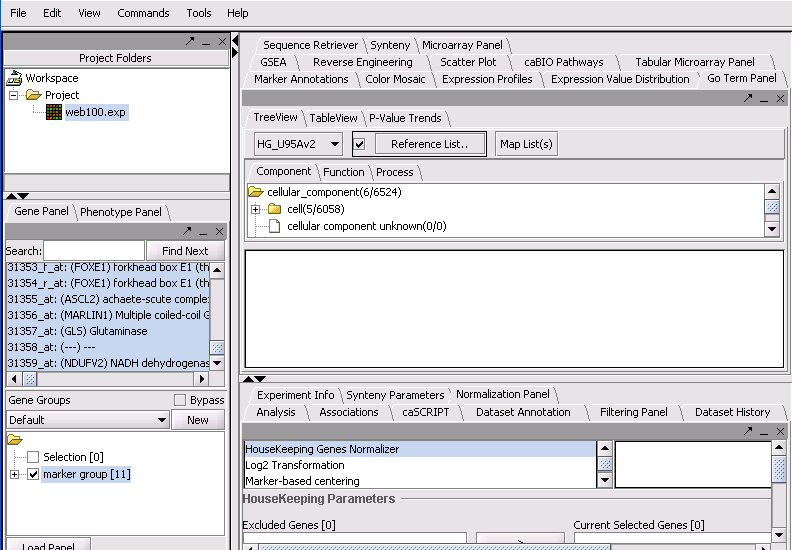
| 00:24, 7 February 2006 | Go Terms Panel.png (file) |  |
22 KB | 1 | |
| 15:08, 9 February 2006 | Histogram.png (file) |  |
27 KB | 1 | |
| 09:16, 23 October 2009 | Interaction network.txt (file) | 167 KB | 1 | ||
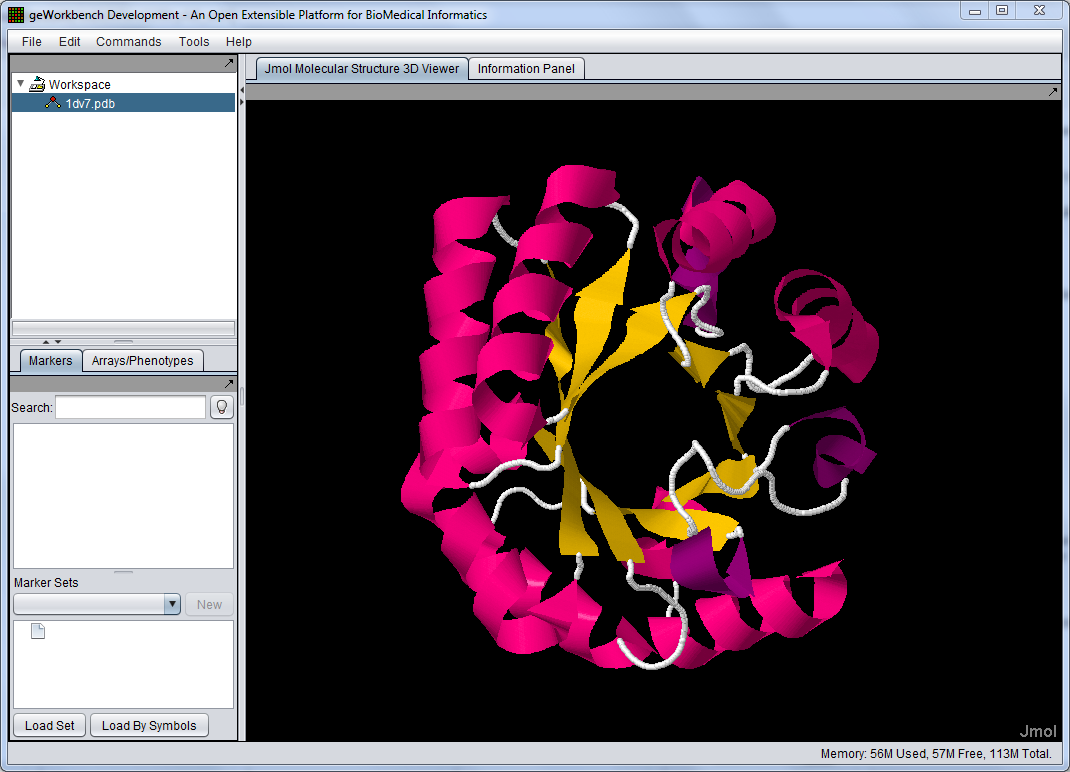
| 14:12, 15 July 2013 | JMol viewer home gallery.PNG (file) |  |
155 KB | The Jmol viewer (http://jmol.sourceforge.net/) is available as a geWorkbench component and allows the visualization of chemical structures in 3D. | 1 |
| 17:21, 22 October 2009 | MRA array set activation.png (file) |  |
7 KB | 1 | |
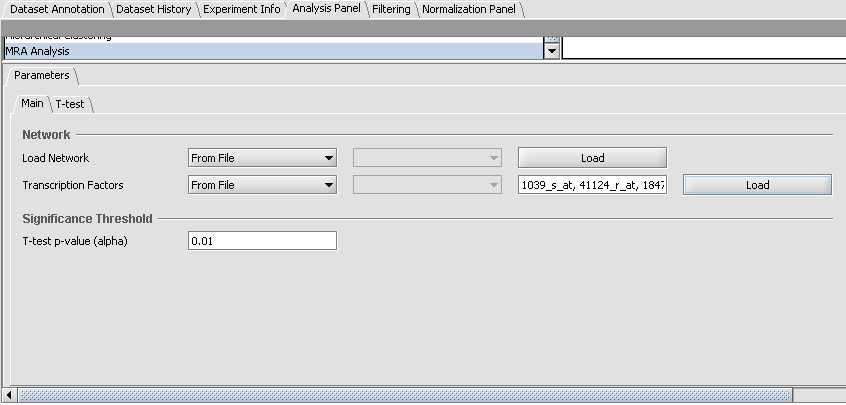
| 17:41, 22 October 2009 | MRA params setting 1.png (file) |  |
8 KB | 1 | |
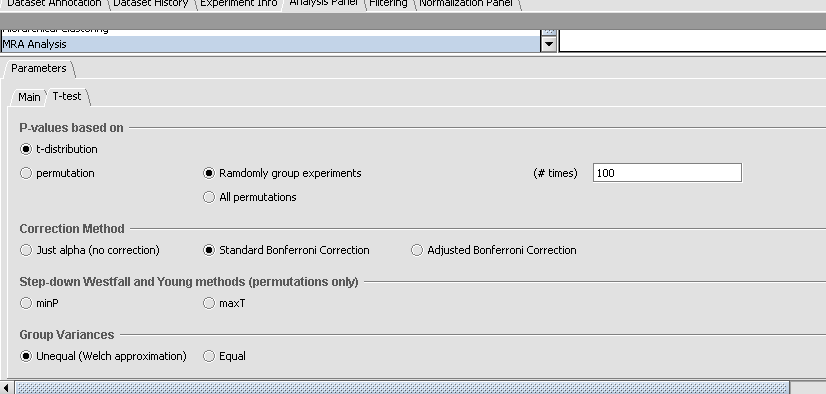
| 17:41, 22 October 2009 | MRA params setting 2.png (file) |  |
8 KB | 1 | |
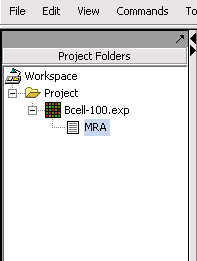
| 09:55, 21 October 2009 | MRA resulst node.png (file) |  |
3 KB | 1 | |
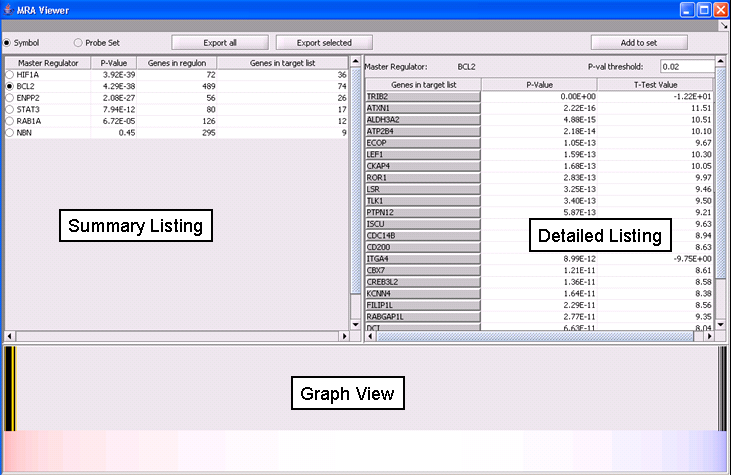
| 16:47, 20 October 2009 | MRA viewer full.png (file) |  |
83 KB | 2 | |
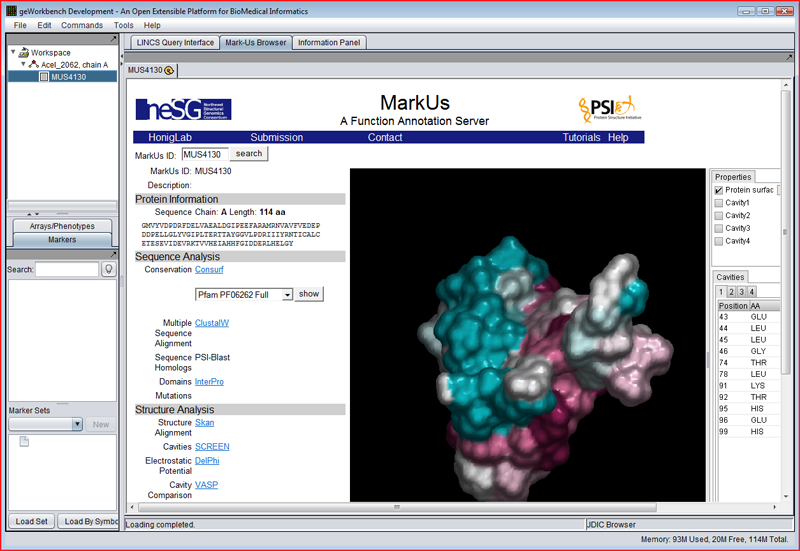
| 11:05, 16 July 2013 | MarkUs home gallery.PNG (file) |  |
224 KB | Results of running the MarkUs structure-based functional annotation pipeline on a protein with an available structure. | 1 |
| 09:28, 23 October 2009 | Master regulators.csv (file) | 62 bytes | 1 | ||
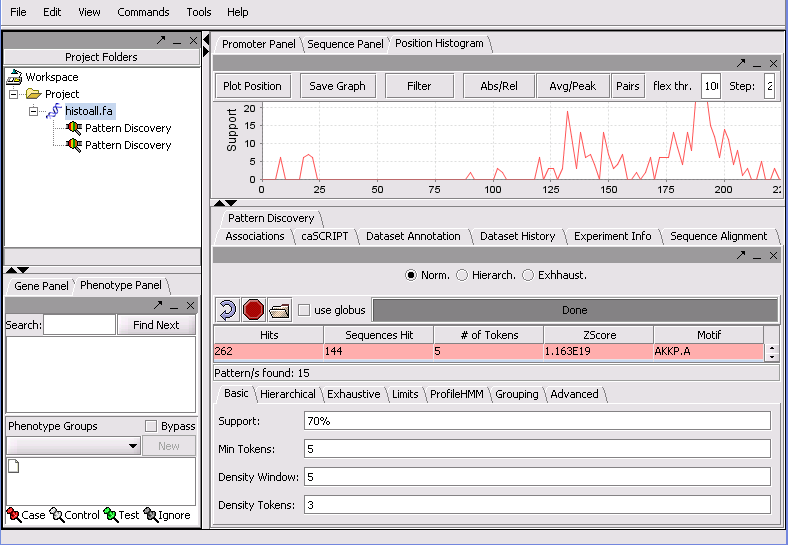
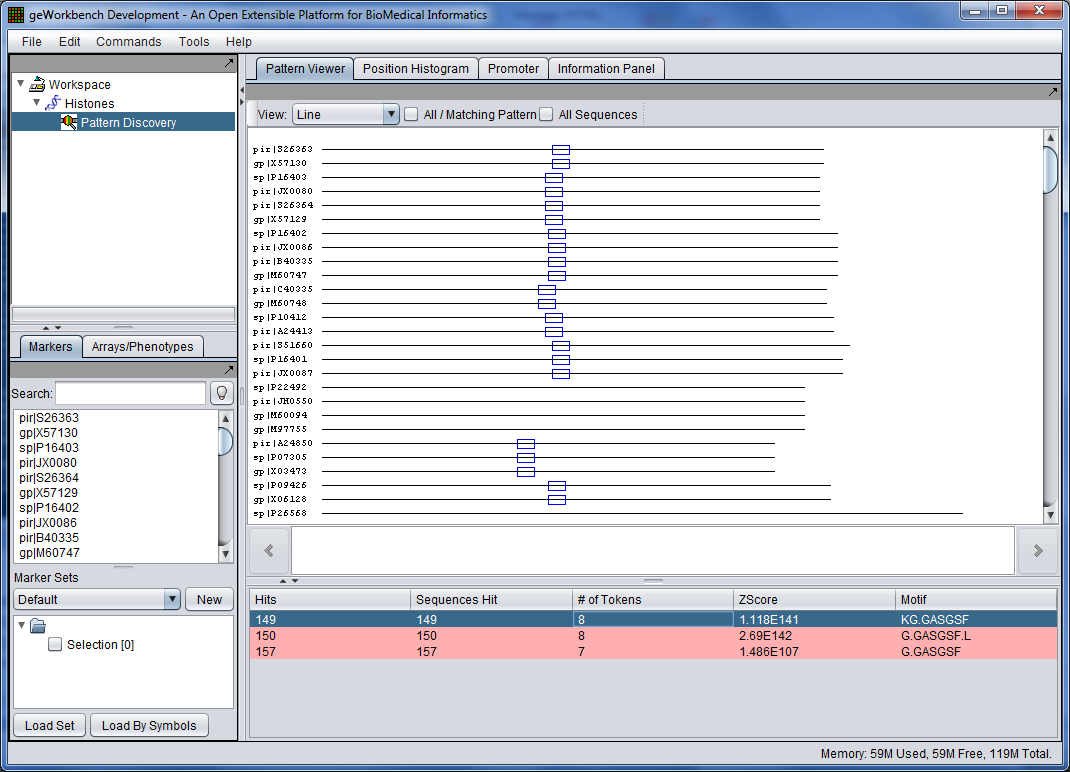
| 14:14, 15 July 2013 | Motif discovery home gallery.PNG (file) |  |
112 KB | The SPLASH component (structural pattern localization analysis by sequential histograms) provides the ability to identify sequence motifs in protein and DNA sequences. | 1 |
| 17:07, 11 July 2013 | Site banner.png (file) | 16 KB | 1 | ||
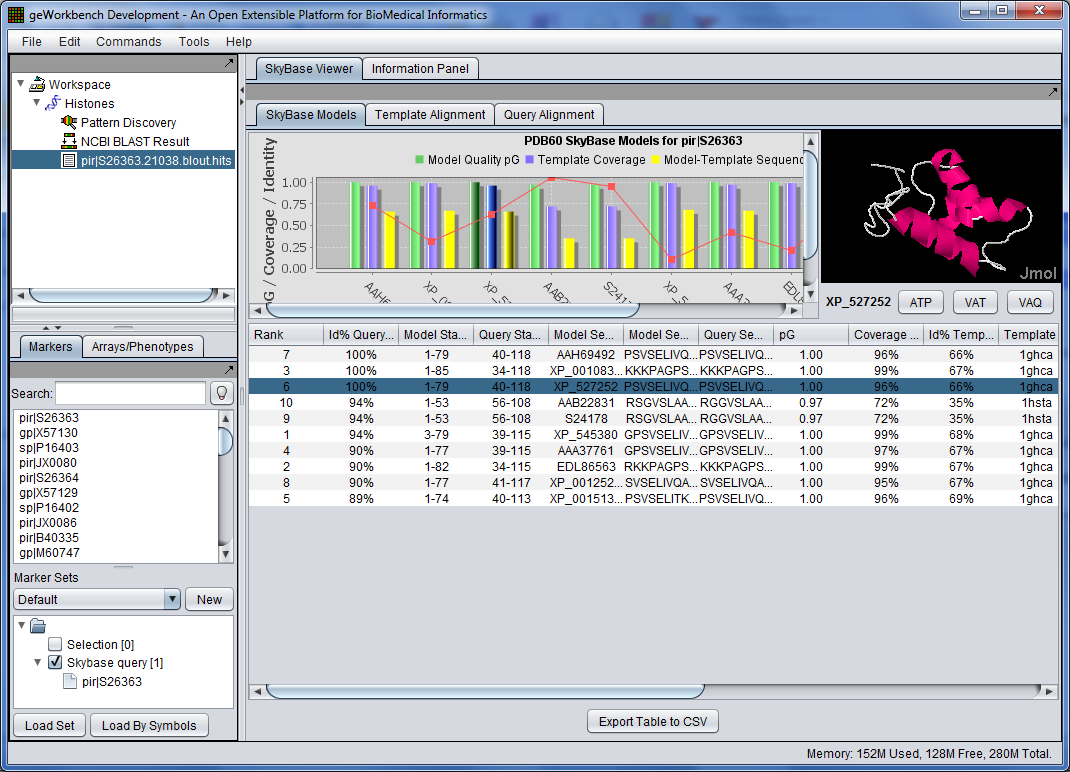
| 14:26, 15 July 2013 | Skybase home gallery.PNG (file) |  |
150 KB | A query protein sequence can be matched against the The Skybase database of computed 3D protein models, to identify putative matching models based on sequence homology. | 1 |
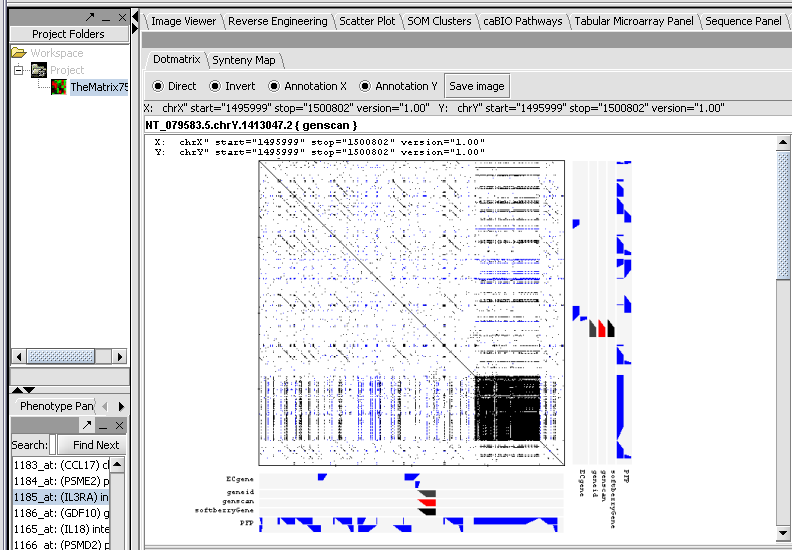
| 16:19, 9 February 2006 | Synteny Dotmatrix.png (file) |  |
82 KB | 1 | |
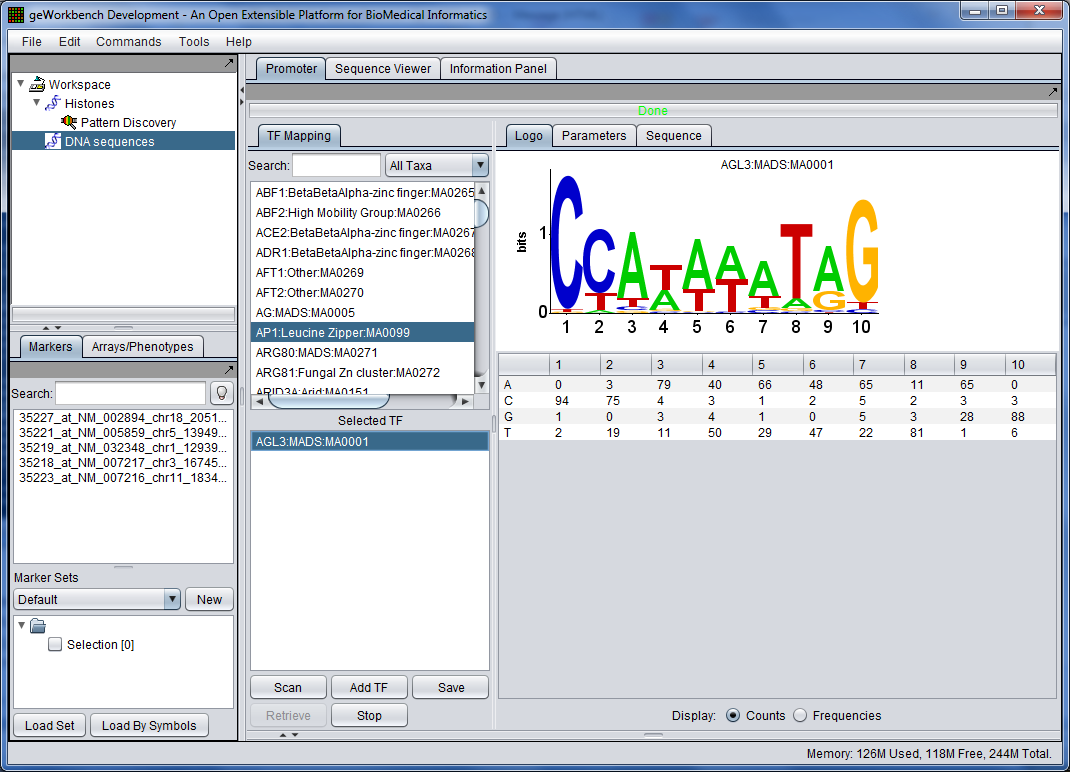
| 14:32, 15 July 2013 | TF binding site prediction home gallery.PNG (file) |  |
146 KB | The Promoter component enables the prediction of transcription factor binding sites on DNA sequences. Users can test for binding sites from the JASPAR database or upload any number of custom position specific scoring matrices (PSSMs). | 1 |
| 14:33, 15 July 2013 | Volcano plot home gallery.PNG (file) |  |
132 KB | A Volcano plot, displaying the results of differential gene expression analysis. | 1 |
