Difference between revisions of "User talk:Smith"
| Line 1: | Line 1: | ||
stuff cut out from other pages for possible later reuse: | stuff cut out from other pages for possible later reuse: | ||
| − | + | Before you can continue, geworkbench should be running. For help with this, please refer to the Getting Started [[Tutorial - Getting Started]] section. The file '''cardiomyopathy.exp''' should be used in this tutorial. | |
| − | + | ||
| − | + | ||
| + | ===Loading Data=== | ||
| + | |||
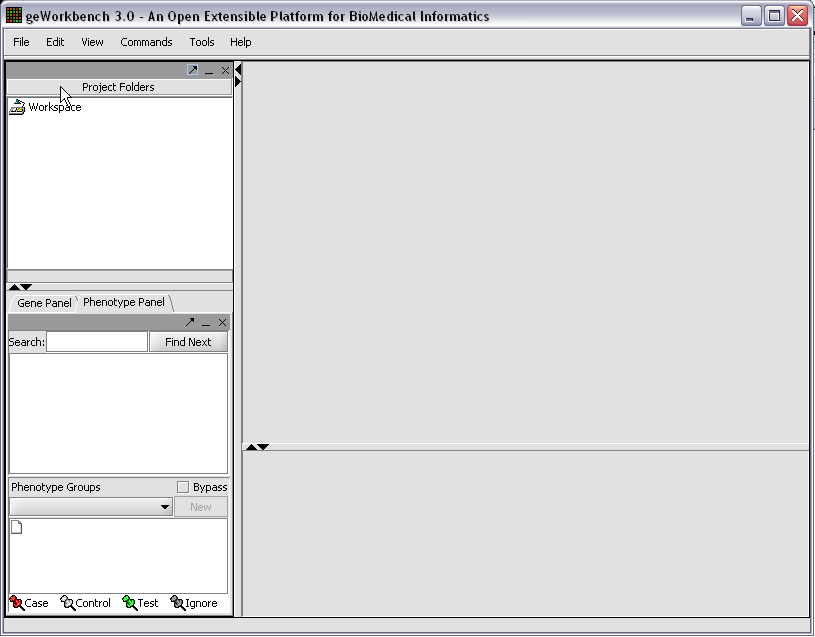
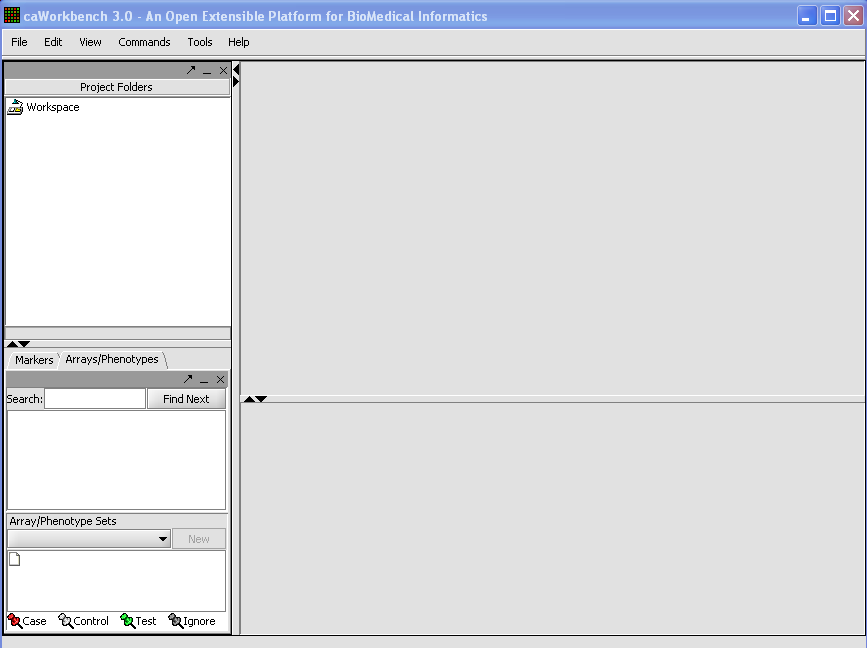
| + | When first started, geWorkbench appears so: | ||
| + | |||
| + | [[Image:T_StartupState.png]] | ||
| + | |||
| + | |||
| + | |||
| + | |||
| + | |||
| + | We can now assign phenotypes to each chip. We will place the phenotypes in the default group, however you can create new phenotype groups by pushing the '''New''' button on the '''Phenotype Panel''' at lower left. | ||
| + | |||
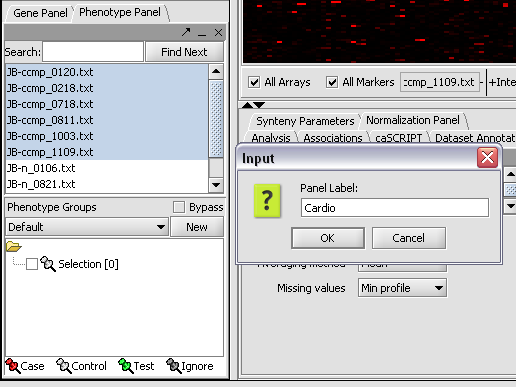
| + | Here we select and label arrays in the '''Phenotype Panel''' which contain samples from the congestive cardiomyopathy disease state... | ||
| + | |||
| + | [[Image:T_PanelLabelCardio.png]] | ||
| + | |||
| + | |||
| + | |||
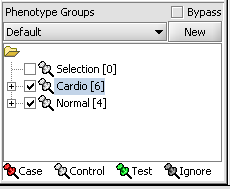
| + | Next, we can similarly label the remaining arrays as "Normal". We have also checked boxes to indicate that these groups of arrays are "Active". Various analysis and visualization components can be set to only use/display activated arrays or markers. | ||
| + | |||
| + | [[Image:T_PhenotypesPriorToCase.png]] | ||
| + | |||
| + | |||
| + | |||
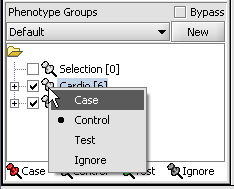
| + | For statistical tests such as the t-test the Case and Control groups can be specified. This is done by left-clicking on the thumb-tack icon in front of the phenotype name. Here we are specifying the disease arrays as the "Case". The remaining "Normal" arrays are by default labeled control. | ||
| + | [[Image:T_PhenotypeSettingCase.png]] | ||
| + | |||
| + | |||
| + | |||
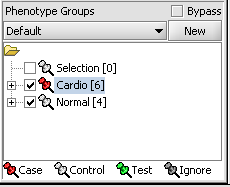
| + | A red thumbtack indicates the arrays have been specified as "Case". | ||
| + | |||
| + | [[Image:T_PhenotypeCaseSet.png]] | ||
| + | |||
| + | |||
| + | |||
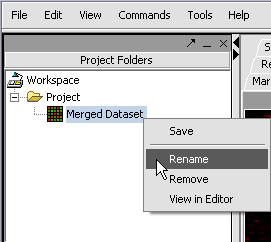
| + | We can also rename the merged dataset by clicking on its entry in the '''Project Panel'''. | ||
| + | |||
| + | [[Image:T_RenameDataset.png]] | ||
| + | |||
| + | |||
| + | |||
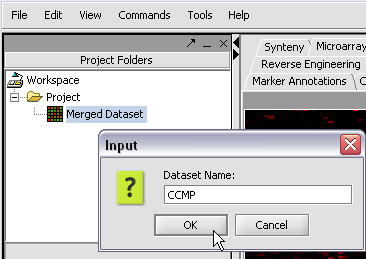
| + | Here we will call it CCMP. | ||
| + | |||
| + | [[Image:T_RenamingDataset.png]] | ||
| + | |||
| + | |||
| + | |||
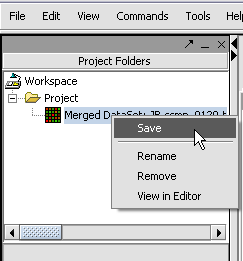
| + | With the datasets merged, classified and named, we can save the dataset for future use. We will call it "cardiomyopathy.exp" (.exp is the default extension for the geWorkbench matrix file type). | ||
| + | |||
| + | [[Image:T_SaveProject.png]] | ||
| + | |||
| + | |||
| + | |||
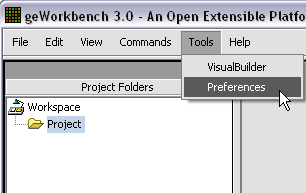
| + | The default display of microarray data is an absolute display. We can change it to a relative display by selecting Tools:Preferences from the top menubar. We have removed the dataset so that we can read it back in using the new preferences. | ||
| + | |||
| + | [[Image:T_ChangePrefs.png]] | ||
| + | |||
| + | |||
| + | |||
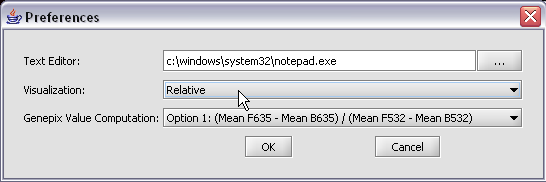
| + | Here we select the '''relative''' display type. | ||
| + | |||
| + | [[Image:T_ChangePrefsToRelative.png]] | ||
| + | |||
| + | |||
| + | |||
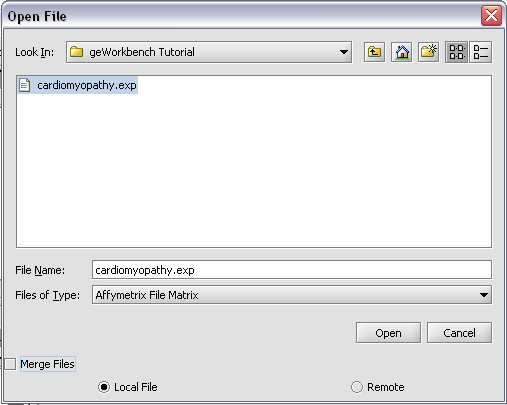
| + | Returning to the Open File dialog as we before by right-clicking on the project entry, we will select the "cardiomyopathy.exp" file we previously saved... | ||
| + | |||
| + | [[Image:T_OpenCardio.png]] | ||
| + | |||
| + | |||
| + | |||
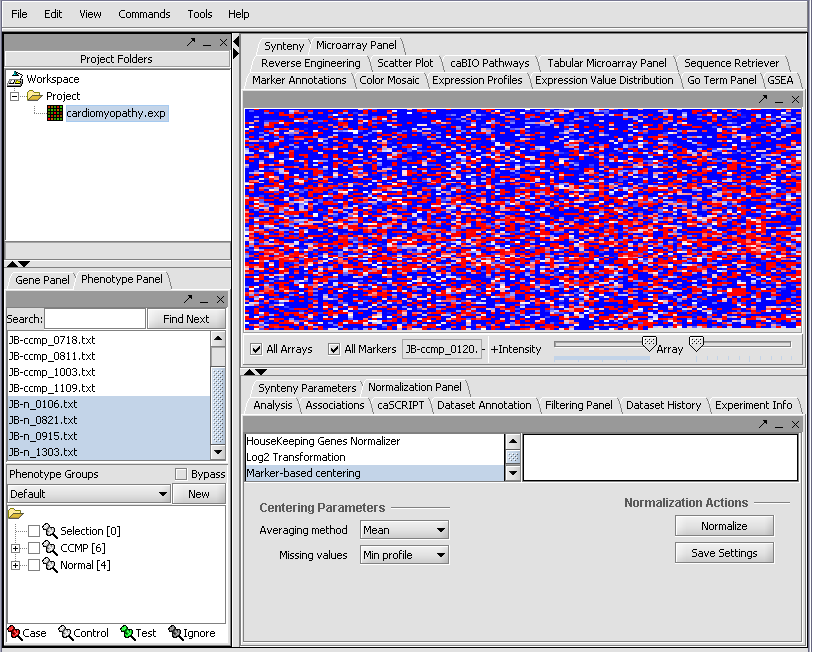
| + | Resulting in the following colorful display of the array data for the first array.... | ||
| + | |||
| + | [[Image:T_RelativeDisplay.png]] | ||
| + | |||
| + | |||
| + | |||
| + | |||
| + | |||
| + | [[Image:(T)MarGettingStarted.png]] | ||
Revision as of 20:42, 27 February 2006
stuff cut out from other pages for possible later reuse:
Before you can continue, geworkbench should be running. For help with this, please refer to the Getting Started Tutorial - Getting Started section. The file cardiomyopathy.exp should be used in this tutorial.
Loading Data
When first started, geWorkbench appears so:
We can now assign phenotypes to each chip. We will place the phenotypes in the default group, however you can create new phenotype groups by pushing the New button on the Phenotype Panel at lower left.
Here we select and label arrays in the Phenotype Panel which contain samples from the congestive cardiomyopathy disease state...
Next, we can similarly label the remaining arrays as "Normal". We have also checked boxes to indicate that these groups of arrays are "Active". Various analysis and visualization components can be set to only use/display activated arrays or markers.
For statistical tests such as the t-test the Case and Control groups can be specified. This is done by left-clicking on the thumb-tack icon in front of the phenotype name. Here we are specifying the disease arrays as the "Case". The remaining "Normal" arrays are by default labeled control.
A red thumbtack indicates the arrays have been specified as "Case".
We can also rename the merged dataset by clicking on its entry in the Project Panel.
Here we will call it CCMP.
With the datasets merged, classified and named, we can save the dataset for future use. We will call it "cardiomyopathy.exp" (.exp is the default extension for the geWorkbench matrix file type).
The default display of microarray data is an absolute display. We can change it to a relative display by selecting Tools:Preferences from the top menubar. We have removed the dataset so that we can read it back in using the new preferences.
Here we select the relative display type.
Returning to the Open File dialog as we before by right-clicking on the project entry, we will select the "cardiomyopathy.exp" file we previously saved...
Resulting in the following colorful display of the array data for the first array....
