K-Means Clustering
Contents
Overview
This component provides an interface to running K-Means Clustering on a GenePattern server, and a viewer for the results.
As described in the GenePattern modules documentation :
"K-Means clustering is a clustering algorithm that classifies or groups objects into a specified number of clusters. Initially, k cluster centroids (centers) are randomly selected from the given data set and each data point is assigned to the cluster of the nearest cluster center. Each cluster center is then recalculated to be the mean value of its members and all data points are re-assigned to the cluster with the closest centroid. This process is repeated until the distance between consecutive cluster centers converges".
Prerequisites
The K-Means clustering analysis and viewer components must be loaded in the Component_Configuration_Manager
A gene expression dataset must be loaded in the Workspace.
Parameters
- Number of Clusters - This is the number k of clusters in which to group the data.
- Cluster by
- Genes
- Arrays
- Distance Metric
- Euclidean - the only option offered.
- Note - If there are a large number of genes, it may not be advisable to attempt to cluster by genes.
Results Viewer
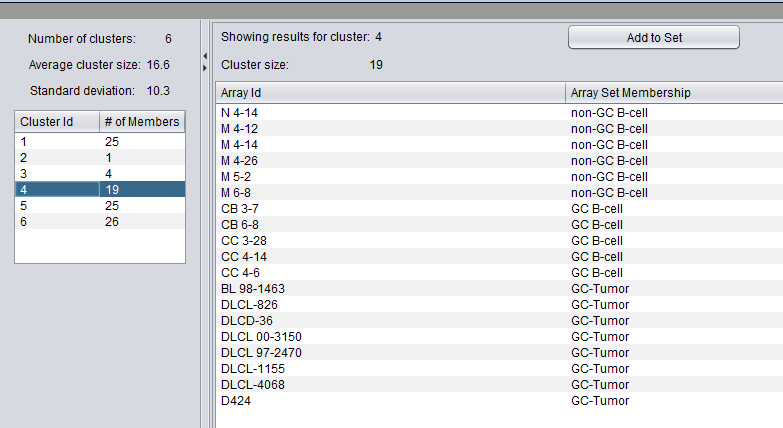
The results viewer consists of two panes, one for cluster selection and the other for viewing details of the selected cluster.
Cluster Selection
At the top of the left pane is a summary of the clustering results. The number k of clusters, the average cluster size (number of members), and the standard deviation of that average value are shown.
Below the summary is a list of the clusters. For each cluster, it shows the number of members of the cluster, that is, how many arrays or genes are found in that particular cluster.
Selecting any cluster in the list will display its details in the pane to the right.
In the example shown, the fourth cluster of six was selected.
Cluster Details
The pane on the right shows details of the selected cluster:
- The cluster id (selected at right)
- the cluster size
A list shows each member of the selected cluster. The two columns (if the clustering dimension "Array" was chosen during analysis) are:
- Array ID - the array name in the dataset
- Array Set Membership - If a list of array sets was displayed in the Arrays component at the time of the analysis, the set membership of each array in the cluster will be shown.
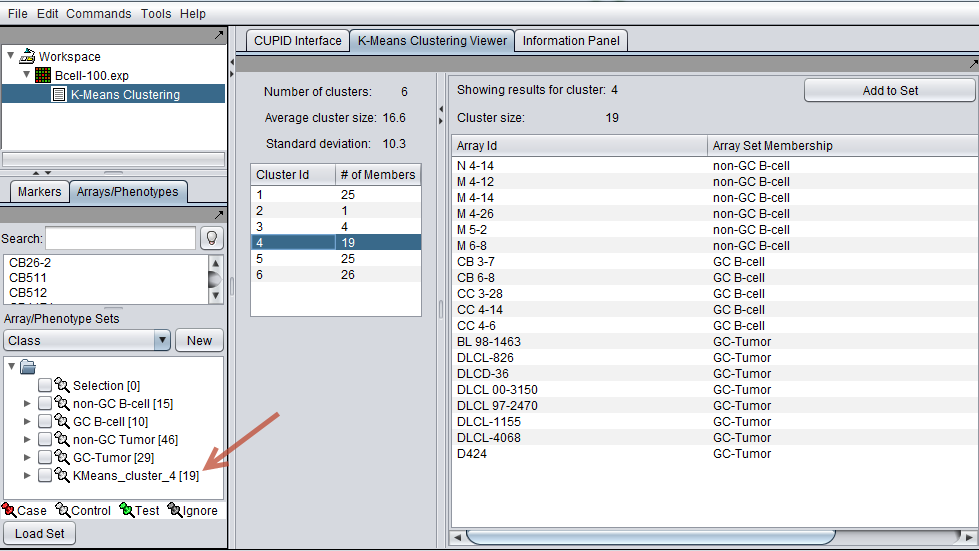
- Add to Set - Pushing this button will add the contents of the selected set to the Arrays or Markers component as a new set. The cluster name is included in the new set name. For example, in the example above, pushing "Add to Set" will add 19 arrays to a new set called "KMeans_cluster_4".
The new set of arrays for cluster 4 (red arrow) is shown in the Arrays component in the complete geWorkbench interface below.
Technical Note
The K-Means clustering component is found in the "gpmodule_v3_0" package in the geWorkbench component source tree.
References
- J. B. MacQueen (1967) Some Methods for classification and Analysis of Multivariate Observations. Proceedings of 5th Berkeley Symposium on Mathematical Statistics and Probability, Berkeley, University of California Press, 1:281-297
- GenePattern module descriptions


