K-Means Clustering
|
Home | Quick Start | Basics | Menu Bar | Preferences | Component Configuration Manager | Workspace | Information Panel | Local Data Files | File Formats | caArray | Array Sets | Marker Sets | Microarray Dataset Viewers | Filtering | Normalization | Tutorial Data | geWorkbench-web Tutorials |
Analysis Framework | ANOVA | ARACNe | BLAST | Cellular Networks KnowledgeBase | CeRNA/Hermes Query | Classification (KNN, WV) | Color Mosaic | Consensus Clustering | Cytoscape | Cupid | DeMAND | Expression Value Distribution | Fold-Change | Gene Ontology Term Analysis | Gene Ontology Viewer | GenomeSpace | genSpace | Grid Services | GSEA | Hierarchical Clustering | IDEA | Jmol | K-Means Clustering | LINCS Query | Marker Annotations | MarkUs | Master Regulator Analysis | (MRA-FET Method) | (MRA-MARINa Method) | MatrixREDUCE | MINDy | Pattern Discovery | PCA | Promoter Analysis | Pudge | SAM | Sequence Retriever | SkyBase | SkyLine | SOM | SVM | T-Test | Viper Analysis | Volcano Plot |
Contents
Overview
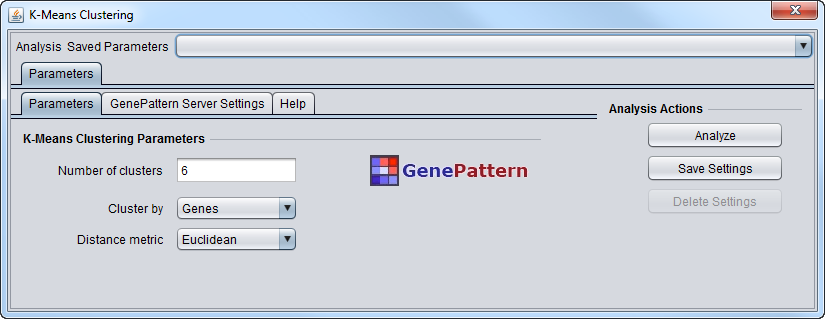
This component provides an interface to running K-Means Clustering on a GenePattern server, and a viewer for the results.
As described in the GenePattern modules documentation :
"K-Means clustering is a clustering algorithm that classifies or groups objects into a specified number of clusters. Initially, k cluster centroids (centers) are randomly selected from the given data set and each data point is assigned to the cluster of the nearest cluster center. Each cluster center is then recalculated to be the mean value of its members and all data points are re-assigned to the cluster with the closest centroid. This process is repeated until the distance between consecutive cluster centers converges".
Prerequisites
The K-Means clustering analysis and viewer components must be loaded in the Component_Configuration_Manager
A gene expression dataset must be loaded in the Workspace.
Parameters
- Number of Clusters - This is the number k of clusters in which to group the data.
- Cluster by
- Genes
- Arrays
- Distance Metric
- Euclidean - the only option offered.
GenePattern Server Settings
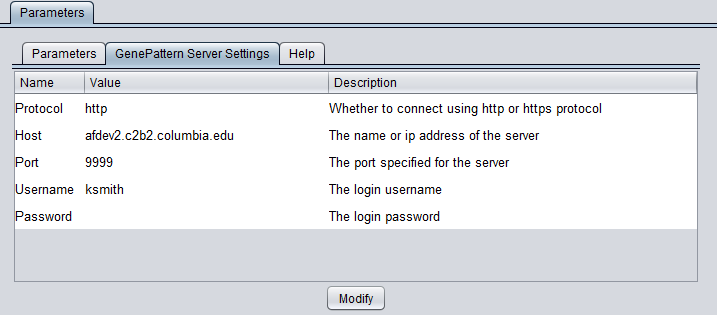
You can connect to any running GenePattern server to run the analysis (provided it has the required module installed). An example configuration of the "GenePattern Server Settings" tab is shown here:
To run GenePattern components, a GenePattern account is required.
Pushing "Modify" brings up an editing box where any of the settings can be changed.
- Protocol - HTTP or HTTPS, depending on the server being used.
- Host - URL of a GenePattern server.
- Port - Port at which the GenePattern server is located on the Host machine.
- Username - A valid user name on the specified GenePattern server.
- Password - A password, if required by the specified server.
Results Viewer
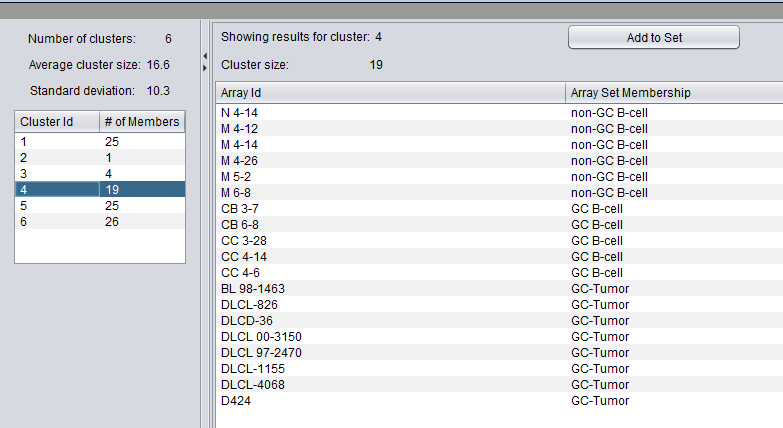
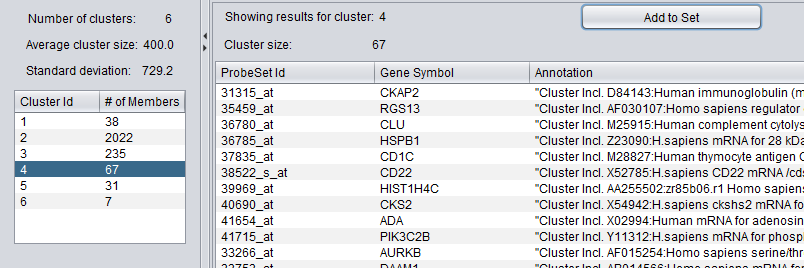
The results viewer consists of two panes, one for cluster selection and the other for viewing details of the selected cluster.
Cluster Selection
At the top of the left pane is a summary of the clustering results. The number k of clusters, the average cluster size (number of members), and the standard deviation of that average value are shown.
Below the summary is a list of the clusters. For each cluster, it shows the number of members of the cluster, that is, how many arrays or genes are found in that particular cluster.
Selecting any cluster in the list will display its details in the pane to the right.
In the example shown, the fourth cluster of six was selected.
Cluster Details
The pane on the right shows details of the selected cluster:
- The cluster id (selected at right)
- the cluster size
A list shows each member of the selected cluster.
The two columns (if the clustering dimension "Array" was chosen during analysis) are:
- Array ID - the array name in the dataset
- Array Set Membership - If a list of array sets was displayed in the Arrays component at the time of the analysis, the set membership of each array in the cluster will be shown.
The two columns (if the clustering dimension "Genes" was chosen during analysis) are:
- ProbeSetID - the probeset name in the dataset
- Gene Symbol - the gene symbol for the probset, if an annotation file was loaded in the Workspace.
- Annotation - Annotation for each probeset, if an annotation file was loaded in the Workspace.
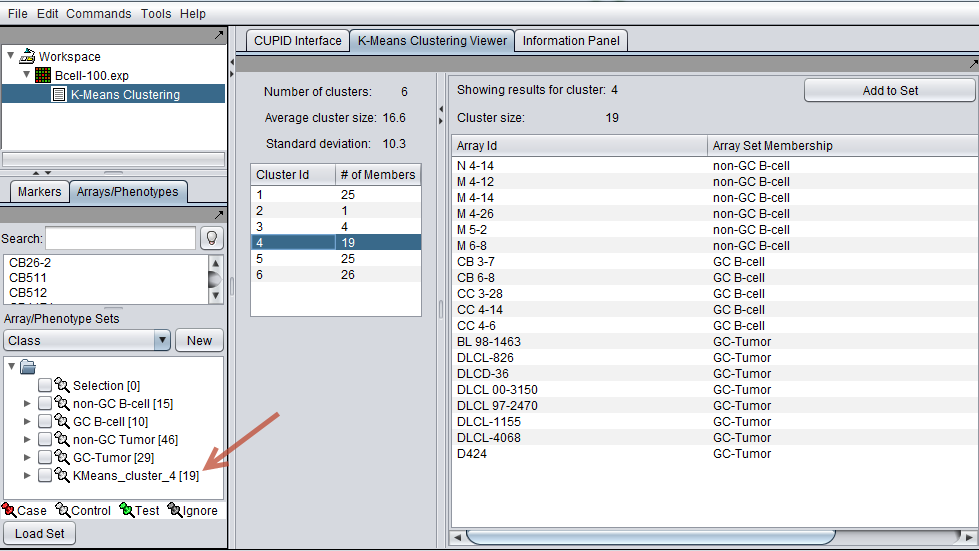
- Add to Set - Pushing this button will add the contents of the selected set to the Arrays or Markers component as a new set. The cluster name is included in the new set name. For example, in the example above, pushing "Add to Set" will add 19 arrays to a new array set called "KMeans_cluster_4".
The new set of arrays for cluster 4 (red arrow) is shown in the Arrays component in the complete geWorkbench interface below.
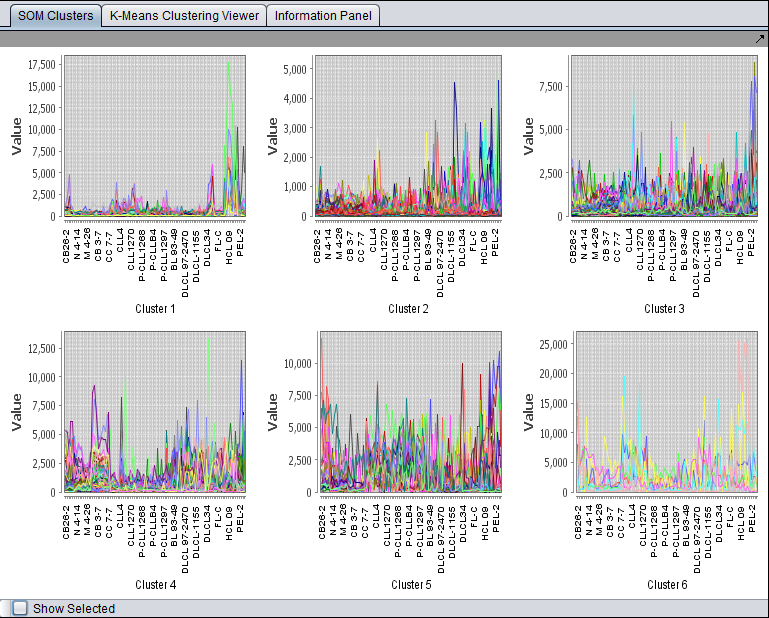
Below is the K-Means viewer showing the results of cluster by genes. The dataset was filtered to only contain 2400 probesets, which were easily clustered.
K-Means "SOM" Cluster Viewer
When the cluster dimension is "Genes", the clusters are displayed using the SOM cluster component. Note - the clusters are still the K-Means clusters, just displayed using the SOM Viewer to allow simultaneous display of each cluster.
For each displayed cluster, the horizontal axis represents the individual arrays. The colored lines represent each probeset. The vertical axis is the expression value.
Please see the tutorial for the SOM Cluster Viewer for details of graphing options.
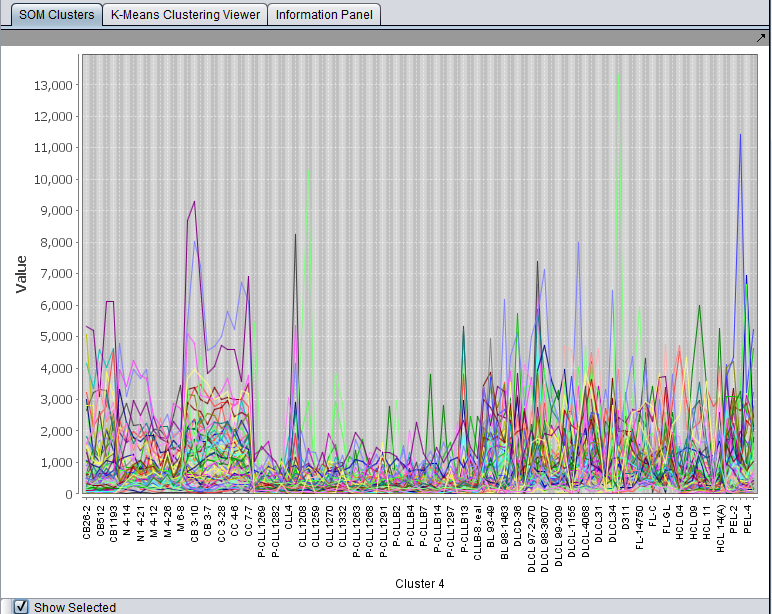
- Show Selected - if this box is checked, then clicking on any graph in the component will enlarge it to fill the entire Viewer. Unchecking the box again will return to the display of all clusters.
Technical Note
The K-Means clustering component is found in the "gpmodule_v3_0" package in the geWorkbench component source tree.
References - GenePattern
- Reich M, Liefeld T, Gould J, Lerner J, Tamayo P, Mesirov JP (2006) GenePattern 2.0 Nature Genetics 38 no. 5 (2006): pp500-501 doi:10.1038/ng0506-500. (PubMed 16642009)
- GenePattern website.
- GenePattern modules documentation.
References - K-Means
- J. B. MacQueen (1967) Some Methods for classification and Analysis of Multivariate Observations. Proceedings of 5th Berkeley Symposium on Mathematical Statistics and Probability, Berkeley, University of California Press, 1:281-297
