Difference between revisions of "MRA-FET"
| Line 49: | Line 49: | ||
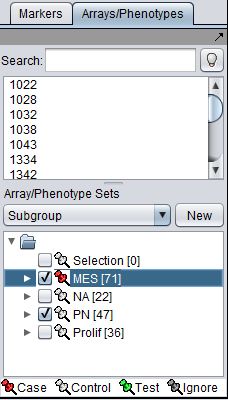
[[Image:Array_set_class_assignment_MRA.png]] | [[Image:Array_set_class_assignment_MRA.png]] | ||
| + | |||
| + | |||
| + | =Viewing MRA analysis results (FET Method)= | ||
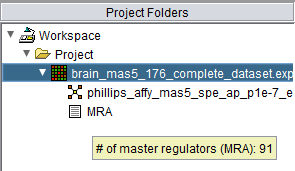
| + | Following the successful completion of the MRA FET computation, a result node (MRA) appears in the Project Folder area of the geWorkbench interface, under the microarray experiment node. Hovering the cursor over the MRA result node will show the number of master regulators found. | ||
| + | |||
| + | |||
| + | [[Image:Project_Folders_MRA_Tooltip.png]] | ||
| + | |||
| + | The results of the analysis can be visualized in the MRA Viewer component by selecting the result node. | ||
| + | |||
| + | ==MRA Results Viewer== | ||
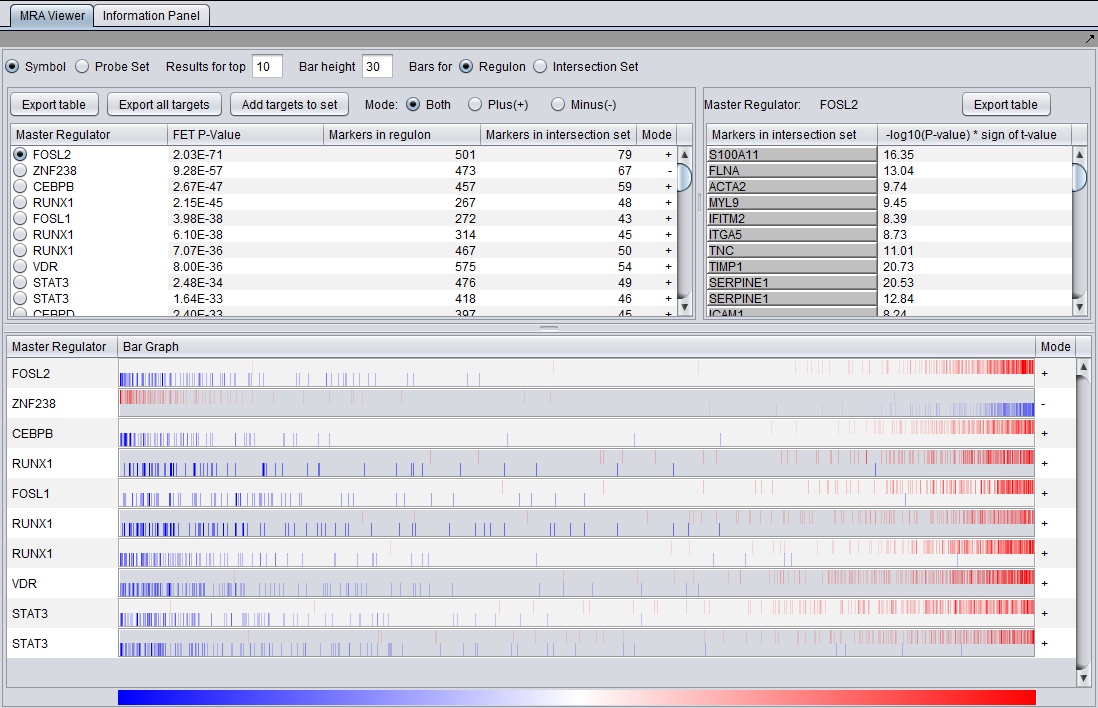
| + | The MRA viewer is structured in 3 distinct areas. | ||
| + | |||
| + | (In the figures below, the data is sorted on the "genes in intersection set column"). | ||
| + | |||
| + | |||
| + | [[Image:MRA_viewer_GBM_FOSL2_v2.png]] | ||
| + | |||
| + | |||
| + | '''Note''' - if no significant MRs are found, an empty result node is returned to the Project Folders component. The MRA viewer will appear but be empty. | ||
| + | |||
| + | ===Summary Listing=== | ||
| + | |||
| + | |||
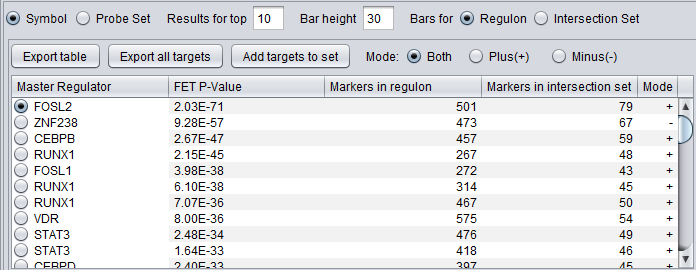
| + | [[Image:MRA_Summary_listing_v2.png]] | ||
| + | |||
| + | |||
| + | ====First Row of Controls==== | ||
| + | * '''Symbol''' - display the markers using their gene symbol (if available) | ||
| + | * '''Probeset''' - display markers using their marker (probeset) name. | ||
| + | * '''Results for top''' ... - Restrict the "bar graph" to at most the specified number of entries. | ||
| + | * '''Bar height''' ... - set the height of the veritcal lines in the bar graph in pixels. | ||
| + | * '''Bars for''' | ||
| + | ** '''Regulon''' - draw bars for each marker in the hub marker's regulon | ||
| + | ** '''Intersection set''' - draw bars for only those markers in the hub's regulon that are also present in the list of signature markers. | ||
| + | |||
| + | ====Second Row of Controls==== | ||
| + | =====Export Table===== | ||
| + | This command will export the entire master regulator results table to a file. It exports the same information shown on screen, sorted in the same way if the table has been sorted on one of the columns. The user can choose to export the table in CSV (.csv) or tab-delimited text format (.txt). | ||
| + | |||
| + | The following columns are exported: | ||
| + | * Master Regulator | ||
| + | * FET P-Value | ||
| + | * Genes in regulon (count) | ||
| + | * Genes in intersection set (count) | ||
| + | |||
| + | =====Export all targets===== | ||
| + | This command writes a file to disk containing each MR in the table, along with each MRs targets and the (value) for each target. | ||
| + | |||
| + | The master regulators and their markers in the intersection set (intersection of each MRs regulon and the signature genes) are exported, along with the T-test value calculated for display of the regulon. Each master regulator is listed on a line, followed by its intersection set markers with their t-test t values. Each MR is separated by a blank line from the preceeding section. The order in the file is not changed by sorting the results table prior to export. | ||
| + | |||
| + | '''Export File format''': | ||
| + | |||
| + | marker, gene name, t-value | ||
| + | |||
| + | Example: | ||
| + | |||
| + | 220462_at, CSRNP3 | ||
| + | 200660_at, S100A11, 12.541623 | ||
| + | 201474_s_at, ITGA3, 7.4126143 | ||
| + | 202910_s_at, CD97, 10.785 | ||
| + | .... | ||
| + | |||
| + | 202614_at, SLC30A9 | ||
| + | 160020_at, MMP14, 4.415267 | ||
| + | 200808_s_at, ZYX, 9.006654 | ||
| + | 200859_x_at, FLNA, 8.309419 | ||
| + | .... | ||
| + | |||
| + | |||
| + | Exported files automatically receive a ".csv" file name extension. | ||
| + | |||
| + | =====Add Targets to Set===== | ||
| + | Create a new marker set in the Markers component containing the intersection set for the selected master regulator. The set is named after the master regulator. | ||
| + | |||
| + | =====Mode===== | ||
| + | This set of radio buttons controls which mode results to display in the bar graph, if the two-FET method for MRA was used (See above section [[Master_Regulator_Analysis#FET_method_details | FET method details]]). | ||
| + | * '''Both''' - display results with both plus and minus modes. | ||
| + | * '''Plus (+)''' - display only "plus" mode results. | ||
| + | * '''Minus (-)''' - display only "minus" mode results. | ||
| + | |||
| + | ====Table Column Headers==== | ||
| + | At upper left in the MRA viewer. For each candidate master regulator found to have a significant effect using Fisher's Exact test, the following four columns are displayed: | ||
| + | * '''Master Regulator''' - This is either the master regulator gene name or the marker/probeset name identifying the corresponding array feature (depending on the selection of the radio buttons “Symbol” and “Probe set”). | ||
| + | * '''FET p-value''' - the p-value from Fisher’s exact test. The test utilizes a 2x2 contingency table where rows classify markers as belonging to the signature set or not, while columns indicate if a marker belongs to the regulon of the master regulator or not. Counts are computed using all markers found in the input experiment data. (Fischer's exact test includes p-values for more-extreme tables). | ||
| + | * '''Genes in Regulon''' - the number of markers (genes) found to be first neighbors of the master regulator in the loaded network - its regulon. | ||
| + | * '''Genes in Intersection Set''' - The number of markers found in the intersection of the signature and the regulon of the candidate MR. | ||
| + | * '''Mode''' - Only used if MRA was run with the two-FET option. See the above section [[Master_Regulator_Analysis#FET_method_details | FET method details]]. | ||
| + | |||
| + | The contents of the table can be ordered by any column, by clicking on the column name. Sorting by the number of genes in the intersection set may give list with the more biologically interesting hits on top. As each regulon is of different size, the p-values are not directly comparable. | ||
| + | |||
| + | Clicking on the radio button for any of the master regulators will display the list of intersection genes in a table to the right (Detailed Listing), and will draw the regulon bar graph below. | ||
| + | |||
| + | ===Detailed Listing=== | ||
| + | |||
| + | The detailed list shows the genes/markers contained in the intersection set of the MR regulon and the signature. | ||
| + | |||
| + | |||
| + | [[Image:MRA_Detailed_listing.png]] | ||
| + | |||
| + | The genes are displayed in a table with the following columns: | ||
| + | * '''Genes in intersection set''': the names of the genes in the intersection set. Either the gene name or the marker/probe set name is used (based on the choice of "Symbol" or "Probe Set" radio buttons). | ||
| + | * '''-log10(p-value) * sign (t-value)''': A modified test statistic combining the -log10(p-value) with the sign of the t-value. The sign of the t-value indicates positive or negative differential expression. | ||
| + | |||
| + | |||
| + | ====Export Table==== | ||
| + | This command will export to a file on disk the contents of the detailed target results table. | ||
| + | |||
| + | The file can be written in either tab-delimited (.txt) or CSV (.csv) format. | ||
| + | |||
| + | The columns exported are: | ||
| + | |||
| + | * Genes in intersection set | ||
| + | * -log10(P-value) * sign of t-value | ||
| + | |||
| + | ===Bar Graph View=== | ||
| + | ====Description==== | ||
| + | The bar graph is created based on ranked differential expression results for all markers in the dataset. However, only markers in the TF's regulon or intersection set (depending on the setting chosen) are drawn as vertical bars, allowing their positions in the entire set of markers to be visualized. | ||
| + | |||
| + | The value used to calculate the differential expression display is '''-log10(p-value) * sign (t-value)''', as in the detailed table display described above. | ||
| + | |||
| + | |||
| + | [[Image:MRA_graph_view_GBM.png]] | ||
| + | |||
| + | * '''Vertical bars''' - The vertical bars correspond to ranked positions of the markers belonging to each TF's regulon or intersection set (depending on the setting chosen). | ||
| + | * '''Bar position on horizontal axis''' - bars for displayed markers are positioned using their rank in a list of all markers ordered by (-log10(p-value) * sign (t-value)), calculated using a t-test for differential expression. | ||
| + | * '''Bar Color''' - The color of each bar indicates the sign of the Spearman's Correlation between the expression profile of the TF and its targets (calculated using data from all microarrays in the experiment, not just those in the case and control sets): | ||
| + | ** ''Red'' means that the two markers are positively correlated (r >= 0) while | ||
| + | ** ''Blue'' means that correlation is negative (r < 0). | ||
| + | * '''Gradient''' - The red-blue gradient at the bottom of the graph qualitatively represents the ranking between the lowest (blue) and the highest (red) test statistic. The white area in the middle represents the middle of the ranking (not necessarily zero differential expression). | ||
| + | |||
| + | ====Detailed Examples==== | ||
| + | Detail for FOSL2: | ||
| + | |||
| + | [[Image:MRA_graph_GBM_FOSL2_v2.png]] | ||
| + | |||
| + | The bar graph shown above, for FOSL2, indicates that the expression profile of FOSL2 is positively correlated with its regulon targets having postive differential expression in the "case", mesenchymal phenotype. FOSL2 is more active in the mesenchymal than in the proneural phenotype. | ||
| + | |||
| + | |||
| + | Detail for ZNF238: | ||
| + | |||
| + | [[Image:MRA_graph_GBM_ZNF238_v2.png]] | ||
| + | |||
| + | |||
| + | The bar graph shown above, for ZNF238, indicates that expression profile of ZNF238 is positively correlated with its regulon targets having positive differential expression in the control, proneural phenotype. ZNF238 is less active in the mesenchymal phenotype and more active in the proneural phenotype. | ||
| + | |||
| + | ====Save Image==== | ||
| + | Via a right-click menu on the bar graph, the user can save an image of the displayed bar graph to | ||
| + | * the Project as an image snapshot, or | ||
| + | * directly to a file on disk. Available formats are PNG, JPEG, TIF and BMP. | ||
| + | |||
| + | [[Image:MRA_graph_save_image.png]] | ||
| + | |||
| + | ===Graph View (prior to 2.4.0)=== | ||
| + | |||
| + | The bar code view in geWorkbench 2.3.0 and some prior versions was similar to that described above but positioned the bars based directly on t-value rather than on the ranking in all markers. The right and left extremes represented the largest negative and positive t-values seen among all results, not just for the depicted TF. | ||
| + | |||
| + | The results below were calculated using the same data as depicted in the above figures for the current graph method. | ||
| + | |||
| + | FOSL2: | ||
| + | |||
| + | [[Image:MRA_graph_GBM_FOSL2.png]] | ||
| + | |||
| + | |||
| + | ZNF238: | ||
| + | |||
| + | [[Image:MRA_graph_GBM_ZNF238.png]] | ||
Revision as of 14:33, 26 November 2012
Contents
FET method details
Description
Two choices are available in how to apply the FET method.
- One FET run - a single run of FET is used to determine enrichment of the signature markers in the hub's regulon.
- Two FET runs - The data is divided into two subsets based on
- positive or negative differential expression of targets, and also into two orthogonal subsets based on
- positive or negative Spearman's Correlation of the expression of the targets across all arrays (not just those used in the test of differential expression) as compared to the hub markers.
TF Activity Modes
Using the notation (differential expression result, Spearman's correlation result) for the intersection of differential expression (+ or -) and correlation (+ or -) results, the following two sets are formed and FET is run for each:
- Test 1 (plus mode): (+,+) union (-,-).
- Test 2 (minus mode): (+,-) union (-,+).
Whichever of the two tests gives the more significant p-value is used as the final p-value and the mode is called as "plus" or "minus" correspondingly. The mode is displayed in the MRA results viewer.
Simplified Interpretation of Modes
- Plus mode - the expression profile of the TF is positively correlated with those of regulon markers showing positive differential expression in the "case" set. The TF is more active in the "case" state.
- Minus mode - the expression profile of the TF is positively correlated with those of regulon markers showing negative differential expression in the "case" set. The TF is more active in the "control" state.
MRA-FET (local service)Parameters
Master Regulators
A set of candidate master regulator markers.
- This set must be loaded into the Markers component before running MRA. The set can be created directly there, or read in from a file.
Signature Markers
A set of markers comprising the signature that distinguishes the chosen phenotype from others.
- This set must be loaded into the Markers component before running MRA. The signature can be generated directly, e.g. through a t-test, or loaded from a file.
FET Runs
- One (Enrichment Only)
- Two (Enrichment plus mode of activity) - the target markers are divided into two groups and two runs of FET are performed. See the description above at FET method details.
Multiple Testing Correction
- No Correction
- Standard Bonferroni
T-test for differential expression
In the Arrays component, a case and a control group must be defined for running a t-test.
A "bar-code" graphic is generated using a t-test of differential expression. However, all t-values are accepted (critical alpha = 1) and used to order the bars representing the regulon markers.
All that is required is to define sets of arrays representing two phenotypes of interest (and distinguished by the signature). At least two sets of arrays must be activated, and at least one marked as "case", representing the target phenotype of the gene signature. "Control" is the default classification. See also the Differential Expression tutorial).
Viewing MRA analysis results (FET Method)
Following the successful completion of the MRA FET computation, a result node (MRA) appears in the Project Folder area of the geWorkbench interface, under the microarray experiment node. Hovering the cursor over the MRA result node will show the number of master regulators found.
The results of the analysis can be visualized in the MRA Viewer component by selecting the result node.
MRA Results Viewer
The MRA viewer is structured in 3 distinct areas.
(In the figures below, the data is sorted on the "genes in intersection set column").
Note - if no significant MRs are found, an empty result node is returned to the Project Folders component. The MRA viewer will appear but be empty.
Summary Listing
First Row of Controls
- Symbol - display the markers using their gene symbol (if available)
- Probeset - display markers using their marker (probeset) name.
- Results for top ... - Restrict the "bar graph" to at most the specified number of entries.
- Bar height ... - set the height of the veritcal lines in the bar graph in pixels.
- Bars for
- Regulon - draw bars for each marker in the hub marker's regulon
- Intersection set - draw bars for only those markers in the hub's regulon that are also present in the list of signature markers.
Second Row of Controls
Export Table
This command will export the entire master regulator results table to a file. It exports the same information shown on screen, sorted in the same way if the table has been sorted on one of the columns. The user can choose to export the table in CSV (.csv) or tab-delimited text format (.txt).
The following columns are exported:
- Master Regulator
- FET P-Value
- Genes in regulon (count)
- Genes in intersection set (count)
Export all targets
This command writes a file to disk containing each MR in the table, along with each MRs targets and the (value) for each target.
The master regulators and their markers in the intersection set (intersection of each MRs regulon and the signature genes) are exported, along with the T-test value calculated for display of the regulon. Each master regulator is listed on a line, followed by its intersection set markers with their t-test t values. Each MR is separated by a blank line from the preceeding section. The order in the file is not changed by sorting the results table prior to export.
Export File format:
marker, gene name, t-value
Example:
220462_at, CSRNP3
200660_at, S100A11, 12.541623
201474_s_at, ITGA3, 7.4126143
202910_s_at, CD97, 10.785
....
202614_at, SLC30A9
160020_at, MMP14, 4.415267
200808_s_at, ZYX, 9.006654
200859_x_at, FLNA, 8.309419
....
Exported files automatically receive a ".csv" file name extension.
Add Targets to Set
Create a new marker set in the Markers component containing the intersection set for the selected master regulator. The set is named after the master regulator.
Mode
This set of radio buttons controls which mode results to display in the bar graph, if the two-FET method for MRA was used (See above section FET method details).
- Both - display results with both plus and minus modes.
- Plus (+) - display only "plus" mode results.
- Minus (-) - display only "minus" mode results.
Table Column Headers
At upper left in the MRA viewer. For each candidate master regulator found to have a significant effect using Fisher's Exact test, the following four columns are displayed:
- Master Regulator - This is either the master regulator gene name or the marker/probeset name identifying the corresponding array feature (depending on the selection of the radio buttons “Symbol” and “Probe set”).
- FET p-value - the p-value from Fisher’s exact test. The test utilizes a 2x2 contingency table where rows classify markers as belonging to the signature set or not, while columns indicate if a marker belongs to the regulon of the master regulator or not. Counts are computed using all markers found in the input experiment data. (Fischer's exact test includes p-values for more-extreme tables).
- Genes in Regulon - the number of markers (genes) found to be first neighbors of the master regulator in the loaded network - its regulon.
- Genes in Intersection Set - The number of markers found in the intersection of the signature and the regulon of the candidate MR.
- Mode - Only used if MRA was run with the two-FET option. See the above section FET method details.
The contents of the table can be ordered by any column, by clicking on the column name. Sorting by the number of genes in the intersection set may give list with the more biologically interesting hits on top. As each regulon is of different size, the p-values are not directly comparable.
Clicking on the radio button for any of the master regulators will display the list of intersection genes in a table to the right (Detailed Listing), and will draw the regulon bar graph below.
Detailed Listing
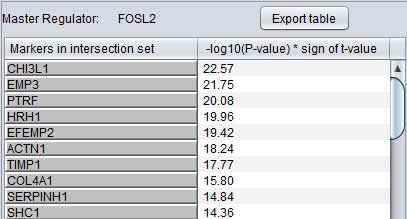
The detailed list shows the genes/markers contained in the intersection set of the MR regulon and the signature.
The genes are displayed in a table with the following columns:
- Genes in intersection set: the names of the genes in the intersection set. Either the gene name or the marker/probe set name is used (based on the choice of "Symbol" or "Probe Set" radio buttons).
- -log10(p-value) * sign (t-value): A modified test statistic combining the -log10(p-value) with the sign of the t-value. The sign of the t-value indicates positive or negative differential expression.
Export Table
This command will export to a file on disk the contents of the detailed target results table.
The file can be written in either tab-delimited (.txt) or CSV (.csv) format.
The columns exported are:
- Genes in intersection set
- -log10(P-value) * sign of t-value
Bar Graph View
Description
The bar graph is created based on ranked differential expression results for all markers in the dataset. However, only markers in the TF's regulon or intersection set (depending on the setting chosen) are drawn as vertical bars, allowing their positions in the entire set of markers to be visualized.
The value used to calculate the differential expression display is -log10(p-value) * sign (t-value), as in the detailed table display described above.
- Vertical bars - The vertical bars correspond to ranked positions of the markers belonging to each TF's regulon or intersection set (depending on the setting chosen).
- Bar position on horizontal axis - bars for displayed markers are positioned using their rank in a list of all markers ordered by (-log10(p-value) * sign (t-value)), calculated using a t-test for differential expression.
- Bar Color - The color of each bar indicates the sign of the Spearman's Correlation between the expression profile of the TF and its targets (calculated using data from all microarrays in the experiment, not just those in the case and control sets):
- Red means that the two markers are positively correlated (r >= 0) while
- Blue means that correlation is negative (r < 0).
- Gradient - The red-blue gradient at the bottom of the graph qualitatively represents the ranking between the lowest (blue) and the highest (red) test statistic. The white area in the middle represents the middle of the ranking (not necessarily zero differential expression).
Detailed Examples
Detail for FOSL2:
The bar graph shown above, for FOSL2, indicates that the expression profile of FOSL2 is positively correlated with its regulon targets having postive differential expression in the "case", mesenchymal phenotype. FOSL2 is more active in the mesenchymal than in the proneural phenotype.
Detail for ZNF238:
The bar graph shown above, for ZNF238, indicates that expression profile of ZNF238 is positively correlated with its regulon targets having positive differential expression in the control, proneural phenotype. ZNF238 is less active in the mesenchymal phenotype and more active in the proneural phenotype.
Save Image
Via a right-click menu on the bar graph, the user can save an image of the displayed bar graph to
- the Project as an image snapshot, or
- directly to a file on disk. Available formats are PNG, JPEG, TIF and BMP.
Graph View (prior to 2.4.0)
The bar code view in geWorkbench 2.3.0 and some prior versions was similar to that described above but positioned the bars based directly on t-value rather than on the ranking in all markers. The right and left extremes represented the largest negative and positive t-values seen among all results, not just for the depicted TF.
The results below were calculated using the same data as depicted in the above figures for the current graph method.
FOSL2:
ZNF238:

