MRA-FET
|
Home | Quick Start | Basics | Menu Bar | Preferences | Component Configuration Manager | Workspace | Information Panel | Local Data Files | File Formats | caArray | Array Sets | Marker Sets | Microarray Dataset Viewers | Filtering | Normalization | Tutorial Data | geWorkbench-web Tutorials |
Analysis Framework | ANOVA | ARACNe | BLAST | Cellular Networks KnowledgeBase | CeRNA/Hermes Query | Classification (KNN, WV) | Color Mosaic | Consensus Clustering | Cytoscape | Cupid | DeMAND | Expression Value Distribution | Fold-Change | Gene Ontology Term Analysis | Gene Ontology Viewer | GenomeSpace | genSpace | Grid Services | GSEA | Hierarchical Clustering | IDEA | Jmol | K-Means Clustering | LINCS Query | Marker Annotations | MarkUs | Master Regulator Analysis | (MRA-FET Method) | (MRA-MARINa Method) | MatrixREDUCE | MINDy | Pattern Discovery | PCA | Promoter Analysis | Pudge | SAM | Sequence Retriever | SkyBase | SkyLine | SOM | SVM | T-Test | Viper Analysis | Volcano Plot |
Contents
Overview
This chapter details the Fisher's Exact Test method of Master Regulator Analysis. Please see the Master Regulator Analysis chapter for a higher-level introduction.
Special note - MRA-FET does not use activated marker sets. Please see the note below.
FET method details
Description
Two choices are available in how to apply the FET method. For either method, a one-sided FET is used. It evaluates the right side (enrichment).
Note - The MRA-FET component runs its own t-test, even though the user supplies a list of signature markers (typically those that show significant differential expression in a t-test). It does this for two reasons - first, it needs t-statistic results for all markers to draw its bar-code graphic. Second, it uses the positive or negative t-statistic for each signature marker when setting up the two-run FET calculation described below, if chosen.
One FET run
A single run of FET is used to determine enrichment of the signature markers in the hub's regulon.
Two FET runs
This method allows the differential activity of each TF to be examined. A TF may show differential activity, as seen in the expression of its targets, even if the TF itself is not differentially expressed.
Division of data into sets
The data is sliced using two different methods, each of which in turn produces two subsets.
- (1) The first method is based on differential expression, producing sets for positive or negative differential expression of targets;
- (2) The second method uses the Spearman's correlation between each TF and each of its target markers (its regulon genes). Two sets are formed based on positive or negative Spearman's Correlation of the expression of the targets across all arrays (not just those used in the test of differential expression) as compared to the TF hub markers.
Determination of Activity Mode
Using the notation (differential expression result, Spearman's correlation result) for the intersection of differential expression (+ or -) and correlation (+ or -) results, the following two sets are formed and FET is run for each:
- Test 1 (plus mode): (+,+) union (-,-).
- Test 2 (minus mode): (+,-) union (-,+).
Whichever of the two tests gives the more significant p-value is used as the final p-value and the mode is called as "plus" or "minus" correspondingly. The mode is displayed in the MRA results viewer.
Simplified Interpretation of Modes
- Plus mode - the expression profile of the TF is positively correlated with those of regulon markers showing positive differential expression in the "case" set. The TF is more active in the "case" state.
- Minus mode - the expression profile of the TF is positively correlated with those of regulon markers showing negative differential expression in the "case" set. The TF is more active in the "control" state.
Inputs
MRA-FET Main Tab
These inputs are described in detail in the chapter Master Regulator Analysis.
- Network - the network (e.g. from ARACNe) upon which MRA will operate.
- If the network is loaded into MRA as gene symbols or Entrez IDs, it will be transformed (expanded) to include all probesets annotated to each such gene if an annotation file has been loaded for the expression dataset.
- FET P-Value: The enrichment score p-value below which a regulon is considered enriched in differentially expressed genes.
FET Parameters tab
Master Regulators
A set of candidate master regulator markers.
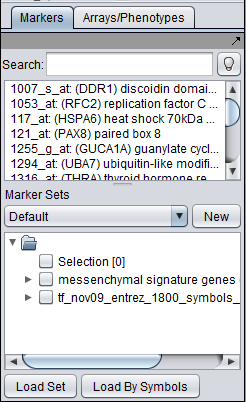
- This set must be loaded into the Markers component before running MRA. The set can be created directly there, or read in from a file.
Signature Markers
A set of markers comprising the signature that distinguishes the chosen phenotype from others.
- This set must be loaded into the Markers component before running MRA. The signature can be generated directly, e.g. through a t-test, or loaded from a file.
FET Runs
- One (Enrichment Only)
- Two (Enrichment plus mode of activity) - the target markers are divided into two groups and two runs of FET are performed. See the description above at FET method details.
Multiple Testing Correction
- No Correction
- Standard Bonferroni
T-test for differential expression
In the Arrays component, a case and a control group must be defined for running a t-test.
A "bar-code" graphic is generated using a t-test of differential expression. However, all t-values are accepted (critical alpha = 1) and used to order the bars representing the regulon markers.
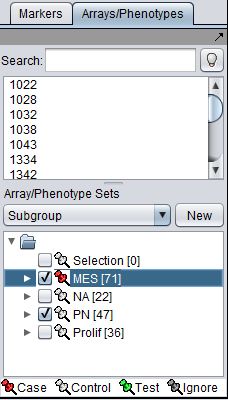
All that is required is to define sets of arrays representing two phenotypes of interest (and distinguished by the signature). At least two sets of arrays must be activated, and at least one marked as "case", representing the target phenotype of the gene signature. "Control" is the default classification. See also the Differential Expression tutorial).
Viewing MRA analysis results (FET Method)
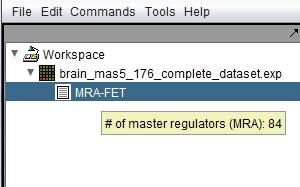
Following the successful completion of the MRA FET computation, a result node (MRA) appears in the Workspace, under the microarray experiment node. Hovering the cursor over the MRA result node will show the number of master regulators found.
The results of the analysis can be visualized in the MRA Viewer component by selecting the result node.
MRA Results Viewer
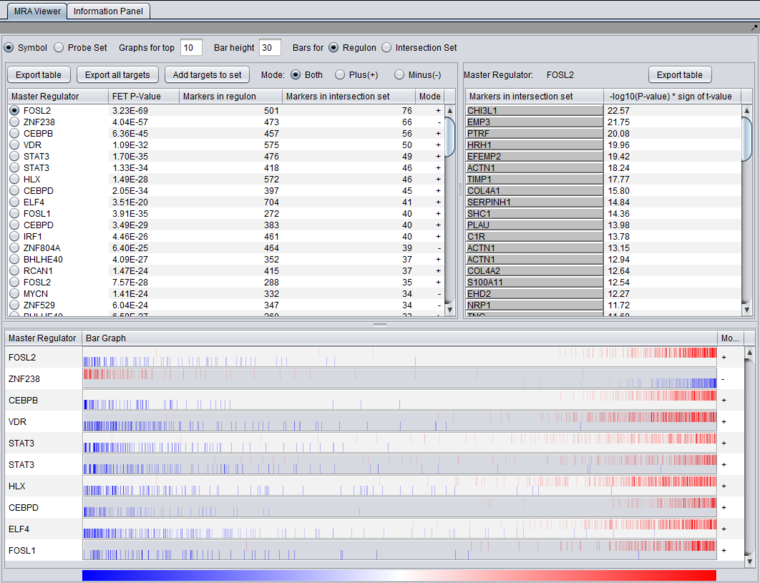
The MRA viewer is structured in 3 distinct areas.
(In the figures below, the data is sorted on the "genes in intersection set column").
Note - if no significant MRs are found, an empty result node is returned to the Workspace. The MRA viewer will appear but be empty.
Summary Listing
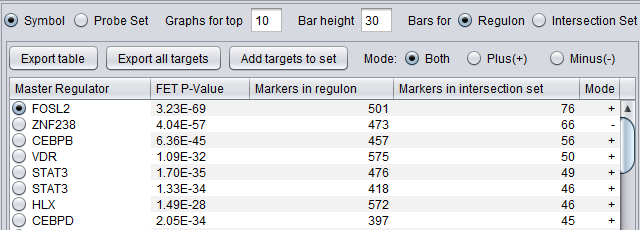
First Row of Controls
- Symbol - display the markers using their gene symbol (if available)
- Probeset - display markers using their marker (probeset) name.
- Results for top ... - Restrict the "bar graph" to at most the specified number of entries.
- Bar height ... - set the height of the veritcal lines in the bar graph in pixels.
- Bars for
- Regulon - draw bars for each marker in the hub marker's regulon
- Intersection set - draw bars for only those markers in the hub's regulon that are also present in the list of signature markers.
Second Row of Controls
Export Table
This command will export the entire master regulator results table to a file. It exports the same information shown on screen, sorted in the same way if the table has been sorted on one of the columns. The user can choose to export the table in CSV (.csv) or tab-delimited text format (.txt).
The following columns are exported:
- Master Regulator
- FET P-Value
- Genes in regulon (count)
- Genes in intersection set (count)
Export all targets
This command writes a file to disk containing each MR in the table, along with each MRs targets and the (value) for each target.
The master regulators and their markers in the intersection set (intersection of each MRs regulon and the signature genes) are exported, along with the T-test value calculated for display of the regulon. Each master regulator is listed on a line, followed by its intersection set markers with their t-test t values. Each MR is separated by a blank line from the preceeding section. The order in the file is not changed by sorting the results table prior to export.
Export File format:
marker, gene name, t-value
Example:
220462_at, CSRNP3
200660_at, S100A11, 12.541623
201474_s_at, ITGA3, 7.4126143
202910_s_at, CD97, 10.785
....
202614_at, SLC30A9
160020_at, MMP14, 4.415267
200808_s_at, ZYX, 9.006654
200859_x_at, FLNA, 8.309419
....
Exported files automatically receive a ".csv" file name extension.
Add Targets to Set
Create a new marker set in the Markers component containing the intersection set for the selected master regulator. The set is named after the master regulator.
Mode
This set of radio buttons controls which mode results to display in the bar graph, if the two-FET method for MRA was used (See above section FET method details).
- Both - display results with both plus and minus modes.
- Plus (+) - display only "plus" mode results.
- Minus (-) - display only "minus" mode results.
Table Column Headers
At upper left in the MRA viewer. For each candidate master regulator found to have a significant effect using Fisher's Exact test, the following four columns are displayed:
- Master Regulator - This is either the master regulator gene name or the marker/probeset name identifying the corresponding array feature (depending on the selection of the radio buttons “Symbol” and “Probe set”).
- FET p-value - the p-value from Fisher’s exact test. The test utilizes a 2x2 contingency table where rows classify markers as belonging to the signature set or not, while columns indicate if a marker belongs to the regulon of the master regulator or not. Counts are computed using all markers found in the input experiment data. (Fischer's exact test includes p-values for more-extreme tables).
- Genes in Regulon - the number of markers (genes) found to be first neighbors of the master regulator in the loaded network - its regulon.
- Genes in Intersection Set - The number of markers found in the intersection of the signature and the regulon of the candidate MR.
- Mode - Only used if MRA was run with the two-FET option. See the above section FET method details.
The contents of the table can be ordered by any column, by clicking on the column name. Sorting by the number of genes in the intersection set may give list with the more biologically interesting hits on top. As each regulon is of different size, the p-values are not directly comparable.
Clicking on the radio button for any of the master regulators will display the list of intersection genes in a table to the right (Detailed Listing), and will draw the regulon bar graph below.
Detailed Listing
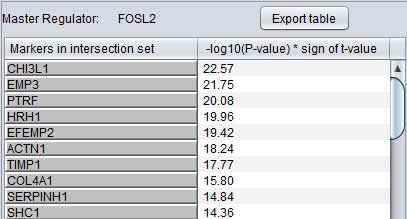
The detailed list shows the genes/markers contained in the intersection set of the MR regulon and the signature.
The genes are displayed in a table with the following columns:
- Genes in intersection set: the names of the genes in the intersection set. Either the gene name or the marker/probe set name is used (based on the choice of "Symbol" or "Probe Set" radio buttons).
- -log10(p-value) * sign (t-value): A modified test statistic combining the -log10(p-value) with the sign of the t-value. The sign of the t-value indicates positive or negative differential expression.
Export Table
This command will export to a file on disk the contents of the detailed target results table.
The file can be written in either tab-delimited (.txt) or CSV (.csv) format.
The columns exported are:
- Markers in intersection set
- -log10(P-value) * sign of t-value
Bar Graph View
Description
The bar graph is created based on ranked differential expression results for all markers in the dataset. However, only markers in the TF's regulon or intersection set (depending on the setting chosen) are drawn as vertical bars, allowing their positions in the entire set of markers to be visualized.
The value used to calculate the differential expression display is -log10(p-value) * sign (t-value), as in the detailed table display described above.
- Vertical bars - The vertical bars correspond to ranked positions of the markers belonging to each TF's regulon or intersection set (depending on the setting chosen).
- Bar position on horizontal axis - bars for displayed markers are positioned using their rank in a list of all markers ordered by (-log10(p-value) * sign (t-value)), calculated using a t-test for differential expression.
- Bar Color - The color of each bar indicates the sign of the Spearman's Correlation between the expression profile of the TF and its targets (calculated using data from all microarrays in the experiment, not just those in the case and control sets):
- Red means that the two markers are positively correlated (r >= 0) while
- Blue means that correlation is negative (r < 0).
- The color intensity of each bar is scaled to represent the number of overlapping bars at any given point in the graph.
- Gradient - The red-blue gradient at the bottom of the graph qualitatively represents the ranking between the lowest (blue) and the highest (red) test statistic. The white area in the middle represents the middle of the ranking (not necessarily zero differential expression). This gradient does not represent the colors used for the bars themselves, only the relative position in the ranked differential expression results.
Detailed Examples
Detail for FOSL2:
The bar graph shown above, for FOSL2, indicates that the positive regulon of FOSL2 is up-regulated in the "case" mesenchymal phenotype, whereas the negative regulon is down-regulated. FOSL2 is activated in the "case", mesenchymal phenotype.
Detail for ZNF238:
The bar graph shown above, for ZNF238, indicates that the positive regulon of ZNF238 is down-regulated in the "case" mesenchymal phenotype, whereas the negative regulon is up-regulated. ZNF238 activity is repressed in the "case", mesenchymal phenotype.
Save Image
Via a right-click menu on the bar graph, the user can save an image of the displayed bar graph to
- the Workspace as an image snapshot, or
- directly to a file on disk. Available formats are PNG, JPEG, TIF and BMP.
Graph View (prior to 2.4.0)
The bar code view in geWorkbench 2.3.0 and some prior versions was similar to that described above but positioned the bars based directly on t-value rather than on the ranking in all markers. The right and left extremes represented the largest negative and positive t-values seen among all results, not just for the depicted TF.
Example of running MRA (FET Method)
This example uses a dataset comprised of 176 microarrays described in Phillips (2006). The analysis follows that described in Carro et al. (2010) for master regulators of Glioblastoma.
Loading and preparing the example data
Microarray dataset
- Load a microarray dataset. (See Local Data Files).
- Normalize as desired. In this example, the data was log2 transformed.
- When prompted, load the annotation file.
Marker sets
Load marker sets for:
- the list of candidate master regulators
- the signature genes.
Note on Marker Sets
geWorkbench provides a mechanism to restrict some analyses to using certain sets of markers by "activating" these sets in the Markers component. However, the MRA-FET analysis component uses named marker sets directly, and does not support use of activated marker sets.
As of geWorkbench 2.6.0, MRA-FET will warn the user if a marker set is activated, and will not run the analysis. In prior versions, please do not run MRA-FET with activated marker sets, as unexpected results may occur.
Array sets
Array sets are shown defined for the three phenotypic classes of arrays in the dataset: Mesenchymal (MES), Proneural (PN), and Proliferative (Prolif).
- MES and PN are "activated" for use in the t-test by checking the boxes next their names.
- The MES set is classifed as "Case". Right click on the thumbtack adjacent to the set name.
Setting up the parameters and starting MRA
In the Workspace, right-click on the expression dataset and select "MRA-FET Analysis".
In the "Main" parameters tab,
- Load Network - load the network, either directly from a file, or choose a network that has been loaded into the Workspace.
- P-value - The p-value for the FET may be set as desired.
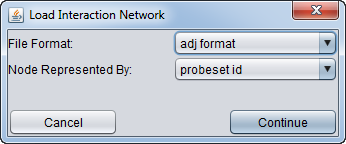
If the network is loaded from a file, you will see the following dialog.
Set the network file format (ADJ or SIF) and type of symbol used in the file to represent the gene nodes (e.g. marker id, gene symbol, Entrez ID).
The figure below shows the Main parameters tab after a network has been loaded from the Workspace:
or from a file
In the "FET" parameters tab, select the signature and master regulator marker sets, and set the FET Runs and Multiple Testing Correction choices.
- Master regulators - select the desired set from those loaded in the Markers component.
- Signature markers - select the desired set from those loaded in the Markers component.
- FET Runs - set
- Multiple Testing Correction - set
- Click on the Analyze button.
- As previously noted, you may wish to sort the result table by the number of genes in the intersection set rather than by p-value, as this may give a more biologically relevant list.
Results
Upon completion of the analysis, an MRA results node is placed in the Workspace. The analysis results can be browsed using the MRA viewer and are as shown above in the MRA Results Viewer section.
References
- Basso K, Margolin AA, Stolovitzky G, Klein U, Dalla-Favera R, Califano A (2005). Reverse engineering of regulatory networks in human B cells. Nat Genet 37(4):382-390 (link to paper).
- Carro MS, Lim WK, Alvarez MJ, Bollo RJ, Zhao X, Snyder EY, Sulman EP, Anne SL, Doetsch F, Colman H, Lasorella A, Aldape K, Califano A, Iavarone A (2010) The transcriptional network for mesenchymal transformation of brain tumors. Nature 463(7279):318-25.
- Lefebvre C, Rajbhandari P, Alvarez MJ, Bandaru P, Lim WK, Sato M, Wang K, Sumazin P, Kustagi M, Bisikirska BC, Basso K, Beltrao P, Krogan N, Gautier J, Dalla-Favera R, Califano A (2010) A human B-cell interactome identifies MYB and FOXM1 as master regulators of proliferation in germinal centers. Mol Syst Biol. 6:377. PMID: 20531406 (link to paper).
- Lim WK, Lyashenko E, Califano A: Master regulators used as breast cancer metastasis classifier. Pac Symp Biocomput. 2009:504-15 (link to paper).
- Phillips HS, Kharbanda S, Chen R, Forrest WF, Soriano RH, Wu TD, Misra A, Nigro JM, Colman H, Soroceanu L, Williams PM, Modrusan Z, Feuerstein BG, Aldape K (2006) Molecular subclasses of high-grade glioma predict prognosis, delineate a pattern of disease progression, and resemble stages in neurogenesis. Cancer Cell 9(3):157-73.


