GeWorkbench-web/Hierarchical Clustering
|
Home | Overview | Set View | File Formats | Desktop Tutorials |
ANOVA | ARACNe | Cellular Networks KnowledgeBase | Gene Ontology | Hierarchical Clustering | MarkUs | msViper | T-Test |
Overview
Hierarchical clustering is a method to group arrays and/or markers together based on similarity of their expression profiles.
geWorkbench implements its own code for agglomerative hierarchical clustering. Starting from individual points (the leaves of the tree), nearest neighbors are found for individual points, and then for groups of points, at each step building up a branched structure that converges toward a root that contains all points. The resulting graph tends to group similar items together.
Results of hierarchical clustering are displayed in the Dendrogram Viewer, which is further described below.
Prerequisites
Dataset
A microarray expression dataset must already be loaded in the Workspace. If an annotation file is also loaded corresponding to the microarray type, then gene names will be used in the results display in addition to marker (probeset) names.
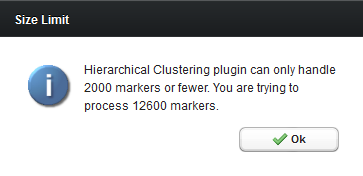
Note on maximum number of items to be clustered - hierarchical clustering is memory intensive. Clustering more than about 2000 items on an axis is not recommended. If more than 2000 markers are selected for clustering, a pop-up warning will appear.
Parameters
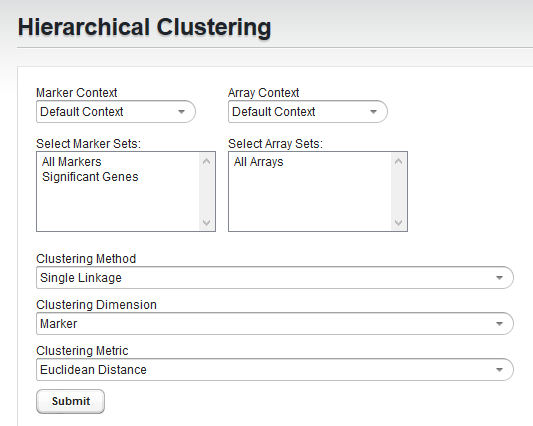
Marker and Array Set Selection
To limit the clustering analysis to a subset of all markers and/or arrays, you can select one or more sets of markers or arrays that have already been created.
- First, choose the marker or array context, if an alternate context has been created and you wish to use it. Otherwise, use the default context.
- Second, choose the desired marker and or array sets to which to limit the analysis.
Clustering Method
This parameter is used to indicate the convention used for determining cluster-to-cluster distances when constructing the hierarchical tree. Available options are:
- Single Linkage - The distances are measured between each member of one cluster each member of the other cluster. The minimum of these distances is considered the cluster-to-cluster distance. This method often leads to a "chaining" effect and is usually not recommended.
- Average Linkage - The average distance of each member of one cluster to each member of the other cluster is used as a measure of cluster-to-cluster distance.
- Total Linkage - The distances are measured between each member of one cluster each member of the other cluster. The maximum of these distances is considered the cluster-to-cluster distance.
Clustering Dimension
These are used to indicate whether to cluster markers, microarrays, or both.
- Marker - Cluster the selected markers (genes) based on the similarity across microarrays.
- Microarray - Cluster the selected microarrays based on the similarity across markers.
- Both - Cluster both markers and microarrays.
Clustering Metric
The values being clustered, whether markers or microarrays, can each be represented by vectors of numbers, essentially either rows (markers) or columns (microarrays) taken from a spreadsheet view of all expression values. Several methods by which to calculate the distance between any two vectors are offered:
- Euclidean - The direct, point-to-point distance is calculated (square root of the sum of square differences).
- Pearson's - Pearson's correlation coefficient for two vectors is calculated.
- Spearman's - Spearman's rank correlation coefficient for two vectors is calculated.
Submit
Click to start the analysis.
Example Run
This example clusters a dataset after selecting a subset of markers using an ANOVA analysis.
It starts with the same analysis described in the ANOVA_web tutorial to produce a marker set "Significant Genes".
Loading Data
This example uses the microarray data file Bcell-100_log2.exp, which is the Bcell data described in the Tutorial Data section, and which has been further normalized as follows:
- Threshold Normalization - set a minimum value of 1.0 for each data point, followed by
- Log2 transformation
Briefly, this dataset is composed of 100 Affymetrix HG-U95Av2 arrays on which various B-cell lines, both normal and cancerous, were analyzed. Thus it explores a potentially wide variety of expression phenotypes.
- Download and unzip the Bcell-100 data file.
- Load the Bcell-100_log2.exp dataset into geWorkbench as type "Expression File (.exp)".
- Load/associate the Affymetrix HG-U95Av2 annotation file if desired. A copy is preloaded into geWorkbench-web and can be associated with the data file during the upload process.
Select Markers with ANOVA
Follow the steps at ANOVA_web#Setting_Parameters to create the marker set "Significant Genes" using ANOVA.
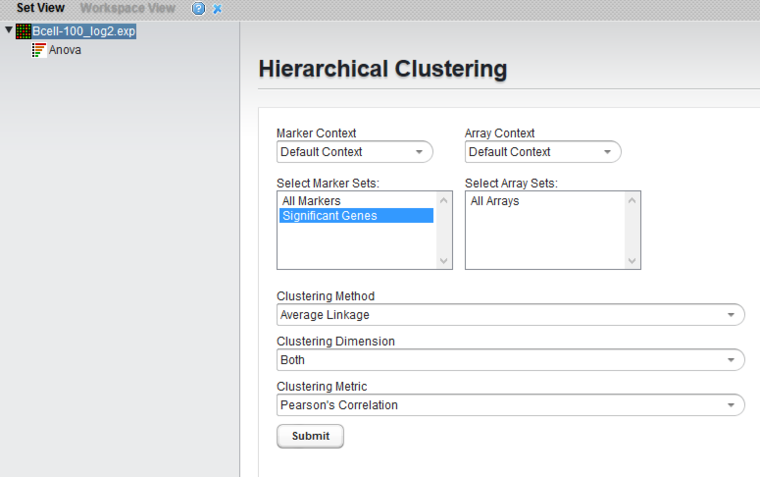
Set Hierarchical Clustering Parameters and Run
- Clustering methods: Average Linkage
- Clustering Dimension: Both
- Clustering Metric: Pearson's Correlation
- Click Submit
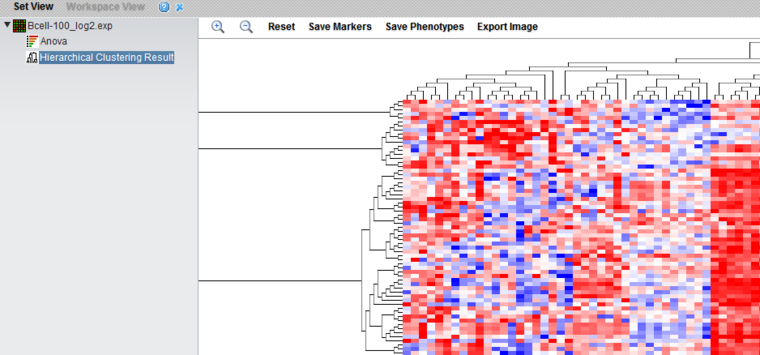
The result node "Hierarchical Clustering Result" is placed in the Workspace. The result is displayed in the Dendrogram Viewer.
The Dendrogram Viewer
Hierarchical clustering results are displayed in the Dendrogram Viewer.
Color Key
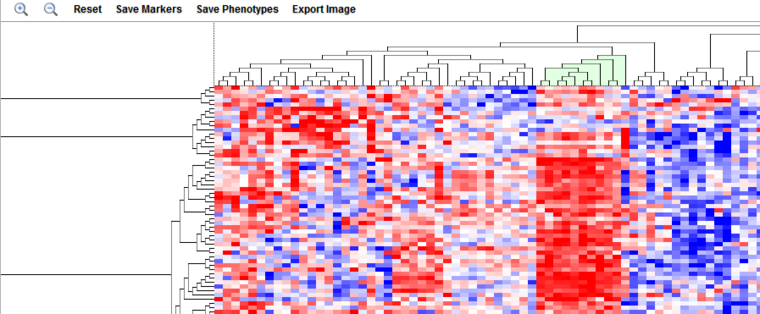
The dendrogram uses a relative color display, with red shades representing over-expression relative to the row mean and blue shades under-expression relative to the row mean, and white representing the mean. Expression value colors are directly comparable only within a particular row (marker).
Controls and Actions
Subtree Selection
A subtree of the dendrogram can be selected interactively using the mouse. Clicking on root of the desired subtree will highlight it in light green.
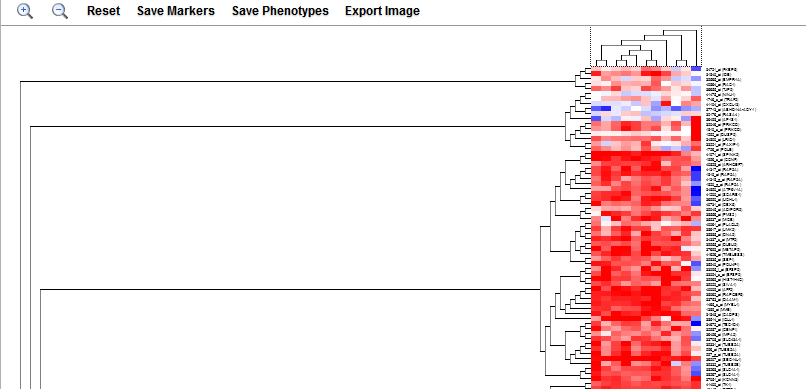
Clicking in the highlighted area will reduce the display to only the selected subtree.
Save Markers/Save Phenotypes
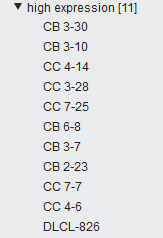
The menu items "Save Markers" and "Save Phenotypes" will save all currently displayed markers or arrays to a new set. You will be prompted to enter a set name. If a subtree of the dendrogram has been selected, only those markers or arrays being displayed will be saved to the set.
Plus and Minus
The "plus" and "minus" signs in magnifying glass icons zoom in and out, respectively. The default display is zoomed fully out.
Reset
Undo any changes to the dendrogram and return to the original display.
Export Image
A copy of the full dendrogram can be saved to a file. Although too large to be displayed in this page, it can be viewed by clicking on this link: HC_web_example_dendrogram_full.png
