Difference between revisions of "GeWorkbench-web/Cellular Networks KnowledgeBase"
(→Cytoscape Display of Network) |
|||
| (8 intermediate revisions by the same user not shown) | |||
| Line 1: | Line 1: | ||
| − | {{ | + | {{Template:GeWorkbench-webTutorialsTopNav}} |
=Overview= | =Overview= | ||
| Line 29: | Line 29: | ||
| − | A query against the CNKB database is initiated by clicking on the "Submit" button. All pairwise interactions in the chosen interactome/version that involve any marker in the "Selected Marker Sets" are retrieved. | + | A query against the CNKB database is initiated by clicking on the "Submit" button. All pairwise interactions in the chosen interactome/version that involve any marker in the "Selected Marker Sets" are retrieved. |
==Details== | ==Details== | ||
| Line 70: | Line 70: | ||
Selecting the CNKB result node displays the results in the CNKB Viewer. | Selecting the CNKB result node displays the results in the CNKB Viewer. | ||
| − | |||
=The CNKB Results Viewer= | =The CNKB Results Viewer= | ||
| Line 76: | Line 75: | ||
The query results for the two genes are shown below. The threshold has been increased from 0.0 to 0.7 to show the detail of the lines more clearly. Increasing the threshold decreases the number of hits displayed in each cell of the tabular listing - only hits at or above the threshold value are displayed. | The query results for the two genes are shown below. The threshold has been increased from 0.0 to 0.7 to show the detail of the lines more clearly. Increasing the threshold decreases the number of hits displayed in each cell of the tabular listing - only hits at or above the threshold value are displayed. | ||
| − | [[Image:CNKB_web_throttle_0.7.png]] | + | [[Image:CNKB_web_throttle_0.7.png|{{ImageMaxWidth}}]] |
| Line 105: | Line 104: | ||
The number of interactions can be adjusted by changing the threshold using the throttle graph slider control or typing a new value into the threshold text field. | The number of interactions can be adjusted by changing the threshold using the throttle graph slider control or typing a new value into the threshold text field. | ||
| − | |||
==Throttle Graph== | ==Throttle Graph== | ||
| Line 116: | Line 114: | ||
Here, the cutoff has been increased to a value of 0.90, and the cursor hovered at the point 0.91, with hover text showing the count of interactions remaining beyond that point. As the cursor is moved further to the right, the number of interactions remaining will decrease. | Here, the cutoff has been increased to a value of 0.90, and the cursor hovered at the point 0.91, with hover text showing the count of interactions remaining beyond that point. As the cursor is moved further to the right, the number of interactions remaining will decrease. | ||
| − | [[Image:CNKB_web_throttle_0.9_hover.png]] | + | [[Image:CNKB_web_throttle_0.9_hover.png|{{ImageMaxWidth}}]] |
==Controls== | ==Controls== | ||
| Line 128: | Line 126: | ||
===Export=== | ===Export=== | ||
The tabular data is exported to an Excel format (.xls) file in the same format as it is displayed. | The tabular data is exported to an Excel format (.xls) file in the same format as it is displayed. | ||
| − | |||
=Cytoscape Display of Network= | =Cytoscape Display of Network= | ||
Latest revision as of 12:58, 27 April 2015
|
Home | Overview | Set View | File Formats | Desktop Tutorials |
ANOVA | ARACNe | Cellular Networks KnowledgeBase | Gene Ontology | Hierarchical Clustering | MarkUs | msViper | T-Test |
Contents
Overview
The Cellular Network Knowledge Base (CNKB) is a repository of molecular interactions, including ones both computationally and experimentally derived. Sources for interactions include both publicly available databases such as BIND, MINT, and Reactome, as well as reverse-engineered cellular context-specific regulatory interactomes developed in the lab of Dr. Andrea Califano at Columbia University.
Each pairwise interaction may have an associated likelihood indicator (a value between 0 and 1) or another dataset-specific metric reflecting the strength of the underlying data, whether experimental or computational. Details on the methodology used to construct the CNKB are available in Mani et al. 2008.
Gene interaction information from the CNKB can be used, for example, in order to assess the plausibility of a hypothesis of concerted molecular action represented by a gene set that has been discovered using computational approaches (e.g., by running a clustering analysis on a microarray set to identify tandems of co-expressed genes). If the genes in such a set are reported in the CNKB to have several direct interactions (or several common targets) then this may be evidence that the gene set indeed reflects at some level a real biological process.
The CNKB component in geWorkbench-web allows the user to select one or marker sets on which to query, plus an interactome and version. Results are placed in a new data node of type "CNKB" under the parent microarray dataset. Selecting the "CNKB" data node will display the query results in tabular and graphical form. The threshold value for including retrieved interactions in a generated network or export file can be adjusted using the threshold slider in the "throttle graph". Finally, small networks can be displayed in Cytoscape, or the network can be exported to a file.
Data Sources
Please see the CNKB data page for a list of currently available data sources and types of interactions.
Prerequisites
- A microarray dataset must be loaded and selected.
- Both queries against the CNKB database, and display of gene annotation information require that an annotation file be associated with the microarray dataset at the time that it is loaded. See Local Data Files and File Formats for further information.
The CNKB Query Interface
Usage
The CNKB component appears in the list of available microarray data analysis modules when a dataset of that type has been selected in the Workspace.
A query against the CNKB database is initiated by clicking on the "Submit" button. All pairwise interactions in the chosen interactome/version that involve any marker in the "Selected Marker Sets" are retrieved.
Details
Marker Context
If additional marker set contexts have been created to hold various sets of markers, the desired context can be selected here.
Select Marker Sets
Choose one or more marker sets with which to query the CNKB.
Select Interactome
This list shows all interactomes available in the CNKB. The number of interactions present in each is shown in parentheses after the name. See also the CNKB data sources page.
When an interactome is highlighted, its description will be presented below the list.
Select Version
This list shows available versions of an interactome.
When an interactome version is highlighted, its description will be presented below the list.
Some versions of an interactome may not yet be public. If so, the version description should note that the data is unreleased. Pre-release data is password protected and not yet available for public use.
Example Query
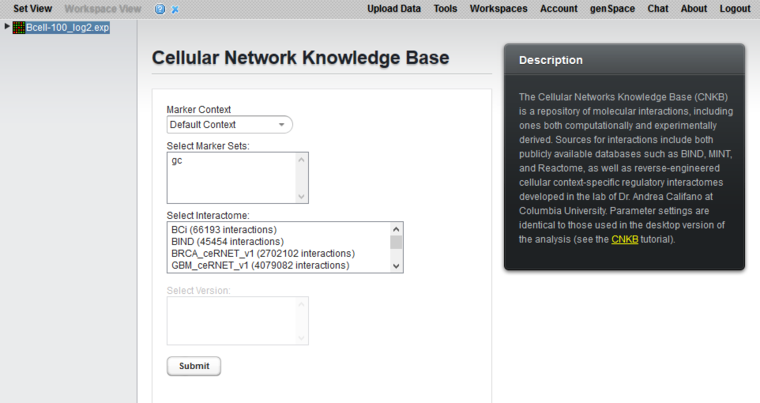
- Load the Bcell-100 example dataset. Here we are using the Log2 normalized version.
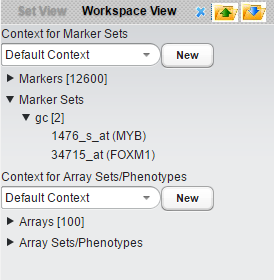
- Create a marker set containing two genes, MYB1 and FOXM1. These two genes were identified as B-cell master regulators of proliferation in germinal centers (Lefevre et al., 2010). Here we have labeled the new marker set "gc".
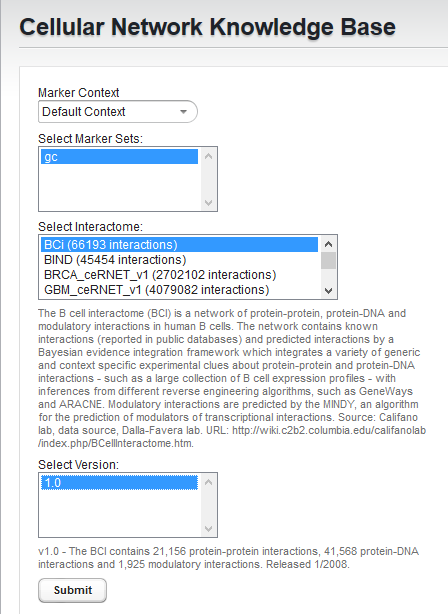
- Select the "gc" marker set.
- Select the "BCi" Bcell interactome.
- Select version 1.0 of the BCi.
- Hit "Submit"
The query results are place in a new "CNKB" node in the Workspace.
Selecting the CNKB result node displays the results in the CNKB Viewer.
The CNKB Results Viewer
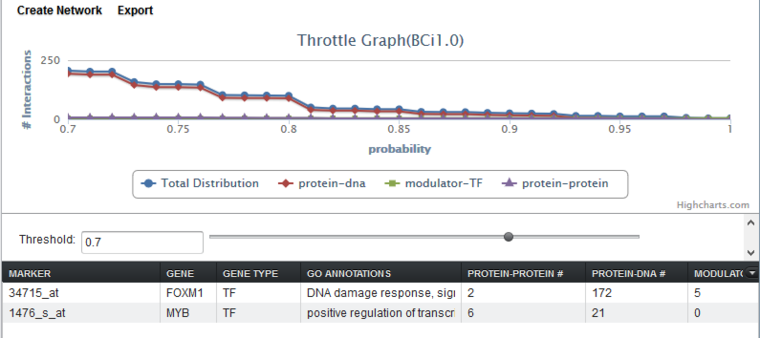
The query results for the two genes are shown below. The threshold has been increased from 0.0 to 0.7 to show the detail of the lines more clearly. Increasing the threshold decreases the number of hits displayed in each cell of the tabular listing - only hits at or above the threshold value are displayed.
Tabular Display
The tabular display has columns for marker, gene, gene type, GO annotations, and for each interaction type present in the result. Common interaction types in CNKB data include protein-protein, protein-dna, and modulator-transcription factor.
Marker
The marker (probeset) name.
Gene
The gene name corresponding to the marker, from the array annotation file.
Gene Type
A gene type designation, derived from the gene's GO annotation, from the array annotation file:
- TF - Transcription Factor,
- K - Kinase,
- P - Phosphatase, and
- (no entry) - type is unknown.
GO Annotation
The Gene Ontology (GO) annotation for the gene, keyed off of GO terms for each marker found in the microarray annotation file. The term descriptions originate in a copy of the gene ontology file "go-basic.obo" downloaded to the geWorkbench-web server. The column displays the Biological Process annotations, however, there may be many more annotations than can be displayed in the available space. Hovering the mouse cursor over the field will display the remaining entries.
Interaction Type Result columns
A separate column will appear in the Selected Markers display for each interaction type represented in the query results. The numbers in the columns indicate, for each marker, the number of interactions returned by the query.
The number of interactions can be adjusted by changing the threshold using the throttle graph slider control or typing a new value into the threshold text field.
Throttle Graph
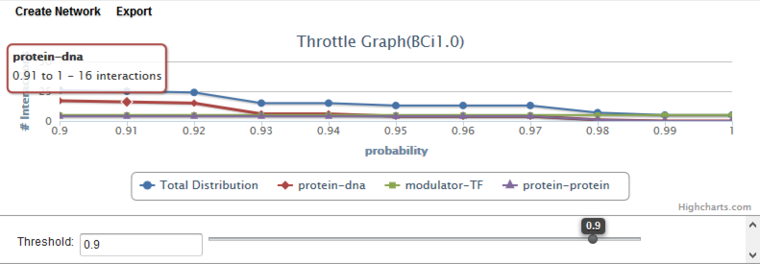
This interactive graph allows users to "throttle" which interactions to work with, using as a criterion the interactions’ likelihood indicator. As the required threshold of likelihood of the interactions is increased, the number of interactions meeting this criterion decreases, as displayed in the query results columns (e.g "Protein-DNA") of the Selected Markers list.
The graph shows a result with three interaction types. A fourth line ("Total Distribution") depicts the sum of those three.
Here, the cutoff has been increased to a value of 0.90, and the cursor hovered at the point 0.91, with hover text showing the count of interactions remaining beyond that point. As the cursor is moved further to the right, the number of interactions remaining will decrease.
Controls
Create Network
Create a network based on the query results, and as filtered by the throttle graph threshold setting. The new network is placed in the Workspace in the form of an adjacency matrix at the gene level. The network will be displayed in the Cytoscape viewer.
- Note on network size - If the network created is larger than it may be possible to display in Cytoscape, Cytoscape will offer the user the option of a tabular display instead.
Export
The tabular data is exported to an Excel format (.xls) file in the same format as it is displayed.
Cytoscape Display of Network
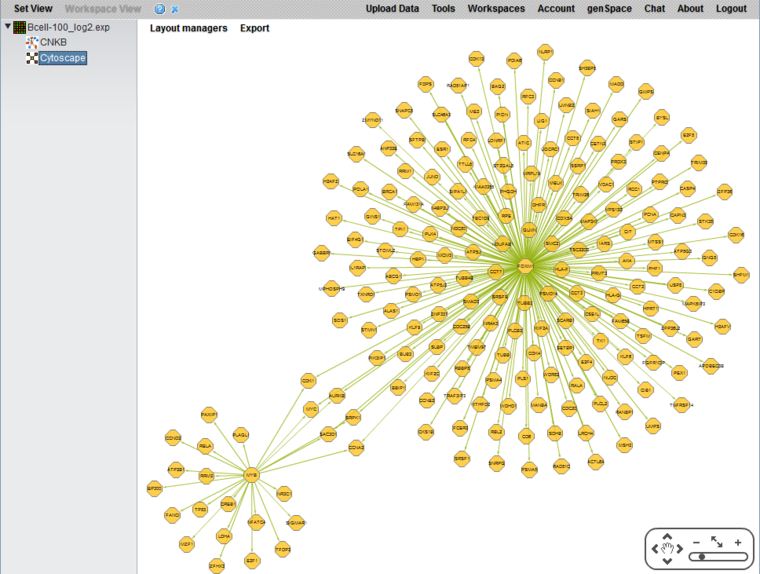
A Flash version of Cytoscape is used to display the network.
Controls
Layout managers
Several different layout managers are available to draw the network in different styles.
Export
The network will be exported to a file as an adjacency matrix using gene symbols.
Technical Note
For some ids used in the CNKB database, there may a matching marker which however does not have a gene symbol. In the Affymetrix annotation file, these are indicated with a gene symbol of "---". These results are included in the CNKB results table.
