Array Sets
Contents
Overview of Marker and Array Sets
The Markers/Arrays component, located at lower left in the geWorkbench graphical interface, allows the user to define and use sets of arrays and markers for a number of purposes.
As used in geWorkbench, the term "marker" includes genes, probes/probesets, and individual sequences, depending on the type of data loaded. Sets of markers can be returned by various analysis routines. For example, the t-test returns a list of markers showing significant differential expression, and after hierarchical clustering, the markers in a subtree of the resulting dendrogram can be saved to a list.
Sets of microarrays can be used to group arrays in a meaningful fashion for statistical analysis. For example, two such phenotypes might be the diseased and normal states of a tissue from which samples have been taken. geWorkbench uses the terms "Case" and "Control" to categorize these, but in biological setting the equivalent would be "Experimental" vs "Control".
This chapter discusses the use of sets of microarrays. Please see the chapter Marker_Sets for a discussion of the use of Marker sets.
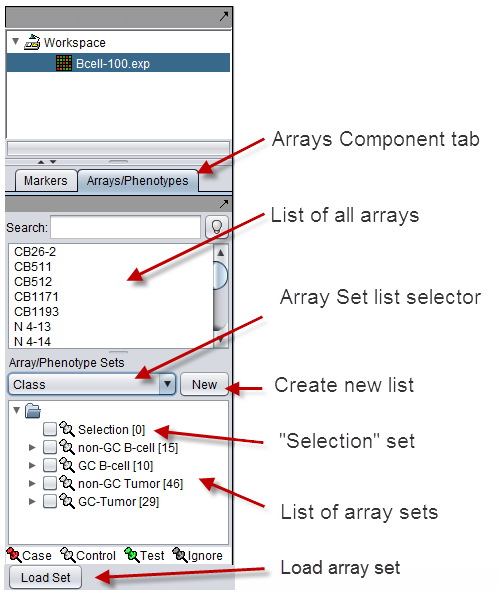
The figure below shows the Arrays/Phenotypes component located below the Workspace in geWorkbench. The Markers component is located in the same space, under the adjacent tab.
Common Principles of Operation of Marker and Array Sets
Rather than using all arrays or all markers in a data set for a particular analysis or visualization, the user may wish to restrict those used to only some subset.
Activating Sets of Markers and Arrays
In the Markers and the Arrays components, sets of markers and arrays can be defined by the user. Such sets are also created as the outcome of various analysis methods. Adjacent to each set in the graphical interface is a checkbox. Checking this box activates the subset.
- Activating a set restricts many geWorkbench components to using as input only the markers or arrays that are in one or more such activated sets.
- Marker Sets
- If no marker set is active, all markers are used.
- If at least one marker set is activated, affected components will only use markers that are in activated sets.
- Array Sets
- If no Array set is active, all Arrays are used.
- If at least one Array set is activated, affected components will only use arrays that are in activated sets.
- Selection set - this is a special, default set. One is present in both the Markers component and the Arrays component. The "Selection" set has the following properties:
- Double-clicking on a marker or array entry in the upper pane list will add that entry to the default "Selection" set. Double-clicking the same entry again will remove it from the default set.
- The "Selection" set cannot be deleted.
Number of members displayed
The number of members in a set is given inside square brackets just to the right of the set name.
Upper Pane Controls
The list in upper pane of the Arrays component shows the arrays loaded in the current data set.
The upper pane of the Arrays/Phenotypes component has the following controls:
Search
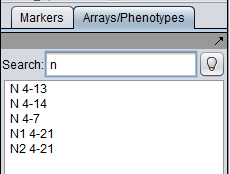
Search for arrays by typing an array name or portion of a name into the search box. As each character is typed, the list is dynamically updated to contain only names containing matches to the query so far. The match can occur anywhere in the name.
For example, here "n" has been entered, and only the five arrays containing "N" in their name are displayed. The search is case-insensitive.
Light Bulb icon
![]() - when activated
- when activated ![]() , enables "hover text" display of array names in this component.
, enables "hover text" display of array names in this component.
Double-click action
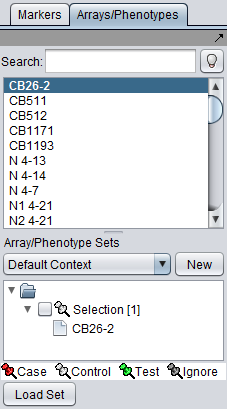
- Double-clicking with the mouse on an array name will add that array to the default "Selection" set.
- Double-clicking on the same entry again will remove it from the "Selection" set.
- More generally, for any array in the "Selection" set, double-clicking on its entry in the upper list will remove it from the set.
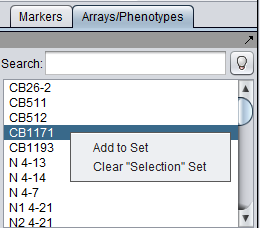
Selecting one or more arrays in the list and then right-clicking gives the following choices in a pop-up menu:
Add to Set
Selected arrays can be added to a new or to an existing set.
A shortcut for adding arrays to an existing set is covered in the next section.
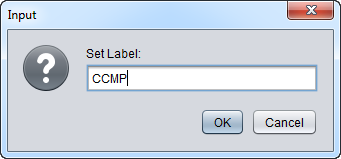
When "Add to Set" is clicked, a dialog box will appear asking for the name of the set. Enter the name of a new or existing set.
As an example, we show adding arrays to two sets based on their phenotype.
(In this example we will start with the same data files that were used in an example in the Local Data Files tutorial. Load the ten individual MAS5 data files as shown there in the section "Loading microarray data files - local". Be sure to check the "merge" option).
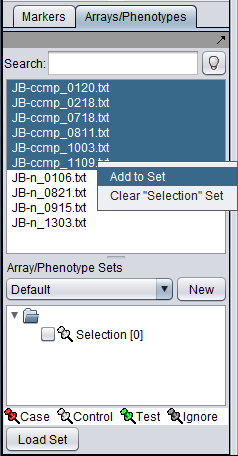
First, we select and label arrays which contain samples from the congestive cardiomyopathy disease state:
1. In the Arrays/Phenotypes component, select the six arrays beginning with JB-ccmp, which represent the samples from the congestive cardiomyopathy disease state.
2. Right-click, select Add to Set. In the dialog box, you can enter the name of either an existing set, or of a new set to be created.
3. Enter the new subset name "CCMP" in the input box and click OK.
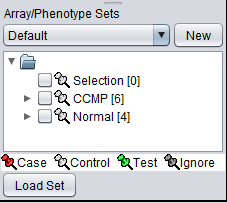
4. Next, add the arrays beginning with JB-n to a new set with name "Normal" ( repeat steps 2 & 3 ):
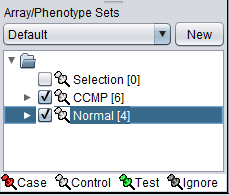
The Array/Phenotype Sets component will now show the two sets added. Note that the number of arrays in each set is shown in square brackets to the right of the set name.
Add to Set (Existing)
You can add arrays to an existing set by either
- entering the name of the existing set in the popup dialog box, or
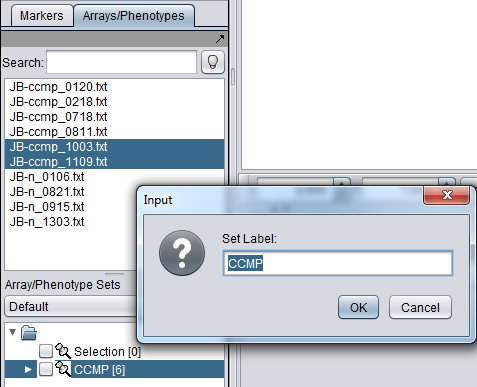
- before right-clicking on the selected arrays, first highlight the desired array set in the lower list. Its name will then be pre-entered into the Add to Set dialog.
Clear Selection
Clear the contents of the default "Selection" array set.
Lower Pane Controls
The lower pane of the Arrays/Phenotypes component has the following controls:
Array/Phenotype Sets (Context)
- Pulldown menu - A list of array set contexts. Each context can contain different sets of arrays. All components will make use of the currently selected context. If an analysis returns an array set as a result, it is returned to the current array set context. Different contexts can be used to organize arrays at different levels of detail, or different types of analyses.
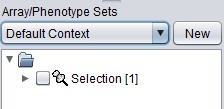
- New - This button will create a new, empty array set context.
- Note - The Affymetrix Matrix File microarray data file format, native to geWorkbench, supports multiple such contexts of array sets being defined and saved.
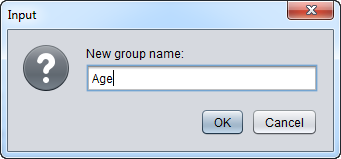
A popup will ask for a name for the new context:
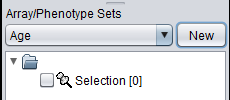
The new context will appear in the menu, with only the default "Selection" set as a member.
Load Set
The Load Set button will bring up a dialog to load a file containing a list of arrays to a new set. The file should have one array name per line in the first column. The format of the file is Comma Separated Values.
Sets are loaded into the currently visible list in the Arrays component. A new list can be created with the "New" button.
If the file contains only one column, the new set is given the same name as the file it was read-in from.
The second column, if there is one, is used to represent Array Set names. Thus one file can contain arrays that will be read in to different sets, depending on the names in the second column. This can be convenient to import array names and phenotypes from a spreadsheet file.
If the file contains this second column, then sets will be created using these names.
Any further columns after the second will be ignored.
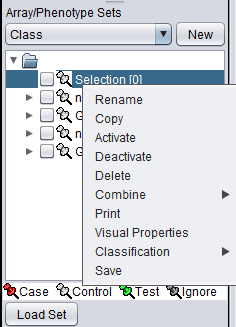
If you right-click on a set, a menu with the following choices appears:
Rename
Rename the selected set.
Copy
Make a copy of the selected set.
Activate
Activate the selected set (see explanation above). This will set the check-box in front of the set name to checked.
Activating a set can also be done directly by checking the check box before its name.
Deactivate
Deactivate the selected set (see explanation above). Deactivating a set can also be done directly by unchecking the check box before its name.
Delete
Delete the selected set.
Combine
Combine the selected sets into a new set. Methods are:
- Union - Include all arrays that appear in one or more of the selected sets.
- Intersection - Include only arrays that are present in each of the selected sets.
- XOR - Include arrays that are present in one and only one of the selected sets. Note that this usage differs from the logic gate XOR function.
Print the names of the arrays contained in the selected set(s) to a printer.
Visual Properties
Change the color and shape of points representing arrays in graphical components, e.g. in the Scatter Plot.
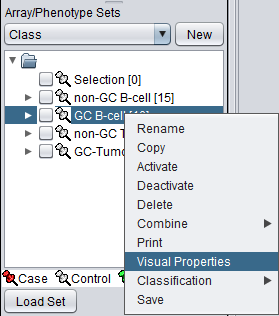
Selecting the "Visual Properties" menu item, here selected for the array set "GC B cell",
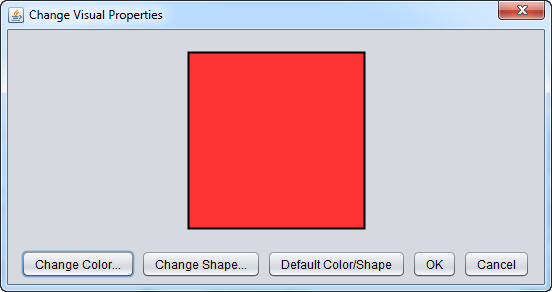
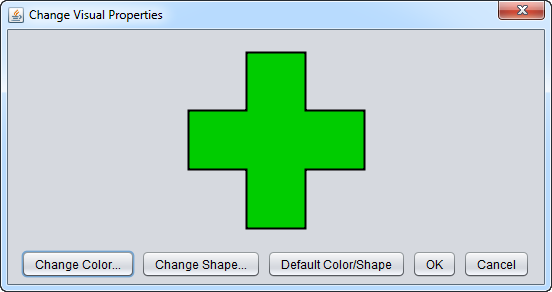
causes a properties editor to appear. In it, the shape and color of points representing arrays in various geWorkbench graphical components can be globally altered.
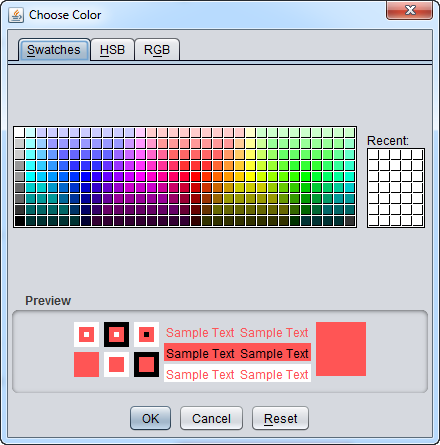
The color chooser:
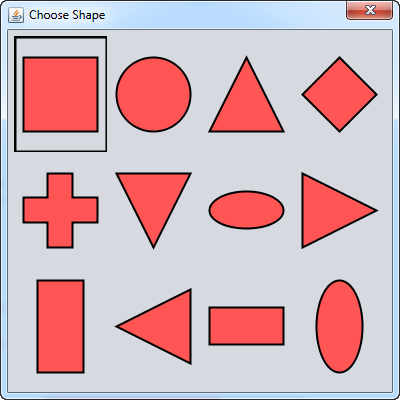
The shape chooser:
Chooser showing selection of a green "plus" shape to represent the array set.
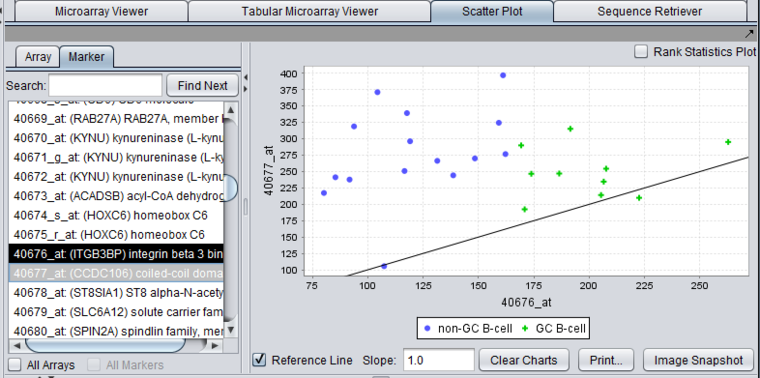
After the visual properties of the "GC B-cell" set have been altered, we can view their appearance in, for example, the Scatter Plot component. Here we have activated both the "GC B-cell" set and the "non-GC B-cell" set. The former now uses the green plus signs, whereas the later uses a system assigned default color and shape.
Classification
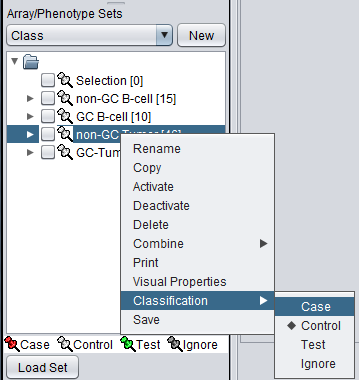
For statistical tests such as the t-test, sets can be classified using several preset labels, e.g. "Case" and "Control".
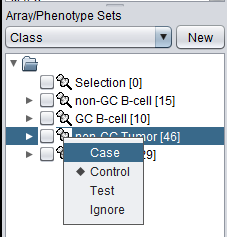
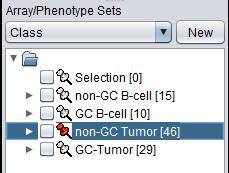
The color of the thumbtack icon in front of a set name indicates the sets classification. The color scheme is shown at the bottom of the Arrays component, and is repeated in the following list.
The full list of classifications is:
- Case - (Red) used in analyses such as t-test to differentiate the experimental group from the control group.
- Control - (No color) the default classification.
- Test - (Green) used by the validation step of several classification algorithms, such as KNN (Broad).
- Ignore - (Gray)
A classification can be made directly by left-clicking on the "thumbtack" icon in front of a set's name. The list of available classifications will be offered.
In the figure below, a red thumbtack indicates the arrays have been specified as "Case".
The set classification can also be reached from a right-click menu on the set you wish to classify.
Save
Save the chosen set of arrays as a simple list (CSV format, one array per line) to a file on disk.
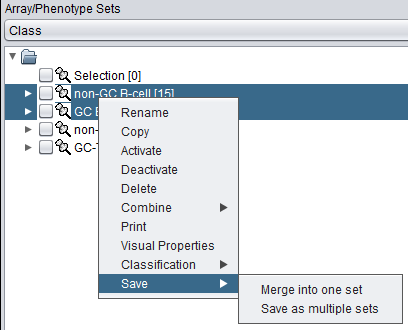
If more than one array set is highlighted, two choices are offered:
- Merge into one set - The arrays in all highlighted sets are merged into a single list and written out to a file. A file browser window appears that allows the user to specify the location and name of the new file.
- Save as multiple sets - Each highlighted array set will be saved to a separate file, using the set name as the new file name. A file browser will appear which will allow the user to specify where to save the new files.
Removing an array from a set
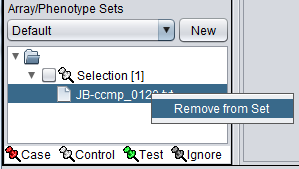
One or more arrays can be removed from a set by highlighting them and then right-clicking. A menu will appear with option "Remove from Set".
Working with multiple lists of array sets
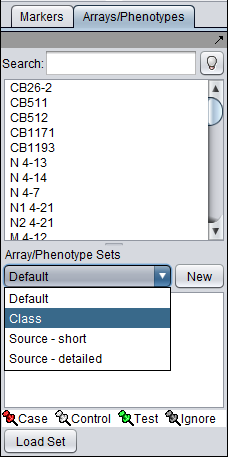
There can be different groupings of the same arrays in the Arrays/Phenotypes components. The example data file "BCell-100.exp" predefines 3 such lists of sets. After loading this file of type "Affymetrix File Matrix" into geWorkbench, the following lists of sets can be seen in the Arrays/Phenotypes group pulldown menu.
- Default
- Class
- Source - short
- Source - detailed
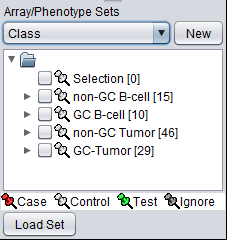
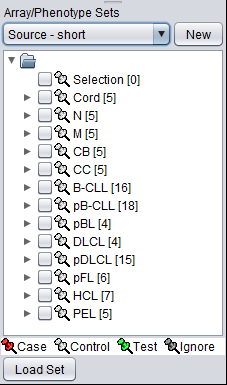
Each such list can contain a different arrangement of the arrays into subsets.
If we choose the list called "Class", the following sets of arrays are displayed:
If instead we choose the list "Source - short", a different division into subsets of the same arrays is seen:
