Normalization
|
Home | Quick Start | Basics | Menu Bar | Preferences | Component Configuration Manager | Workspace | Information Panel | Local Data Files | File Formats | caArray | Array Sets | Marker Sets | Microarray Dataset Viewers | Filtering | Normalization | Tutorial Data | geWorkbench-web Tutorials |
Analysis Framework | ANOVA | ARACNe | BLAST | Cellular Networks KnowledgeBase | CeRNA/Hermes Query | Classification (KNN, WV) | Color Mosaic | Consensus Clustering | Cytoscape | Cupid | DeMAND | Expression Value Distribution | Fold-Change | Gene Ontology Term Analysis | Gene Ontology Viewer | GenomeSpace | genSpace | Grid Services | GSEA | Hierarchical Clustering | IDEA | Jmol | K-Means Clustering | LINCS Query | Marker Annotations | MarkUs | Master Regulator Analysis | (MRA-FET Method) | (MRA-MARINa Method) | MatrixREDUCE | MINDy | Pattern Discovery | PCA | Promoter Analysis | Pudge | SAM | Sequence Retriever | SkyBase | SkyLine | SOM | SVM | T-Test | Viper Analysis | Volcano Plot |
Contents
- 1 Overview
- 2 Normalizer Configuration
- 3 Available Normalizers
- 4 Basic Controls
- 5 Specific Controls for each Normalizer
Overview
Normalization is used to transform data in preparation for analysis. Many normalizers are oriented towards decreasing the effects of systematic differences across a set of microarrays, aiding in cross-microarray comparisons. A log transformation of the data can be used to improve its statistical distribution. geWorkbench offers a selection of pluggable normalization components (see list below).
All normalization operations directly alter the loaded data set and are not reversible. A separate copy of the data is not generated. Normalization operations do not respect any marker or array sets that may be activated; normalization always acts on the entire data set.
The Missing Value Computation normalizer can be used to replace missing values with imputed values. Note that some analysis routines also will optionally compute replacements for missing values if needed.
Data preparation methods such as RMA and GCRMA are not directly available in geWorkbench. Affymetrix CEL files can be processed externally to geWorkbench using a program such as RMAExpress or in R/Bioconductor and then the processed data imported into geWorkbench.
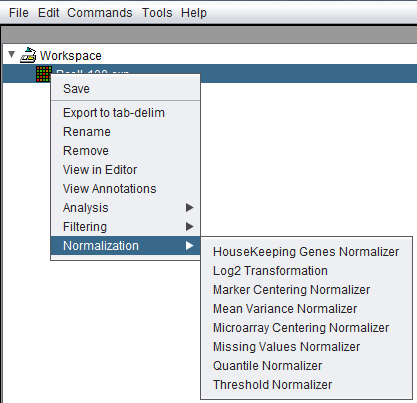
The Normalization dialogs can be reached in two ways, either directly from the Workspace by a right-click menu on a microarray dataset,
or through the top Menu Bar Commands->Normalization menu, which will bring up the same choices.
Normalizer Configuration
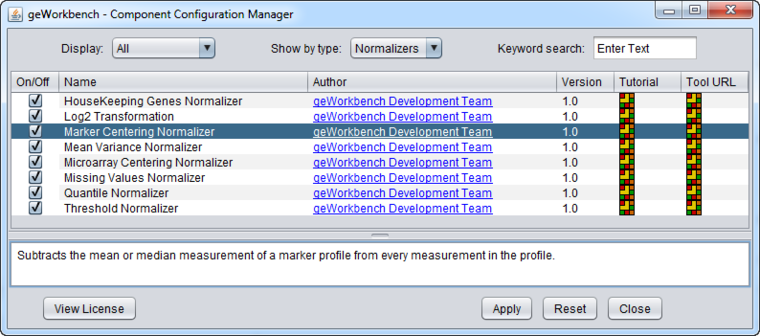
Some normalizers may not be loaded by default in geWorkbench. To configure which normalizers to load, use the Component Configuration Manager. It is available in the top menu-bar under Tools->Component Configuration.
Only normalizers that have been loaded in the Component Configuration Manager (CCM) will appear in the menus.
Available Normalizers
geWorkbench comes with the following normalization routines installed:
| Normalizer | Description | |
|---|---|---|
| Housekeeping Genes Normalizer | Normalize all values such that the averaged expression value of specified house-keeping markers is the same on each microarray. | |
| Log2 Transformation | Applies a log2 transformation to all measurements in a microarray. | |
| Marker Centering Normalizer | Subtracts the mean or median measurement of a marker profile from every measurement in the profile. | |
| Mean-Variance Normalizer | For every marker profile, the mean measurement of the entire profile is subtracted from each measurement in the profile and the resulting value is divided by the standard deviation. | |
| Microarray Centering Normalizer | Subtracts the mean or median measurement of a microarray from every measurement in that microarray. | |
| Missing Value Normalizer | Replaces every missing value with either the mean value of that marker across all microarrays or with the mean measurement of all markers in the microarray where the missing value is observed. | |
| Quantile Normalizer | Adjusts expression values so that the distribution of values is the same on each microarray, though which marker has which value varies. | |
| Threshold Normalizer | All data points whose value is less than (or greater than) a user-specified minimum (maximum) value are raised (reduced) to that minimum (maximum) value. |
Basic Controls
Overview
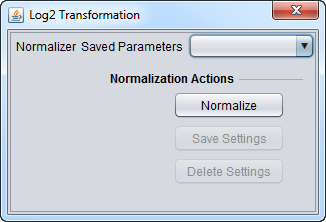
See any of the below normalizers for a depiction of these controls.
- Saved Parameters (menu) - Allows selection of stored parameter settings.
- Normalize (button)- Run the selected transformation.
- Save Settings - Save the current settings (see following section).
- Delete Settings- Delete the currently selected parameter set.
Saving Parameters
The current parameter settings can be saved to a named parameter set. The saved set will be displayed in the pull-down menu at upper right in the component. Any number of parameter sets can be saved. Selecting a saved parameter set will load its settings. If the currently set parameters match a saved set, that set's entry will be shown in the menu.
- Save Settings - Save the current settings to a new parameter set.
- Delete Settings - Delete the currently selected parameter set from the menu.
Specific Controls for each Normalizer
Housekeeping Genes Normalizer
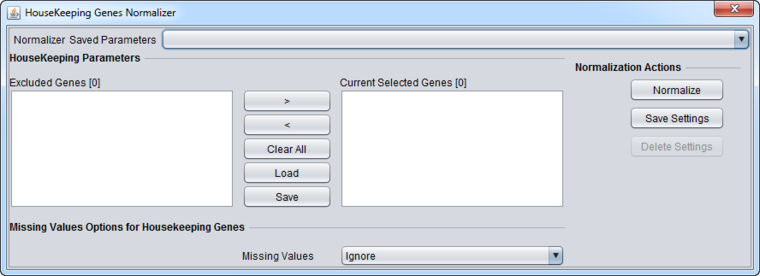
The Housekeeping Genes normalization method normalizes data using the expression values of selected housekeeping genes. In particular, for each microarray, the average expression of all markers corresponding to housekeeping genes is calculated and then all expression levels within the microarray are divided by that average. To specify the housekeeping gene markers, the user can load a CSV (comma separated values) file containing these markers. The loaded markers are displayed in the Current Selected Genes list box. Markers can be moved back and forth between this list and the list at left, Excluded Genes through use of the right and left arrow buttons (< >), or simply by double-clicking on a marker in either list. The current contents of the Current Selected Genes marker set can be saved as a CSV file for later re-use.
Controls
- <, > = Shift selected markers between lists. Double-clicking on a list item will also shift it to the opposite list.
- Clear All - Clear both lists.
- Load - Load a list of markers from a comma-separated value (CSV) format file. One marker per line is also an acceptable format (.csv suffix).
- Save - Save the list shown in the Current Selected Genes list to a file. The output file format is one marker per line (suffix .csv).
- Right-click menu - If one right-clicks on a marker in the Current Selected Genes list, a pop-up menu appears, offering two choices:
- Rename - Rename the marker in the list. Note that the marker name must match a marker in the currently loaded dataset.
- Delete - Delete a marker from the list.
Missing Value Options for Housekeeping Genes
- Ignore - Do not replace missing values.
- Microarray Average - Missing values are replaced for the housekeeping gene normalization with the average of all values on the microarray on which the missing value was found.
Selected Genes Not Available
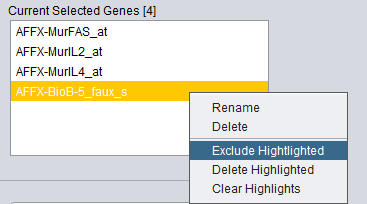
When you have attempted to normalize the data with genes that are not included in the data, the system generates a warning message and highlights the missing genes in yellow in the Current Selected Genes list box. A pop-up dialog box will offer the following choices:
- OK – Proceeds to normalize the data using only the markers that are present in the data set, disregarding the yellow-highlighted markers.
- Cancel – Cancels the normalization operation. The markers in the list which are not in the dataset will remain highlighted in yellow.
- Right-click menu options - Right-clicking on a highlighted marker will pop-up a menu with the following choices:
- Exclude Highlighted - Move the highlighted markers back to the Excluded Genes list on left.
- Delete Highlighted - Delete the highlighted markers from the list.
- Clear Highlights - Clear all highlights, leaving the list unchanged.
Log2 Transformation
Transforms the expression values in all microarrays in the current data set of taking the base 2 log of the data. The transformation is applied to all expression measurements in all microarrays in the currently loaded data set. The operation is applied only if all values in all microarrays are positive. If this is not the case, an error message appears indicating that the normalization could not be performed.
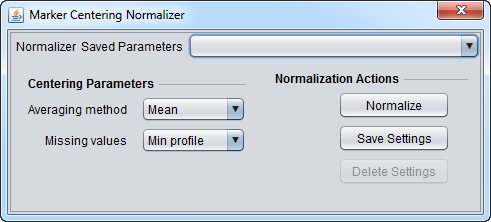
Marker Centering Normalizer
This component allows normalizing using a choice of the mean or median value for each marker profile across all arrays in the currently loaded data set. The calculated value for a given marker is subtracted from each measurement for that marker across all arrays.
Centering Parameters
- Averaging method - Designates if the mean or the median should be used for centering. Mean and median values are computed from the non-missing values within the profile.
- Mean - Use the mean value of each marker profile.
- Median - Use the median value of each marker profile.
- Missing values - Designates how to handle missing values in a marker profile. Available options are:
- Min profile: Missing values are replaced with the minimum (post-centering) profile value.
- Max profile: Missing values are replaced with the maximum (post-centering) profile value.
- Zero: Missing values are set to 0.
- Ignore: Missing values are left untouched.
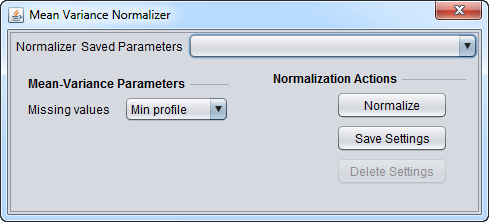
Mean-Variance Normalizer
For each marker profile, the mean measurement of the entire profile is subtracted from each measurement in the profile and the resulting value is divided by the profile's standard deviation.
Mean-Variance Parameters
- Missing values - Designates how to handle missing values in a marker profile. Available options are:
- Min profile: Missing values are replaced with the minimum (post-centering) profile value.
- Max profile: Missing values are replaced with the maximum (post-centering) profile value.
- Zero: Missing values are set to 0.
- Ignore: Missing values are left untouched.
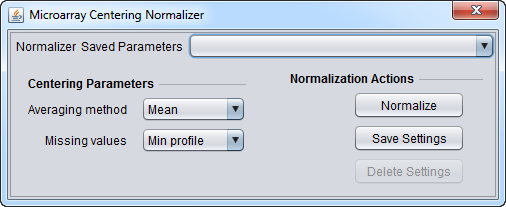
Microarray Centering Normalizer
Centering Parameters
- Averaging method - Designates if the mean or the median should be used for centering. Mean and median values are computed from the non-missing values within the profile.
- Mean - Use the mean value of each marker profile.
- Median - Use the median value of each marker profile.
- Missing values - Designates how to handle missing values in a marker profile. Available options are:
- Min profile: Missing values are replaced with the minimum (post-centering) profile value.
- Max profile: Missing values are replaced with the maximum (post-centering) profile value.
- Zero: Missing values are set to 0.
- Ignore: Missing values are left untouched.
Missing Values Normalizer
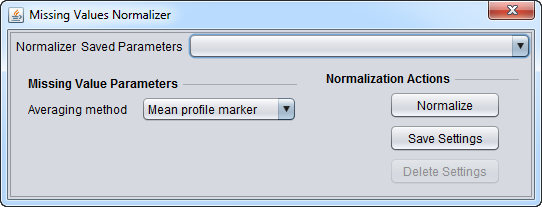
This normalizer replaces a missing measurement with a consensus value. This value is computed based upon the selection at the drop-down box titled "Averaging method".
Averaging method
- Mean profile marker - Replaces the missing measurement with the average value (across all microarrays) of its corresponding marker. The average is computed by taking into account only non-missing values.
- Mean microarray value - Replaces the missing measurement with the average value of its corresponding microarray. The average is computed by taking into account only non-missing values.
Quantile Normalizer
Quantile normalization adjusts the expression measurements in each microarray so that the expression value distribution is the same for all microarrays in the microarray set being normalized. This is a non-linear normalization method which is not dependent upon the choice of a reference or baseline array. A description of the underlying computations can be found in: Bolstad, B et al. (2003). In geWorkbench, the normalization is applied to the probeset level values (not the individual probe values).
Missing Values Averaging method
- Mean profile marker - Replaces the missing measurement with the average value (across all microarrays) of its corresponding marker. The average is computed by taking into account only non-missing values.
- Mean microarray value - Replaces the missing measurement with the average value of its corresponding microarray. The average is computed by taking into account only non-missing values.
References:
Bolstad BM, Irizarry RA, Astrand M, Speed TP (2003) A comparison of normalization methods for high density oligonucleotide array data based on variance and bias. Bioinformatics 19(2):185-93. (http://www.ncbi.nlm.nih.gov/pubmed/12538238)
Supplementary information: http://bmbolstad.com/misc/normalize/normalize.html.
Threshold Normalizer
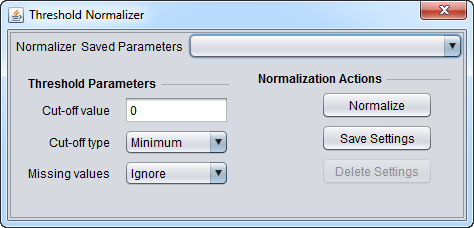
Allows a minimum or maximum value for the data to be set. If a minimum value is specified, any value less than that will be set to the given minimum value. If a maximum value is specified, any value greater than that will be set to the given maxium value.
Threshold Parameters
- Cut-off value - Enter a real-number value for the desired cut-off.
- Cut-off type
- Minimum - Any expression value less than the specified cut-off value is set equal to the cut-off value (floor).
- Maximum - Any expression value greater than the specified cut-off value is set equal to the cut-off value (ceiling).
- Missing values
- Ignore - Do not change missing values.
- Replace - Replace missing values with the specified cut-off value.
