LINCS Query
Contents
- 1 Overview
- 2 Currently Available Data
- 3 Prerequistes
- 4 LINCS Query and Display
- 5 Experimental and Computational: Search Controls in Common
- 6 Experimental vs Computational: Mode-Specific Search Controls
- 7 Query Controls
- 8 Results
- 9 Plot Options
- 10 Experimental Data Graphs
- 11 Functional Mode of Action (fMoA)
Overview
LINCS - Library of Integrated Network-based Cellular Signatures
This component provides for query and display of data generated by the Columbia LINCS Technology U01 and Computation U01 Centers. It provides experimental and computational results for drug mode of action and similarity calculations, and for synergy experiments.
Synergy Experiments - Using any of a variety of assays, drugs are tested in combination to determine if they have a greater effect together than the sum of their separate effects. The synergy experiments are being carried out at the Columbia High-Throughput Screening Facility.
Functional mode of action - The Functional Mode of Action (fMoA) of drugs is being calculated using the Viper program. Viper uses a cell-context (e.g. tissue) specific interaction network (interactome), reverse engineered from a large number of expression profiles using the ARACNe algorithm, and also individual expression profiles generated for each tested drug. The interaction network contains the list of target regulated genes (the regulon) for each transcription factor (TF) in the context of the tissue tested. Using the interaction network, Viper calculates the enrichment of the regulon of each TF in the list of differentially expressed genes produced for each drug. Thus the effect of each drug can be represented as the activity profile of its TFs, and this is termed the functional mode of action of the drug.
Similarity - The similarity between the fMoA profiles of each drug can be calculated, e.g. using GSEA. The similarity scores can be used as a basis to predict whether the two compared drugs will be synergistic in their action. The hypothesis initially being tested is that drugs that are most dissimilar will have a greater probability of acting synergistically.
Currently Available Data
This data is unpublished and released under terms of the draft LINCS data sharing and citation agreement, which is included with the LINCS Query component.
- Synergy - highest synergy value obtained for each pairwise titration
- LNCaP - 100x10
- MCF7 - 14x10 (preliminary)
- Similarity
- MCF7 - full results.
Prerequistes
The LINCS Query component runs within geWorkbench. Download and installation instructions for geWorkbench can be found at Download_and_Installation
LINCS Query and Display
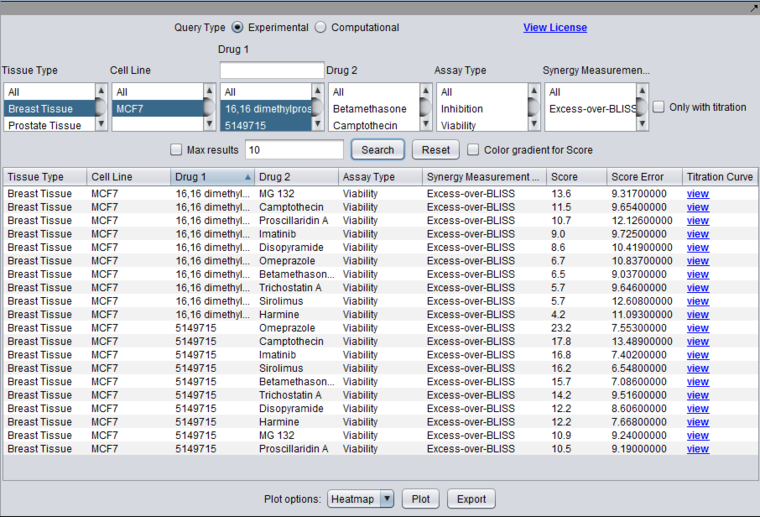
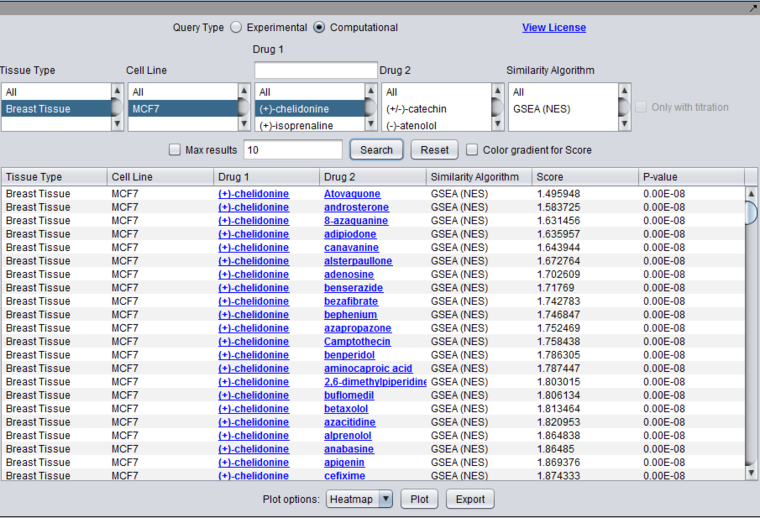
Query for experimental synergy results for tested drug pairs, or computational drug similarity results based on gene expression experiments. In the current experimental design, drug 1 and drug 2 are not symmetric; they are generally drawn from separate lists of compounds. This difference is preserved in the database.
For currently loaded experimental (synergy) data, drug 1 corresponds to a list of 100 "sensitizer" drugs chosen to maximally orthogonal to each other in their mode of action. Drug 2 corresponds to a set of 10 "effector" compounds of known mode of action.
Experimental and Computational: Search Controls in Common
- Tissue Type - The tissue from which the tested cell line was originally derived. More than one tissue can be chosen for a single query.
- Cell Line - The cell line tested in a particular experiment. More than one cell line can be chosen for a single query (multiple selection), subject to any constraint on "Tissue Type".
- Drug 1 - Entries stored as "drug 1" in a pair, subject to previous choices of tissue type or cell line, if any. One or more drugs (multiple selection) must be chosen. (For plotting a Heatmap, a multiple selection is counted as a free variable, as though no selection had been made).
- Drug 2 - Entries stored as "drug 2" in a pair, given current constraints on tissue type, cell line, and drug 1. More than one drug can be chosen for a single query (multiple selection). (For plotting a Heatmap, a multiple selection is counted as a free variable, as though no selection had been made).
- Dynamic Search on Drug 1 - currently the number of drugs in "Drug 1" can be considerably larger than in "Drug 2". For this reason, a dynamic search box is offered above the "Drug 1" selection. As each character is typed, the "Drug 1" list will be updated to only show matching drugs.
- The match is not case-sensitive.
- The match can occur anywhere in the drug name.
Experimental vs Computational: Mode-Specific Search Controls
Radio buttons are used to select whether to query for experimental or computational results. Only one type can be chosen at a time. These result types are held in separate tables in the database and the scores have different ranges.
The controls specific to each type are:
Experimental
- Assay Type (phenotypic readout): Viability, proliferation, apoptosis, cell morphology, oxidization state, etc.
- Synergy Measure (Excess over Bliss, Excess over highest single agent, Combination Index, etc.).
- Only with titrations (check box) - Restrict search results displayed in the lower spreadsheet to those for which titration curves are available.
Computational
- Similarity Algorithm (MARINa (GSEA-2), IDEA, DEMAND, combined, etc.). This entry will combine the algorithm used with the similarity method used, e.g. GSEA-2, in the case where an algorithm has more than one possible measure.
Query Controls
- Max Results (checkbox and adjacent text field) - when checked, use the number n entered in the adjacent text field to restrict the returned results to those with the top n scores.
- Search - Search the database for all results matching the constraints, and display the result in the spreadsheet view.
- Reset - Reset all constraints to their default values and clear the lower spreadsheet display.
- Color Gradient for Score (checkbox) - if checked, color the cells in the Score column of the spreadsheet view with the same color that would be used for that result in the Heat Map display.
Results
Score
The numeric score for the indicated result type.
For titrations (experimental results), for example in a 4x4 titration of drug 1 vs drug 2, only the largest of the 16 resulting scores is given in the table. The full titration results can be seen in the titration graph.
Score Error (Experimental)
Excess-over-Bliss
For Excess-over-Bliss, the score error is calculated as:
EoB_Error = sqrt [ (ObservedCombined_SEM * 100)^2 + (PredictedCombined_SEM*100)^2 ]
where the combined Standard Error of the Mean is for drug 1 and drug 2 together.
Titration Curve (Experimental)
Double-click on "view" to view the complete titration curve for a particular drug pair. The graph is described in detail further below.
P-Value (Computational)
P-value for computed score. Not currently used.
Plot Options
The basic tabular search results can be viewed as a heatmap or as a network graph in Cytoscape.
- Pulldown menu - Choose either Heatmap or Network as the desired plot type.
- Plot - create the heatmap or network display.
- Export - Export the entire tabular result display to a CSV format file on disk.
Heatmap (Color Mosaic Component)
Overview
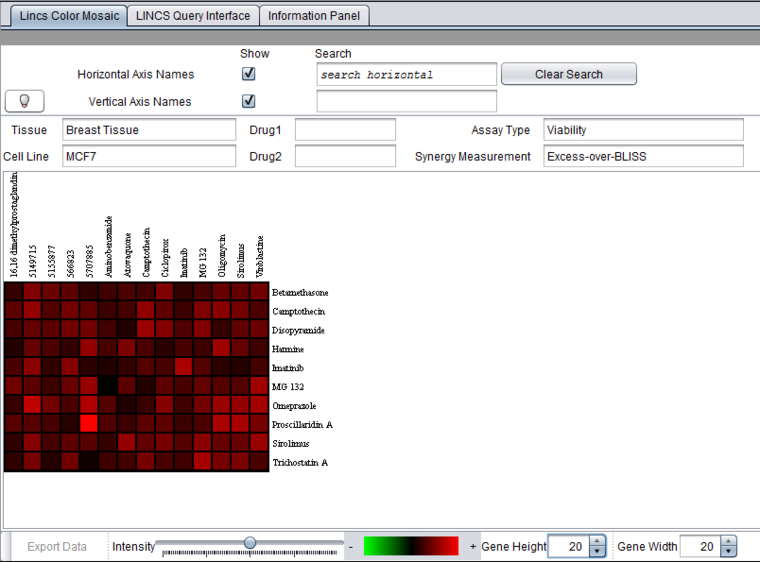
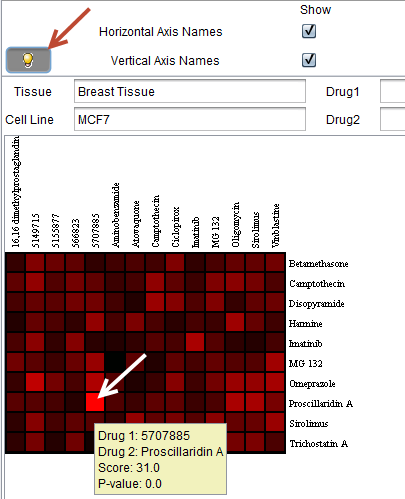
This image shows a heatmap generated from a search with multiple drugs selected. It is displayed using the geWorkbench Color Mosaic component. The display of the horizontal and vertical axis names has been turned on by checking the corresponding boxes. This also enables the search feature on these names. For experimental data, clicking on any box brings up the underlying titration curves.
Right-click Menu
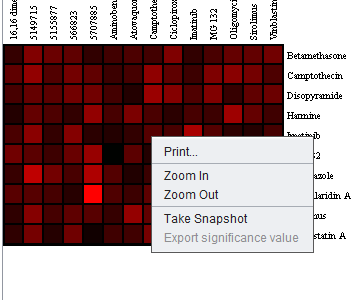
Right-clicking on the heat map brings up a menu as shown below. The options are:
- Print - Print the heatmap image
- Zoom In and Zoom out - change the size of the image
- Take Snapshot - place an image of the heatmap into the Workspace (not implemented).
Double-click for titration graphs
Double-clicking on a cell in the heatmap will plot the underlying titration curves for the selected drug pair (when available).
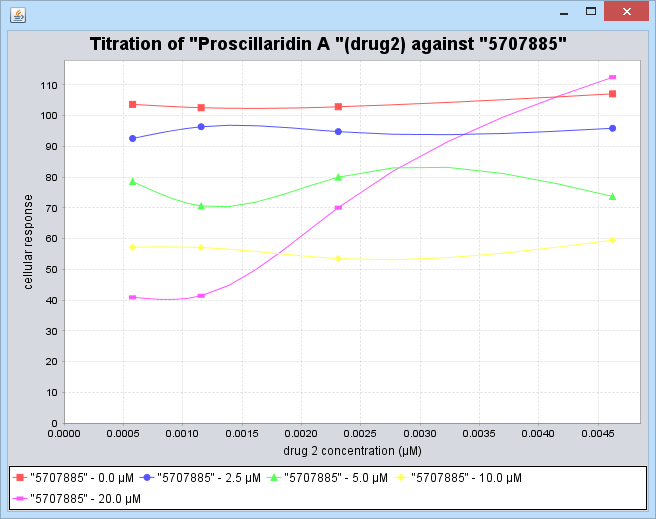
Note the brightest red cell in the heat map. The titration curves for this data point, "Proscillardin A" (drug 2) vs "5707885" (drug 1) are plotted below in the Titration Curves section.
Hover-Text Control
![]() If the bulb icon is toggled on, then when the cursor is hovered over a particular cell in the heat map, extra information will be displayed: the identities of drug 1 and drug 2, the score, and the p-value, as shown below. The cursor was hovered over the brightest red square, already described above. The resulting hover text is depicted below.
If the bulb icon is toggled on, then when the cursor is hovered over a particular cell in the heat map, extra information will be displayed: the identities of drug 1 and drug 2, the score, and the p-value, as shown below. The cursor was hovered over the brightest red square, already described above. The resulting hover text is depicted below.
Search
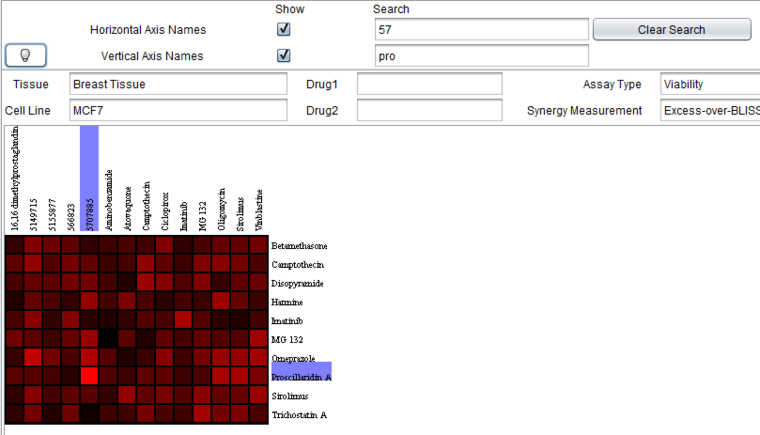
The horizontal and vertical axis names can be searched on by using the search fields. Matching names will be highlighted. The search is dynamic, occuring as characters are typed. It matches any name containing a string, regardless of where in the name it occurs.
- Horizontal Axis Names - checkbox and search field. When checked, displays the names for the horizontal axis and enables the adjacent search box for searching on these names.
- Vertical Axis Names - checkbox and search field. When checked, displays the names for the vertical axis and enables the adjacent search box for searching on these names.
- Clear Search - clear any highlighted search results.
The result of dynamic search with partial drug names on both axes is shown in the image below.
Heatmap Details
Text fields just below the search controls display the values used in the original query. There will always be two blank fields, these correspond to the two free variables represented on the heatmap axes. This is even true when multiple selection is used. That is, if a multiple selection is made for drug 1, then its text field will appear empty. The actual values plotted can be seen directly on the heatmap axes.
Network
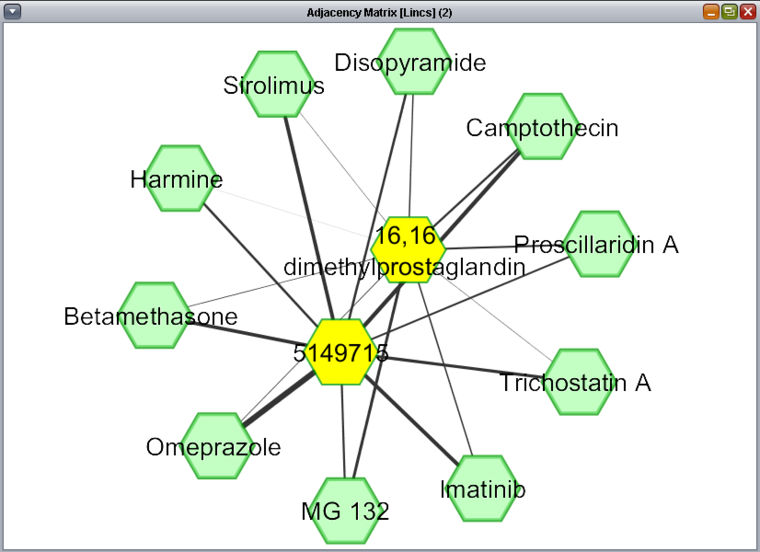
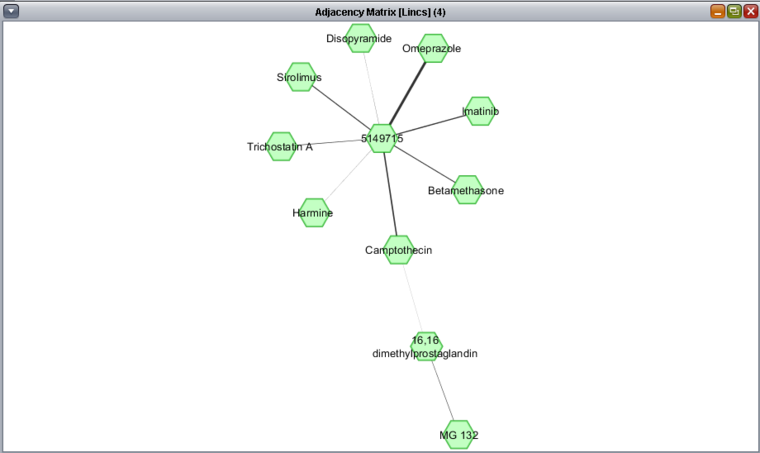
The Network view of query results is displayed using the Cytoscape component. Unlike with the heat map display, only the drug-drug relationship interaction results from a query are displayed, regardless of which query fields may have been left as free variables.
In the figure depicting a query for experimental results above, 2 drugs were selected for drug 1, while drug 2 was left free. The figure below shows the results of this two-against-all query visualized as a network. The two drug 1 compounds have been manually highlighted in yellow by selecting them with the mouse. Each of the two drug 1 compounds has a resulting connection to each drug 2 compound, with the strength of the interaction (calculated synergy) represented by the thickness of the line.
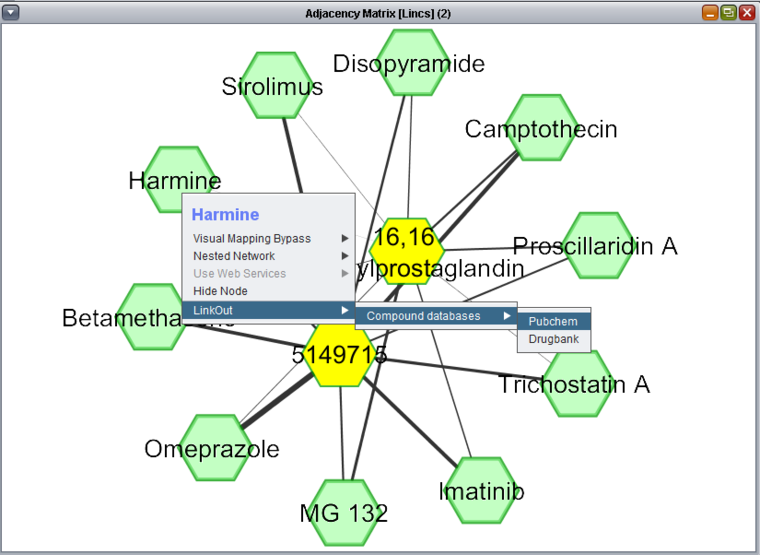
Right-clicking on any drug node will bring up a menu allowing lookup of the drug in Pubchem or Drugbank.
To show only the strongest results, the query can be rerun with the "Max Results" checkbox checked and set to 10. The result, sorted by Drug 1, is shown below.
When this is new result is now plotted as a network, the figure below is generated in Cytoscape. This technique may be helpful when larger networks are being viewed.
Experimental Data Graphs
The user can choose,either by clicking a "view" link in the tabular result display, or by double-clicking on a heat-map cell, to view a titration curve or an isobologram (where available).
Drug-Drug Titration Curves
While intended for second phase detailed drug-drug titrations of 7 or 9 concentrations of each drug, it is currently showing the available first stage, 4 point titrations.
For each concentration of drug 1, given in a box at the lower edge of the graph, a point is drawn for each concentration of drug 2,and a line is drawn connecting those points. The line for each fixed concentration of drug one is indicated by a different color, as shown below.
All concentrations are given in micromolar.
Functional Mode of Action (fMoA)
For any drug in the Computational query results, a Functional Mode of Action network can be generated. It is displayed in Cytoscape. The fMoA is taken as the set of normalized enrichment scores calculated at the level of transcription factors using the Viper program. The NES represents the effect of the chosen drug as detected at the level of the TF's targets.
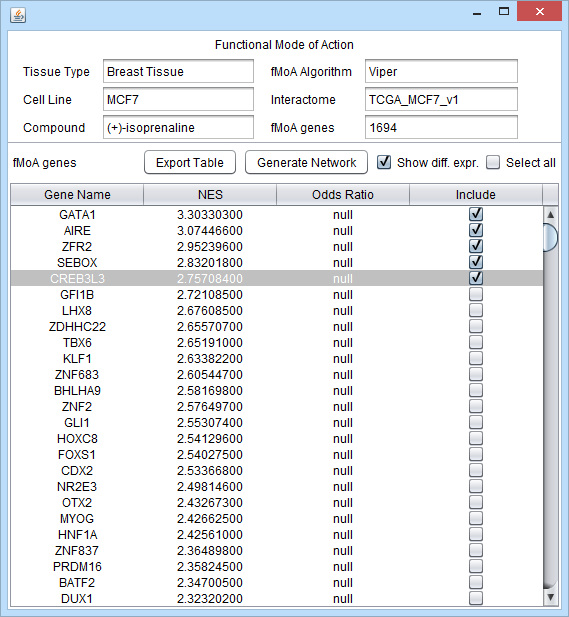
fMoA Gene Selector
For clarity of the network graph, a limited number of genes should be included. To this end, a selector component is provided. For each TF chosen in the selector, that TF and its regulon will be displayed in Cytoscape. Each regulon may have up to several hundred genes.
To generate a fMoA diagram, choose the desired drug by double clicking on its name in the tabular results from a computational query. The gene selector will appear, listing all of the tested transcription factors and their normalized enrichment scores (NES) for the chosen drug.
fMoA Details
At the top of the selector, the details of the fMoA run will be displayed in text fields:
- Tissue Type
- Cell Line
- Compound
- fMoA Algorithm - currently Viper is used.
- Interactome (from the CNKB) - the reverse-engineered regulatory network from which each TFs regulon is taken.
- fMoA genes - the total number of TFs included
Selector Controls
- Generate Network - for each selected TF, draw the interation network in Cytoscape
- Export Table - export the fMoA result table to a file.
- Show diff. expr. - color the network display in Cytoscape using the prestored differential expression results from the computation.
- Select All - select all genes for inclusion in the network (not recommended!).
Selector Columns
- Gene Name
- NES - Normalized Enrichment Score
- Odds Ratio - if available
- Include - checkbox to mark which genes (TFs) to include in building the displayed network. The regulon of each included gene will be depicted.
fMoA Display in Cytoscape
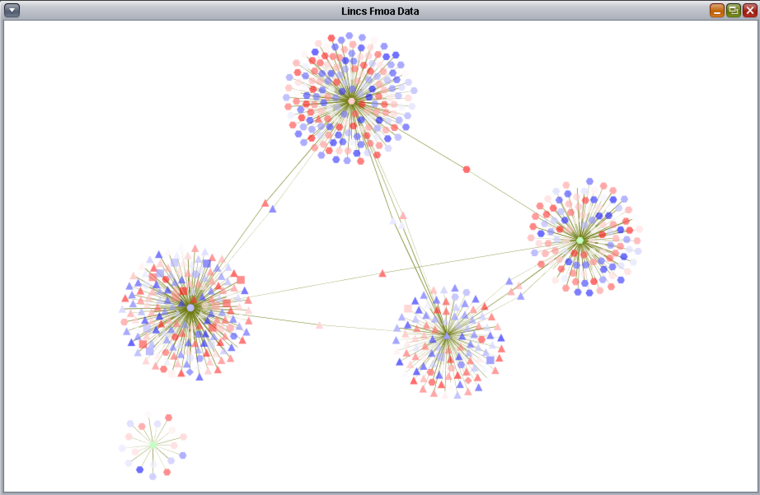
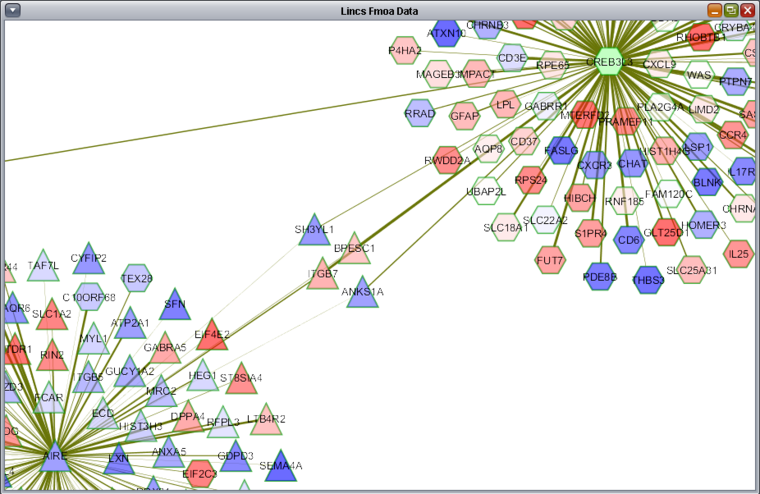
The TFs selected above along with their regulons are shown displayed in Cytoscape. As "Show diff. expr." was checked, the individual targets are colored by their differential expression values. Only targets which were used in the Viper analysis, that is, those for which differential expression data was available, are depicted.
- Differential Expression Color Scale - Colors range along a gradient from dark blue (most underexpressed) to white (no expression change) and then from white to dark red (most overexpressed). Green indicates a matching expression value was not found. Hub genes were manually selected and shown in yellow.
All standard Cytoscape controls are available, for example to zoom in and to display gene name labels. Further details on Cytoscape within geWorkbench are available on the Cytoscape tutorial page.
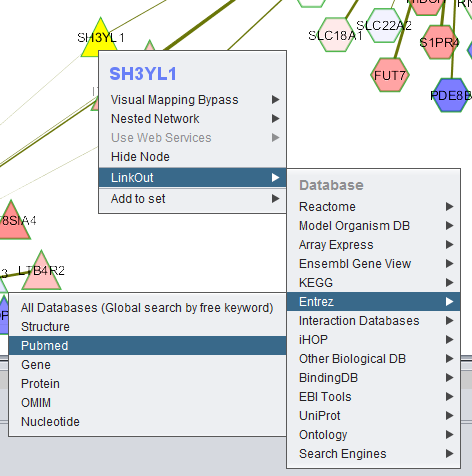
Right-clicking on any node brings up a series of menus by which gene information can be looked up from a number of external sources.
Link Out
Here, the right-click menu to link out to Entrez Pubmed is illustrated.
Clicking on the Pubmed item will open the selected gene's Entrez Pubmed web page.
Add to Set
This function is not implemented for fMoA data.
Other Commands
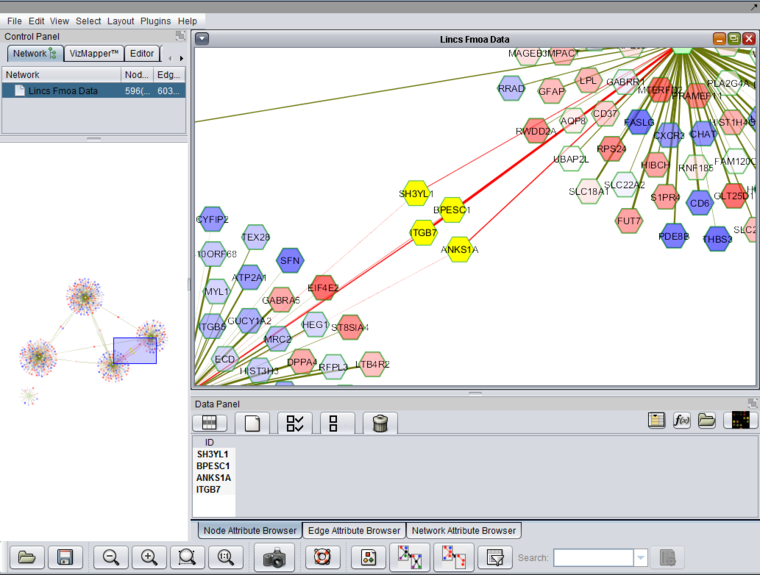
Individual or groups of genes can be selected, for example, below a set of genes connected to two different TFs is shown. The list appears below in the Node Attribute Browser, from where, by right-clicking on the list, it can be e.g. copied or saved to a file (Export command). The entire Cytoscape interface in geWorkbench is depicted below.
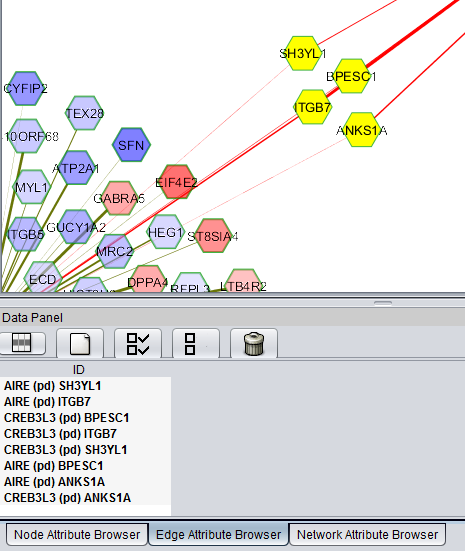
The Edge Attribute Browser will shown the interaction type for selected edges:
