Gene Ontology Viewer
|
Home | Quick Start | Basics | Menu Bar | Preferences | Component Configuration Manager | Workspace | Information Panel | Local Data Files | File Formats | caArray | Array Sets | Marker Sets | Microarray Dataset Viewers | Filtering | Normalization | Tutorial Data | geWorkbench-web Tutorials |
Analysis Framework | ANOVA | ARACNe | BLAST | Cellular Networks KnowledgeBase | CeRNA/Hermes Query | Classification (KNN, WV) | Color Mosaic | Consensus Clustering | Cytoscape | Cupid | DeMAND | Expression Value Distribution | Fold-Change | Gene Ontology Term Analysis | Gene Ontology Viewer | GenomeSpace | genSpace | Grid Services | GSEA | Hierarchical Clustering | IDEA | Jmol | K-Means Clustering | LINCS Query | Marker Annotations | MarkUs | Master Regulator Analysis | (MRA-FET Method) | (MRA-MARINa Method) | MatrixREDUCE | MINDy | Pattern Discovery | PCA | Promoter Analysis | Pudge | SAM | Sequence Retriever | SkyBase | SkyLine | SOM | SVM | T-Test | Viper Analysis | Volcano Plot |
Contents
Overview
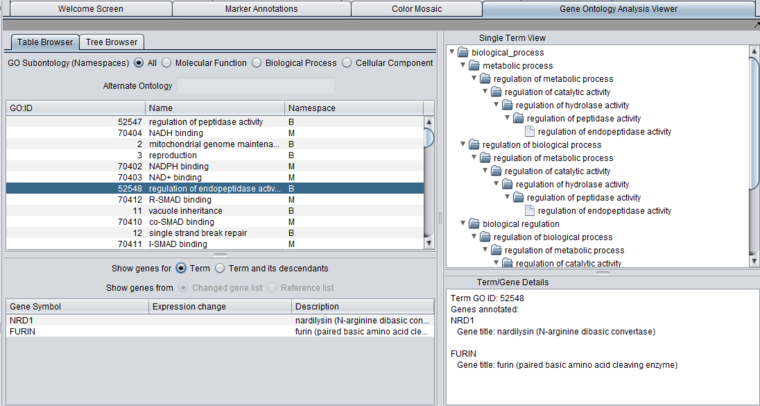
The Gene Ontology Analysis Viewer allows direct browsing of the Gene Ontology, and also the visualization of GO Term analysis results.
The viewer presents the GO both in tabular form (Table tab) as well as in a tree form (Tree tab).
In addition, three windows provide additional details:
- A list below the selection windows shows all genes annotated with a selected term.
- The "Single Term View" shows the complete tree, including multiple paths through the GO directed acyclic graph, for any selected term.
- The Term/Gene Details windows provides additional details on an term or gene selected in the GO browser or the gene list.
Gene Ontology OBO file source
By default, each time geWorkbench starts, it downloads the latest Gene Ontology OBO file from the geneontology.org website. However, a setting in the geWorkbench Menu Bar Tools item, "Choose OBO Source", allows an OBO file to be loaded locally from disk instead.
The file is chosen using a standard file browser. After the setting has been changed, geWorkbench must be restarted before it will take effect.
Standalone Gene Ontology Browser
When used in standalone mode, all genes in the microarray dataset which are annotated with any particular term will be displayed if that term is selected.
Table Browser
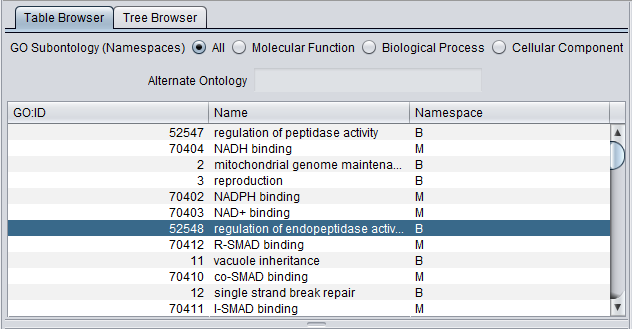
GO Subontology (Namespaces) - radio buttons allow the user to view all three subontologies, or just one at a time. The choices are:
- All
- Molecular Function (M)
- Biological Process (B)
- Cellular Component (C)
- All
Table Columns
- GO:ID - The Gene Ontology Term ID
- Name - The name associated with the GO Term.
- Namespace - the Gene Ontology Namespace to which each GO term belongs, abbreviated as as shown above under Subontology
Tree Browser
Browse
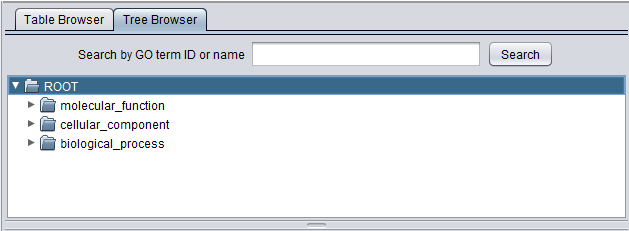
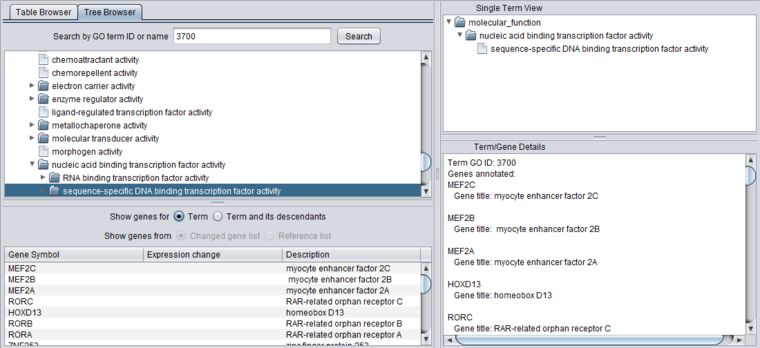
The Viewer also allows the Gene Ontology to be directly browsed in tree format. Clicking on the arrow in front of any term will open that term to display its child terms, until a final leaf node is reached. The first picture below shows the tree with just the three top level subontologies displayed.
Search by GO term ID or name
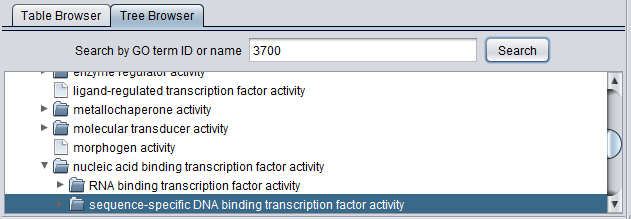
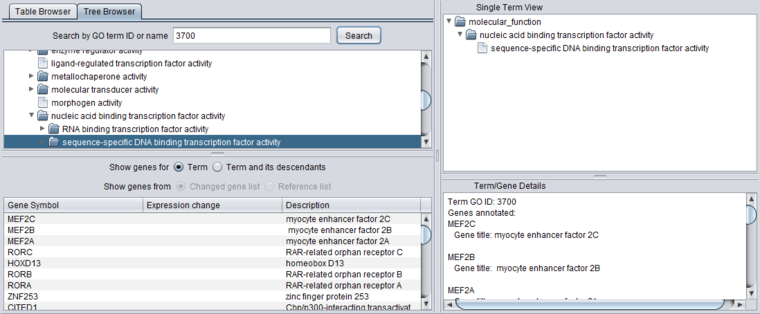
The Tree Browser allows terms to be searched either by ID or by name. Enter the desired search term and hit "Search". Here, term 3700 has been searched for. Term details are displayed in the other three windows.
Detail Views
When any term is selected in the browser (table or tree), its details are displayed in the three adjacent windows.
Gene List
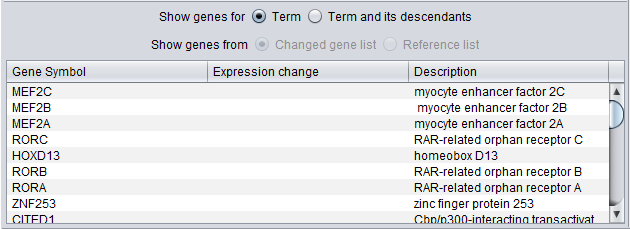
When a term is selected in either the Table or Tree Browser views, a list of genes annotated with that term appear below in the Gene List.
There are several display options:
Show Genes for
- Term - show only genes annotated directly with this term.
- Term and its descendants - show genes that are annotated directly with the selected term, or with any child of the selected term.
When used to display the results of a GO Terms analysis, two additional options are available. The radio-buttons for these options are disabled (grayed-out) when not displaying the results of an analysis.
Show genes from
- Changed gene list - only genes that both belong to the selected term, and are members of the "changed gene list" used in the GO Terms Analysis are displayed.
- Reference gene list - all genes that are annotated with the selected term and which appear in the reference gene list (e.g. up to including all genes represented on the analysis platform).
Copy to Set
The genes in the Gene List can be copied to a set in the Markers component. Right-click on the list and select "Add to set". A new set will be created using the name of the selected term to which the genes belong.
Note that, as one gene may be represented by more than one marker, the new set in the Markers component may have more members than shown in the gene list.
Term/Gene Details
Term
When a term is selected in the browser window, the Term/Gene Details pane displays all of the genes annotated with that term in the annotation file.
Gene
When a gene is selected in the lower gene list, details about it inluding a link out to Entrez Gene are shown in the Term/Gene Details pane.
GO Term Analysis Results
When the viewer is used to display the results of a GO Terms analysis, a few additional fields are added displayed in both the Table and Tree browsers.
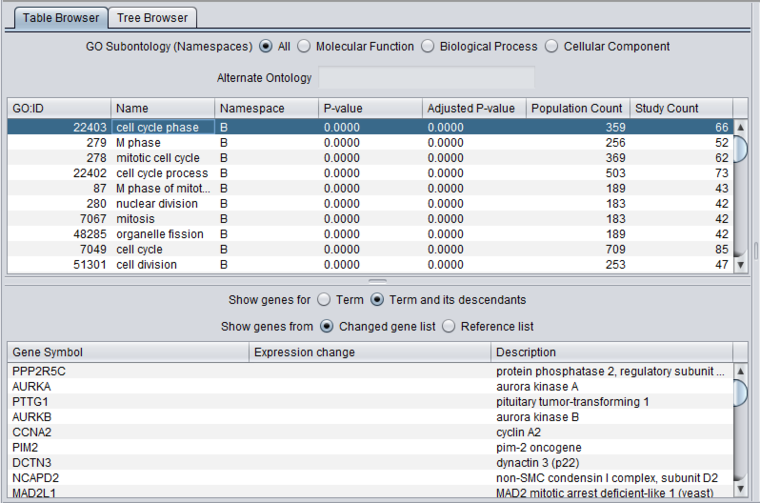
To generate the following images, a t-test was run on the BCell-100.exp data set to generate the "study set" of changed genes.
- Threshold normalizer: min threshold 1.0.
- Log2 Normalize
- In Arrays, select the "Class" list of array sets and activate GC B-cell and GC-Tumor (Case).
- Run t-test with alpha threshold = 0.01 and using Bonferroni correction.
Table Browser
Both the upper and lower tables can be sorted on any column by clicking on the column header. Clicking again will reverse the sort order.
Additional fields:
- P-value - The p-value associated with the enrichment of the selected term in the study set of genes.
- Adjusted P-value - The p-value adjusted using the method selected during the analysis Bonferroni etc.).
- Population Count - The number of genes that were in the reference gene set used in the analysis.
- Study Count - The number of genes that were in the "changed gene list" used in the analysis.
Gene List
- Show genes from - Note in the figure above that the radio buttons for "Changed gene list" and "Reference gene list" are now enabled. See above section Gene_Ontology_Viewer#Gene_List.
Tree Browser
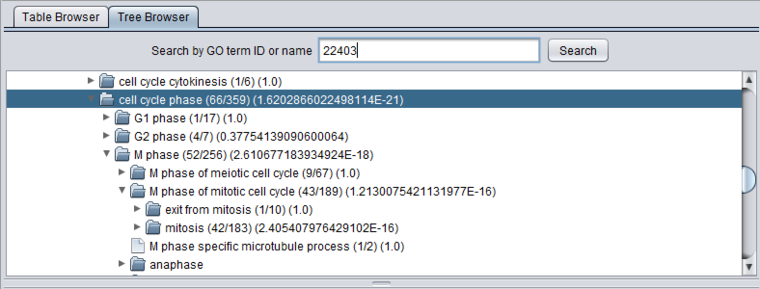
After a GO Terms analysis, the tree browser will also display the values described for the Table browser above, in parantheses following each term. The terms are arranged as follows:
(study count/population count) (p-value)
The image below shows the tree opened out to display the term listed at the top of the Table view. It has in term been opened to display some of its child nodes, which however have less significant p-values by themselves.
