Gene Ontology Term Analysis
|
Home | Quick Start | Basics | Menu Bar | Preferences | Component Configuration Manager | Workspace | Information Panel | Local Data Files | File Formats | caArray | Array Sets | Marker Sets | Microarray Dataset Viewers | Filtering | Normalization | Tutorial Data | geWorkbench-web Tutorials |
Analysis Framework | ANOVA | ARACNe | BLAST | Cellular Networks KnowledgeBase | CeRNA/Hermes Query | Classification (KNN, WV) | Color Mosaic | Consensus Clustering | Cytoscape | Cupid | DeMAND | Expression Value Distribution | Fold-Change | Gene Ontology Term Analysis | Gene Ontology Viewer | GenomeSpace | genSpace | Grid Services | GSEA | Hierarchical Clustering | IDEA | Jmol | K-Means Clustering | LINCS Query | Marker Annotations | MarkUs | Master Regulator Analysis | (MRA-FET Method) | (MRA-MARINa Method) | MatrixREDUCE | MINDy | Pattern Discovery | PCA | Promoter Analysis | Pudge | SAM | Sequence Retriever | SkyBase | SkyLine | SOM | SVM | T-Test | Viper Analysis | Volcano Plot |
Contents
Overview
The Gene Ontology project describes genes (gene products) using terms from three structured vocabularies: biological process, cellular component and molecular function.
A number of analysis methods in geWorkbench produce a list of interesting genes, for example, those differentially expressed (t-test, ANOVA), or those which show similarities in expression (Hierarchical Clustering, SOM, ARACNe). The Gene Ontology Enrichment component, also referred to as the "GO Terms" component, allows the genes in any such "changed-gene" list to be characterized using the Gene Ontology terms annotated to them. It asks, whether for any particular GO term, the fraction of genes assigned to it in the "changed-gene" list is higher than expected by chance (is over-represented), relative to the fraction of genes assigned to that term in the reference set. In statistical terms, the analysis tests the null hypothesis that, for any particular ontology term, there is no difference in the proportion of genes annotated to it in the reference list and the proportion annotated to it in the test list. The reference list is typically comprised of all genes on a microarray (after any filtering and removal of redundant entries).
The Gene Ontology (GO Terms) analysis component in geWorkbench is built around the Ontologizer 2.0 software product from Peter Robinson's group at the Charite Medical Institute of the Humboldt University in Berlin. It provides several methods for over-representation analysis, including Term-for-Term, Parent-Child, and Topology. More information about these methods can be found at the Ontologizer website at http://compbio.charite.de/index.php/ontologizer2.html, and in the descriptions and references below.
The Gene Ontology is structured as a directed acyclic graph (DAG). This has several consequences. A term can have more than one parent, and hence there can be multiple paths from the root by which a term can be reached. The Ontologizer code uses the "true path" property of the Gene Ontology in counting genes assigned to a term, by which a gene annotated to any term is considered also annotated to all that term’s parent terms. A term may thus show significant over-representation through the cumulative effects of its children rather than through genes assigned directly to it.
- Important Note on Annotation Files
- The Gene Ontology Term Analysis component will automatically make use of Affymetrix 3' Expression microarray annotation data if it was loaded along with the microarray dataset.
- Although the Affymetrix Human Gene 1.0 ST and Human Exon 1.0 ST annotation files can be used by geWorkbench, they cannot currently be used by the ontology analysis code.
- For any other microarray platform type except the Affymetrix 3' Expression format, the user must supply an alternate gene ontology annotation file directly in the Ontologizer setup.
- Annotation files obtained from the GO Consortium (www.geneontology.org) can be loaded.
- Note - If a marker has an annotation to a GO Term but has no gene symbol, it will not be included in the "Reference Gene" list or the "Changed Gene" list.
Gene Ontology OBO file source
By default, each time geWorkbench starts, it downloads the latest Gene Ontology OBO file. (The URL is now "http://purl.obolibrary.org/obo/go/go-basic.obo"). However, a setting in the geWorkbench Menu Bar Tools item, "Choose OBO Source", allows an OBO file to be loaded locally from disk instead.
The file is chosen using a standard file browser. After the setting has been changed, geWorkbench must be restarted before it will take effect.
Analysis Component GUI
Parameters
Selection
Reference Gene List
The first pulldown allows one to choose from the following sources for the reference gene list:
- All Genes - uses all markers in the current microarray dataset.
- From Set - if chosen, the second pull-down shows the available sets defined in the Markers component. The markers chosen will be converted to gene symbols without duplication.
- From File - if chosen, the "Load" button becomes active.
Load - If From File is chosen, the user can load a comma-separated list of genes to use as the reference set. Gene symbols must be used, not markers (probeset ids).
Text field - displays the contents of the currently loaded reference gene list, regardless of source.
Note - If a marker has an annotation to a GO Term but has no gene symbol, it will not be included in the "Reference Gene" list.
Changed Gene List
The first pull-down allows one to choose from the following sources for the changed-gene list:
- From Set - if chosen, the second pull-down shows the available sets defined in the Markers component. The markers chosen will be converted to gene symbols without duplication.
- From File - if chosen, the "Load" button becomes active.
- From Result Node - if chosen, the second pull-down shows a list of available differential expression (t-test, ANOVA) result nodes from the Workspace.
Load - If From File is chosen, the user can load a comma-separated list of genes to use as the changed gene list. Gene symbols must be used, not markers (probeset ids).
Text field - displays the contents of the currently loaded changed-gene list, except if "From Result Node" is chosen.
Note - If a marker has an annotation to a GO Term but has no gene symbol, it will not be included in the "Changed Gene" list.
Ontology Selection
Not currently implemented, this is intended to allow the loading of alternate ontologies besides the three comprising the Gene Ontology.
Ontologizer
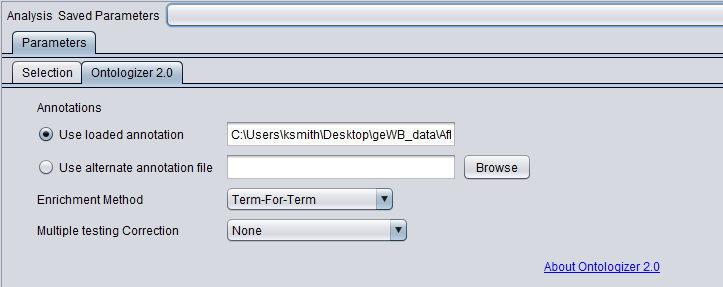
Annotations
The annotation file links individual genes and the GO terms they are associated with. The Ontologizer 2.0 code will automatically make use of Affymetrix 3' Expression format annotation files. For other microarray platform types, the user will need to construct and/or provide an alternate annotation file. As of geWorkbench release 2.2.1, annotation files obtained from the GO Consortium (www.geneontology.org) can be loaded in addition to Affymetrix annotation files. However, the user must ensure that the proper mapping of marker names is used between the microarray data and the annotation file. Please see http://compbio.charite.de/contao/index.php/howto.html for further information.
- Use loaded annotations - If an Affymetrix 3' Expression format annotation file was read in when the microarray dataset was loaded, its name is displayed here.
- Use alternate annotation file - A new or alternate annotation file can be entered into the adjacent text field in by selecting this option and choosing "Browse".
- Browse - this button brings up a file browser for choosing an annotation file.
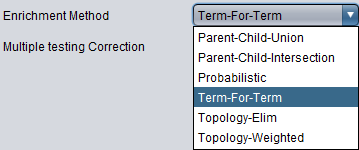
Enrichment Method
- Parent-Child-Union - see Grossman et al. (2007)
- Parent-Child-Intersection - see Grossman et al. (2007)
- Probabilistic - this is an experimental method, not yet published.
- Term-For-Term (default)- see Ontologizer Overrepresentation Analysis
- Topology-Elim - see Alexa et al. (2006) and Falcon et al. (2007)
- Topology-Weighted - see Alexa et al. (2006) and Falcon et al. (2007)
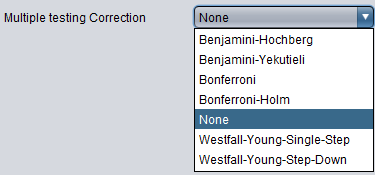
Multiple Testing Correction
- Benjamini-Hochberg -
- Benjamini-Yekutieli -
- Bonferroni -
- Bonferroni-Holm -
- None (default) -
- Westfall-Young-Single-Step -
- Westfall-Young-Step-Down -
Example
Setup
Running a GO Terms analysis requires a list of genes to analyze (the study set). Here, we will run a simple t-test on two classes of cell-lines in the BCell-100.exp dataset.
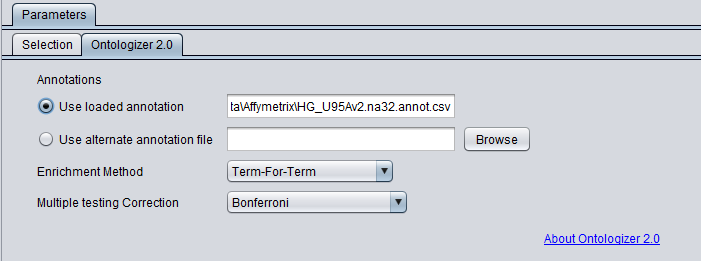
- Load Bcell-100.exp with its annotation file e.g. HG_U95Av2.na32.annot.csv.
- Threshold normalizer: min threshold 1.0.
- Log2 Normalize
- In Arrays, select the "Class" list of array sets and activate GC B-cell and GC-Tumor (Case).
- Run t-test with alpha threshold = 0.01 and using Bonferroni correction.
A new Marker set is created called "Significant Genes" with 367 markers.
The picture below shows the "Significant Genes" set has been chosen for the Changed Gene list.
In the Ontologizer tab, the Enrichment Method used is term-for-term (default) and the Bonferroni multiple testing correction is added.
Results
The results of running this analysis are shown on the Gene Ontology Viewer page.
Technical Note
The "Changed Gene List" text field allows free text to be entered. However, if the parameters have been saved "Save Settings" then restoring the parameters will reload the contents of the set named in the pulldown, not the free text.
References
- Alexa A, Rahnenführer J, Lengauer T (2006). Improved scoring of functional groups from gene expression data by decorrelating GO graph structure. Bioinformatics 22(13), pps. 2600-1607 (link to paper)
- Bauer S, Grossmann S, Vingron M, Robinson PN (2008). Ontologizer 2.0--a multifunctional tool for GO term enrichment analysis and data exploration. Bioinformatics 24(14), pps. 1650-1. (link to paper)
- Falcon S, Gentleman R. (2007) Using GOstats to test gene lists for GO term association. Bioinformatics 23(2), pps. 257-8. (link to paper)
- Grossmann S, Bauer S, Robinson PN, Vingron M (2007). Improved detection of overrepresentation of Gene-Ontology annotations with parent child analysis. Bioinformatics 23(22), pps. 3024-31. (link to paper)
- Robinson PN, Wollstein A, Böhme U, Beattie B. (2004) Ontologizing gene-expression microarray data: characterizing clusters with Gene Ontology. Bioinformatics 20(6), pps. 979-81. (link to paper)


