GSEA
Contents
Overview
The Gene Set Enrichment Analysis (Subramanian et al, 2005) (GSEA) component in geWorkbench implements a front-end for submitting data to and viewing the results of a GSEA analysis on a GenePattern server.
Complete documentation of GSEA is available on the GenePattern GSEA online documentation page. See also further references at the bottom of this page.
As described in the GSEA documentation, GSEA "evaluates cumulative changes in the expression of groups of multiple genes defined based on prior biological knowledge. It first ranks all genes in a data set, then calculates an enrichment score for each gene set, which reflects how often members of that gene set occur at the top or bottom of the ranked data set (for example, in expression data, in either the most highly expressed genes or the most underexpressed genes)".
Prerequisites
- The "GSEA Analysis" and "GSEA Browser" components must be loaded in the Component Configuration Manager.
- An expression dataset must be loaded in the Workspace.
- Two (and only two) array sets must be activated in the Arrays component. They do not need to be marked "Case" or "Control", this will have no effect. These sets define the two classes used to calculate a measure of differential expression and from that the rank order of genes.
Parameters
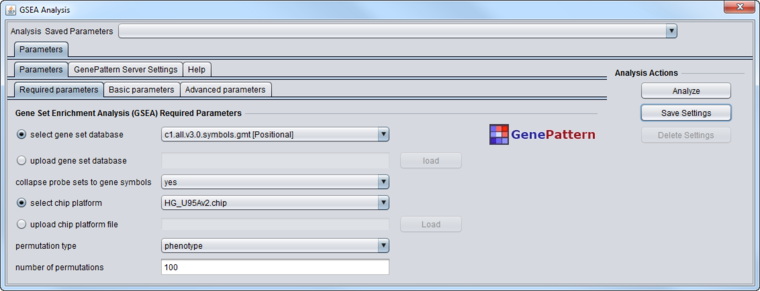
Required Parameters
- select gene set database - Gene sets database from GSEA website.
- upload gene set database - Gene sets database - .gmt, .gmx, .grp. Upload a gene set if your gene set is not listed as a choice for the gene sets database parameter.
- collapse probe sets - Select yes to have GSEA collapse each probe set in the expression dataset into a single vector for the gene, which gets identified by its gene symbol.
- select chip platform - Choose the annotation ("Chip") file that matches the expression dataset loaded in the Workspace.
- upload chip platform - Upload a chip file if your chip is not listed as a choice for the chip platform parameter.
- permutation type - Type of permutation to perform.
- phenotype - permute arrays among the two phenotype classes (preferred).
- gene set - chose random genes sets of the same size as that being tested.
- number of permutations - Number of permutations to perform.
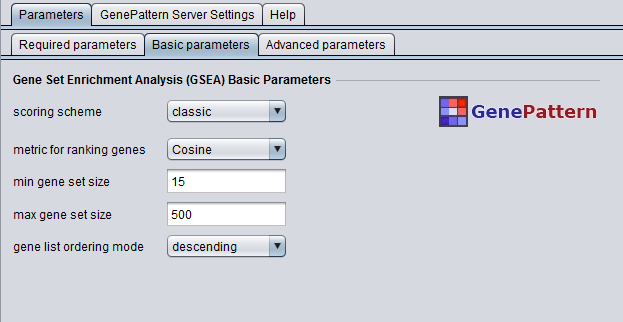
Basic Parameters
- scoring scheme - The statistic used to score hits (gene set members) and misses (non-members)
- classic
- weighted
- weighted_p2
- weighted_p1.5
- metric for ranking genes - Class separation metric - gene markers are ranked using this metric to produce the gene list
- Cosine
- Euclidean
- Manhattan
- Pearson
- min gene set size - Gene sets smaller than this are excluded from the analysis
- max gene set size - Gene sets larger than this are excluded from the analysis
- gene list ordering mode - Direction in which the gene list should be ordered
- descending
- ascending
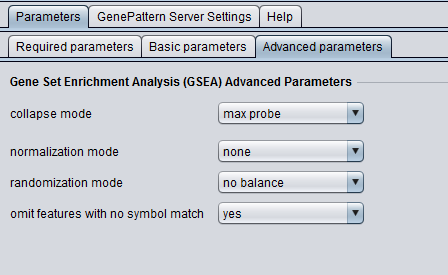
Advanced Parameters
- collapse mode - collapsing mode for probe sets with more than one match
- max probe
- median of probes
- normalization mode - normalization to apply
- none
- meandiv
- randomization mode - Type of phenotype randomization (does not apply to gene set permutations)
- no balance
- equalize and balance
- omit features with no symbol match - If there is no known gene symbol match for a probe set, omit it from the collapsed dataset.
- yes
- no
GenePattern Server Settings
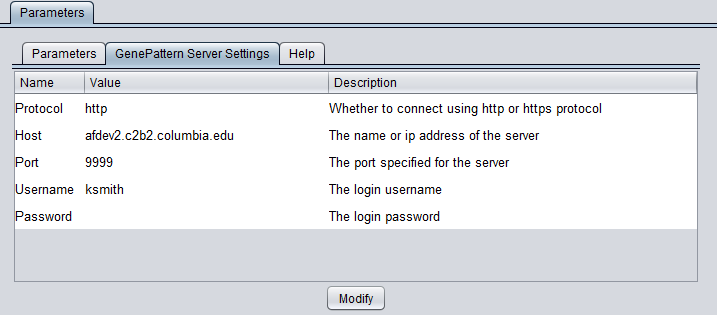
YYou can connect to any running GenePattern server to run the analysis (provided it has the required module installed). An example configuration of the "GenePattern Server Settings" tab is shown here:
To run GenePattern components, a GenePattern account is required.
Pushing "Modify" brings up an editing box where any of the settings can be changed.
- Protocol - HTTP or HTTPS, depending on the server being used.
- Host - URL of a GenePattern server.
- Port - Port at which the GenePattern server is located on the Host machine.
- Username - A valid user name on the specified GenePattern server.
- Password - A password, if required by the specified server.
Results
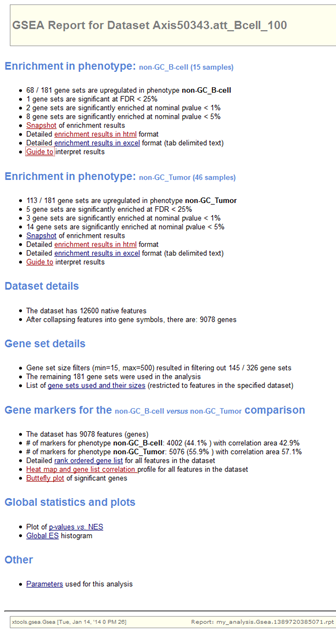
The figures shown below were generated using the BCell-100.exp data file, which is of type HG-U95Av2. The two classes selected were "non-GC B-cell" and "non-GC Tumor".
The GSEA result report is displayed either in geWorkbench, using a built-in browser, or in the case where a 64-bit Java Virtual Machine is in use (now the default on all platforms) the user can display the result page in an external web browser window. The report contains links to the various result files generated by GSEA, including Excel-format files. A few are depicted below.
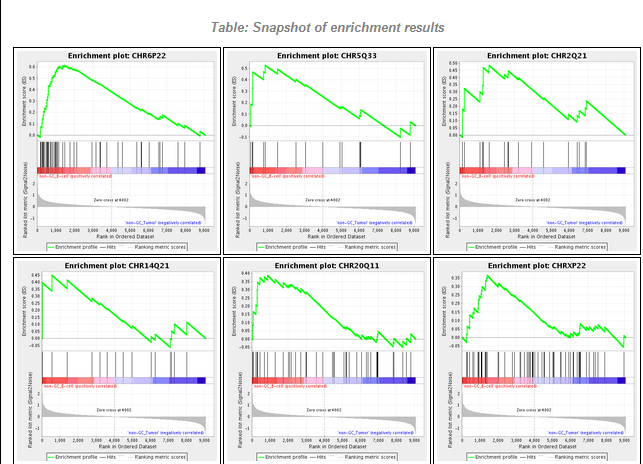
The Enrichment Snapshot (partial, first six graphs only):
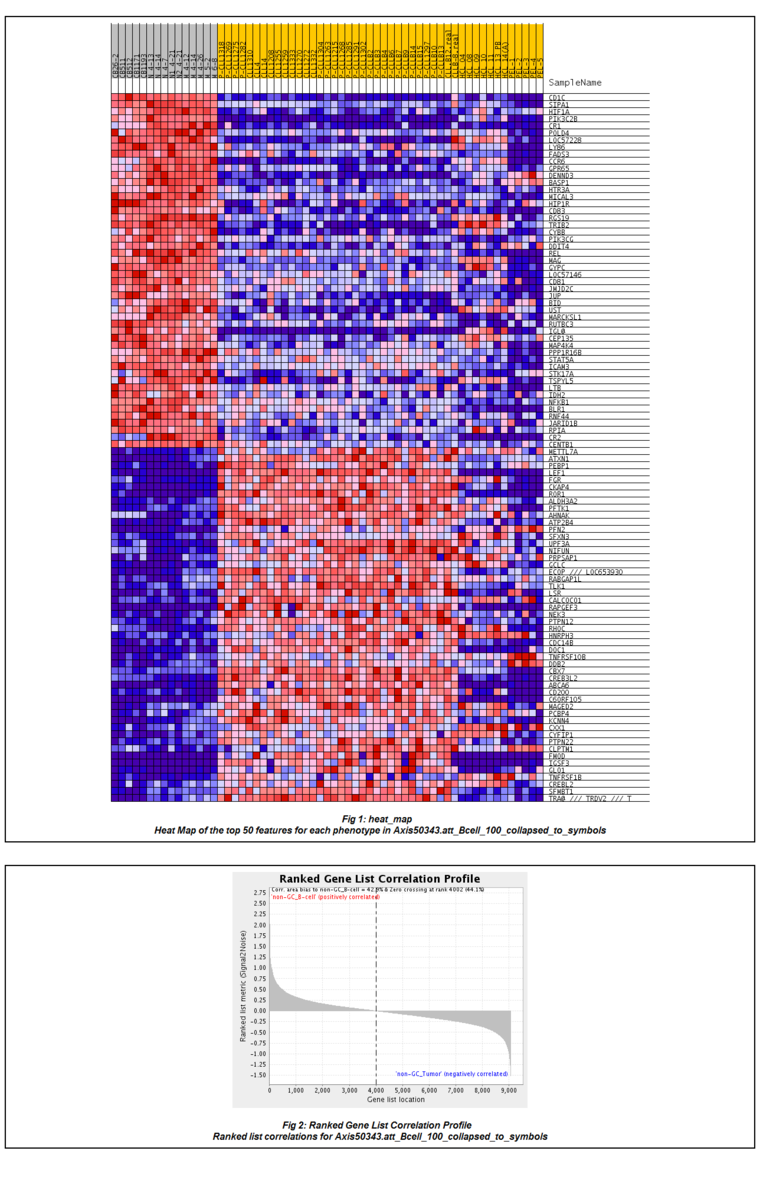
The HeatMap display:
Technical Note
- The GSEA components are found in the "gpmodule_v3_0" package in the geWorkbench component source tree.
- When there is more than one GSEA result node, the user can switch between them. The correct result zip files will be unpacked. If they are being viewed in an external browser, it should be noted that the html index files share common names, i.e. are not result-node specific, although they point to result-specific files. Refreshing an old top-level results page would then display the data from the currently selected result.
References - GenePattern
- Reich M, Liefeld T, Gould J, Lerner J, Tamayo P, Mesirov JP (2006) GenePattern 2.0 Nature Genetics 38 no. 5 (2006): pp500-501 doi:10.1038/ng0506-500. (PubMed 16642009)
- GenePattern website.
- GenePattern modules documentation.
References - GSEA
- Subramanian A, Tamayo P, Mootha VK, Mukherjee S, Ebert BL, Gillette MA, Paulovich A, Pomeroy SL, Golub TR, Lander ES, Mesirov JP. (2005) Gene set enrichment analysis: a knowledge-based approach for interpreting genome-wide expression profiles. Proc Natl Acad Sci U S A. 102(43):15545-50. PubMed 16199517
- GSEA v14 online documentation.
- Guide to interpreting GSEA Results
