Expression Value Distribution
|
Home | Quick Start | Basics | Menu Bar | Preferences | Component Configuration Manager | Workspace | Information Panel | Local Data Files | File Formats | caArray | Array Sets | Marker Sets | Microarray Dataset Viewers | Filtering | Normalization | Tutorial Data | geWorkbench-web Tutorials |
Analysis Framework | ANOVA | ARACNe | BLAST | Cellular Networks KnowledgeBase | CeRNA/Hermes Query | Classification (KNN, WV) | Color Mosaic | Consensus Clustering | Cytoscape | Cupid | DeMAND | Expression Value Distribution | Fold-Change | Gene Ontology Term Analysis | Gene Ontology Viewer | GenomeSpace | genSpace | Grid Services | GSEA | Hierarchical Clustering | IDEA | Jmol | K-Means Clustering | LINCS Query | Marker Annotations | MarkUs | Master Regulator Analysis | (MRA-FET Method) | (MRA-MARINa Method) | MatrixREDUCE | MINDy | Pattern Discovery | PCA | Promoter Analysis | Pudge | SAM | Sequence Retriever | SkyBase | SkyLine | SOM | SVM | T-Test | Viper Analysis | Volcano Plot |
Overview
The Expression Value Distribution (EVD) is located in the View Area in the top-right of the application.
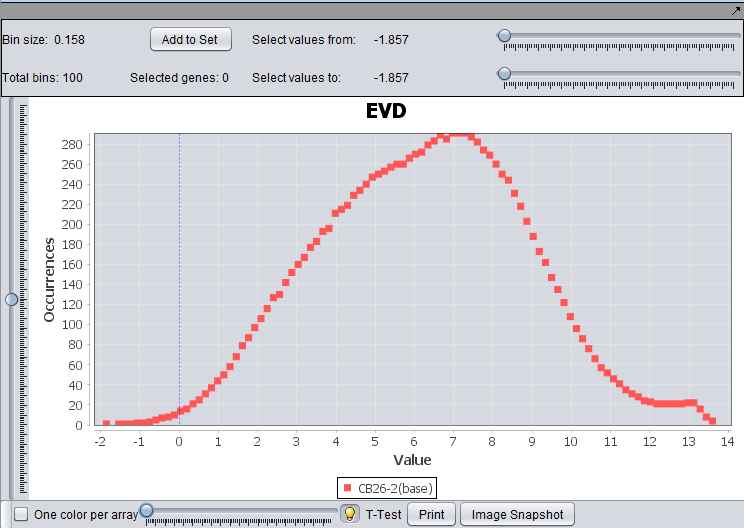
This component uses a line plot to graphically summarize the distribution of expression values within a microarray. The x axis represents the value of the range and the y axis the occurrence of markers with expression value in that range. For each array, the marker value frequencies are plotted over the range [m, M], where m, M are respectively the smallest and highest expression values observed across all arrays of a microarray set.
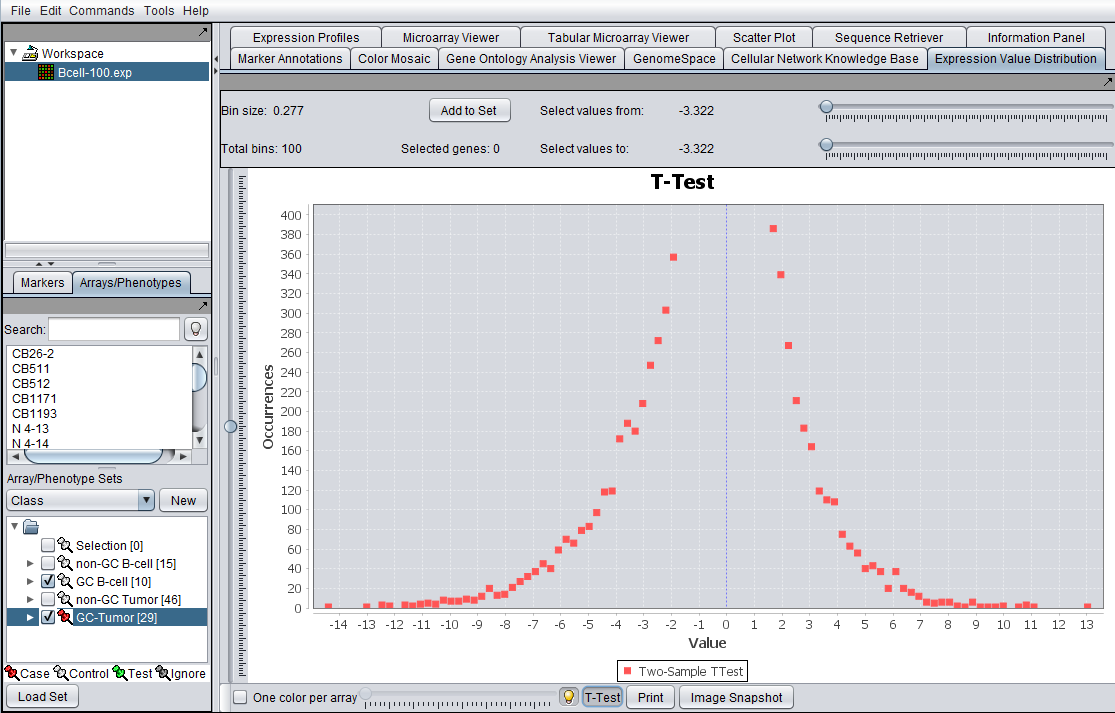
The EVD component can display results from a single or from multiple arrays. It also allows genes showing expression within a given range of values to be selected through use of range sliders. If the data has been classified into case/control groups, a t-test can be performed within the component. The resulting t-statistics for each gene are then displayed on the same type of distribution plot.
EVD for the file Bcell-100.exp after quantile normalization and log2 transformation.
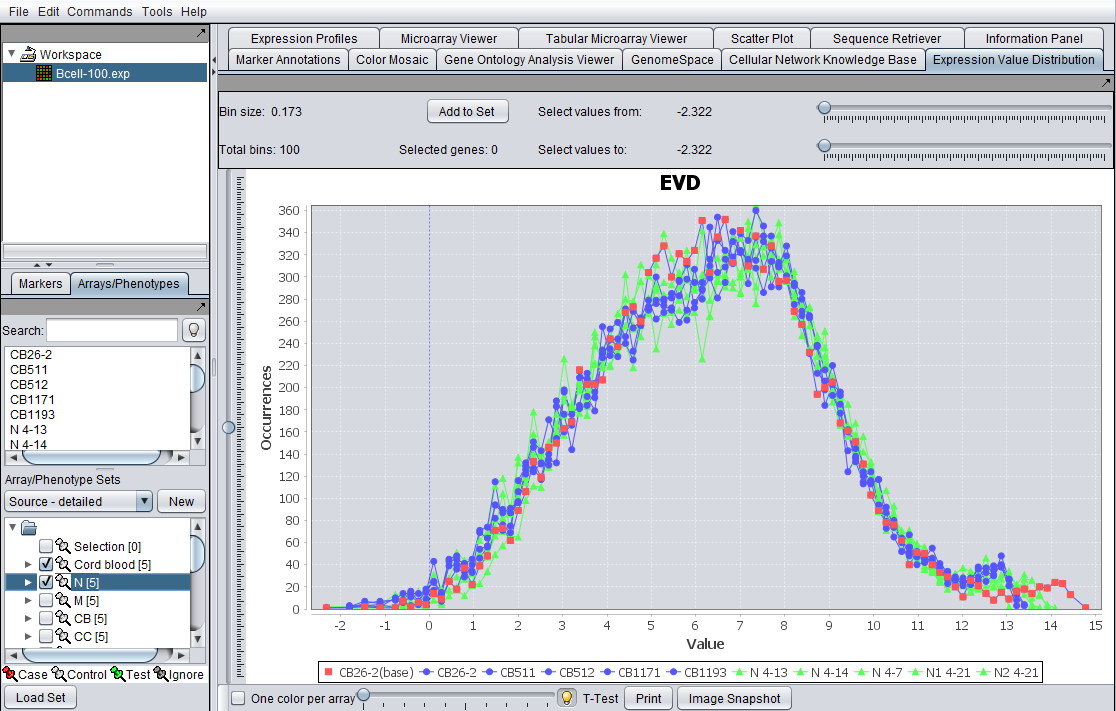
EVD for the file Bcell-100.exp after log2 transformation, and two array sets activated. The first set is shown in blue, the second in green. The currently selected base array is shown in red (controlled by the slider).
EVD t-test for activated case and control array sets as shown in Arrays component to left.
Controls
- Bin size and Total Bins: Each expression range on the EVD corresponds to a “bin”. The size of each bin and total bans are displayed at the upper left corner of the component. The number of total bins equals (m – M)/ number of bin size.
- Tooltip: When a user scrolls over a plot, the enabled tool tip displays the name of the array. The tooltip display can be disabled by selecting the tooltip icon. The disabled tooltip icon appears grayed out.
- Change the base array: The slider can be used to navigate through the microarrays in the selected dataset. As the user moves the slider to the next tick which represents a microarray, the grid is updated with positions representing the marker values in the Microarray being displayed. The base array always labels with the red color.
- Activated Marker and Array Checkbox: If a microarray or gene set is created and activated, the EVD reflect plots for each array in the sets when the checkbox is selected (default). Each array in the activated set is displayed on the graph and its corresponding plot points are linked with lines, while the points corresponding to the base array are unconnected. Unselecting the checkbox results in data from all microarrays/marker in the selected set are shown.
- One Color per Array: The EVD lines and plots appear color-coded, based on the color preferences of the arrays set. All the arrays in a set are shown with the same color. The user can modify the color display to reflect a unique color per array by selected the checkbox One Color per Array.
- Legend: A legend appears at the bottom of the plot indicating which color and shape corresponds to which set. Modification of image display preferences are described in details in Preferences. The base array always list as the first one.
- Image Snapshot: Clicking on this button creates image snapshots that are saved in the Workspace.
- Zoom: Zooming in can be down by left clicking and drag down over a region of the image or selecting right clicks Zoom In option. Zooming out, left clicks and drag upward or right click and select Zoom Out option.
- T-Test: This button computes a t-test statistic for each marker and updates the graph title from EVD to T-Test and disabled the base array slider. Case and control sets must be created and classified ( Marker and Phenotype Help section for additional information).
- Print: Prints the displayed EVD. The print dialog pop up is displayed to support printer selection.
- Selected Values from/to: The starting/ending X axis location that allow markers to be selected graphically and filtered. The number of current selected genes is displayed next to the Total bins. “Add to Panel” button adds the selected genes to the Gene Panel.


