Viper Analysis
|
Home | Quick Start | Basics | Menu Bar | Preferences | Component Configuration Manager | Workspace | Information Panel | Local Data Files | File Formats | caArray | Array Sets | Marker Sets | Microarray Dataset Viewers | Filtering | Normalization | Tutorial Data | geWorkbench-web Tutorials |
Analysis Framework | ANOVA | ARACNe | BLAST | Cellular Networks KnowledgeBase | CeRNA/Hermes Query | Classification (KNN, WV) | Color Mosaic | Consensus Clustering | Cytoscape | Cupid | DeMAND | Expression Value Distribution | Fold-Change | Gene Ontology Term Analysis | Gene Ontology Viewer | GenomeSpace | genSpace | Grid Services | GSEA | Hierarchical Clustering | IDEA | Jmol | K-Means Clustering | LINCS Query | Marker Annotations | MarkUs | Master Regulator Analysis | (MRA-FET Method) | (MRA-MARINa Method) | MatrixREDUCE | MINDy | Pattern Discovery | PCA | Promoter Analysis | Pudge | SAM | Sequence Retriever | SkyBase | SkyLine | SOM | SVM | T-Test | Viper Analysis | Volcano Plot |
The VIPER (Virtual Inference of Protein-activity by Enriched Regulon analysis) [Alvarez et al., manuscript in preparation] component in geWorkbench transforms the expression profile for each sample (column) into a transcription-factor activity profile, representing the relative activity of each TF in each sample. The activity of each transcription factor is inferred from that of its targets, where the targets are obtained from a cell-context-specific interaction network (interactome). Three cell-context-specific interactomes are supplied, for leukemia, breast cancer, and prostate cancer.
The full standalone version of VIPER can also be downloaded from http://wiki.c2b2.columbia.edu/califanolab/index.php/Software/VIPER. VIPER is implemented in R and the standalone package has a number of additional functions which are documented in the VIPER R vignette.
In geWorkbench, the most simple variant of VIPER is employed, which assumes that in the null situation the target genes are uniformly distributed on the gene expression signature. The standalone version offers a permutation method (given a set of control samples) to calculate a null model accounting for non-independence of expression between genes.
VIPER and its source code are released in geWorkbench under the VIPER Software License.
Prerequistes
The local version of VIPER requires that R be installed on the same machine as geWorkbench. Please see the R installation instructions on the Download and Installation page. The R location must then be set in the geWorkbench Preferences.
Note - The version of Viper used in geWorkbench differs slightly from the freestanding version available in Bioconductor. If you plan to run both versions on your machine, please set a separate package directory for R packages in geWorkbench in the Preferences. The geWorkbench version of Viper will be downloaded automatically to this directory on demand.
Data
Individual samples may represent e.g. case and control experiments, or may all belong to a single type, e.g. drug perturbation experiments. See the analysis method options for appropriate handling of different data types.
Analysis
For a typical dataset containing expression values relative to control, the "Scale" method of analysis is recommended.
VIPER analysis transforms the input expression matrix into a transcription factor activity matrix, representing the relative activity of each TF in each sample. This matrix can be viewed in the Tabular Microarray Viewer, the Color Mosaic Viewer, or can be analyzed further e.g. with hierarchical clustering.
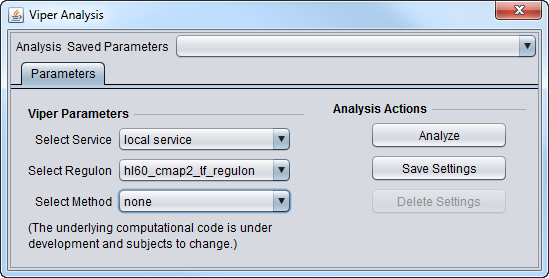
Parameters
- Select Service
- Local Service - Run VIPER on an instance of R installed on the same machine as geWorkbench.
- Web service - Run Viper on a remote server (local is recommended).
- Select Regulon
- hl60_cmap2_tf_regulon - Human promyelocytic leukemia, CMAP2 data
- mcf7_cmap2_tf_regulon - Breast adenocarcinoma, CMAP2 data
- pc3_cmap2_tf_regulon - Prostate cancer, CMAP2 data
- Select Method
- none - use if the data is already in rank format.
- scale - for each gene (row in dataset), calculate the mean and standard deviation across all columns, then subtract the mean from each value in the row, and divide each by the standard deviation. This assumes the data has a normal distribution, i.e. that it has already been log2 normalized.
- rank - rank transform row-wise
- mad - for each row, subtract the median, divide by the mean absolute deviation (MAD)
- ttest - for each row, perform a t-test comparing each sample (column) one-at-a-time against all other samples taken together.
References
Mariano Alvarez Yao Shen, B. Belinda Ding, B. Hilda Ye and Andrea Califano, manuscript in preparation.

