Difference between revisions of "DeMAND"
(→References) |
|||
| (15 intermediate revisions by the same user not shown) | |||
| Line 2: | Line 2: | ||
| − | The '''DeMAND''' (Drug Mode of Action through Network Dysreguation) [[# | + | The '''DeMAND''' (Drug Mode of Action through Network Dysreguation) [[#Woo2015| [Woo et al., 2015]]] algorithm measures dysregulation between the expression of two genes in a network caused by e.g. a drug perturbation. The list of top dysregulated gene pairs can reveal details of a drug's mode of action in the tested cellular system or tissue. |
| − | DeMAND is currently used with networks that integrate transcriptional (TF-target), post-translational (modulator-TF) and curated protein-protein interactions [[#Lefebvre2010 | [Lefebvre 2010]]]. Transcriptional interactions can be ascertained e.g. with the program ARACNe. Post-translational interactions can be found using the program MINDy (command-line version). Bayesian integration has been used to assemble final interactomes. | + | DeMAND is currently used with networks that integrate transcriptional (TF-target), post-translational (modulator-TF) and curated protein-protein interactions [[#Lefebvre2010 | [Lefebvre et al., 2010]]]. Transcriptional interactions can be ascertained e.g. with the program ARACNe. Post-translational interactions can be found using the program MINDy (command-line version). Bayesian integration has been used to assemble final interactomes. |
| − | Dysregulation is measured in the expression dataset for each pair of genes connected by an edge in the network. It is determined by calculating the KL-divergence of each pair. The p-values for all dysregulated edges for each gene are then summed and corrected for number of interactions and dependence. The resulting p-value per gene reflects the significance of dysregulation of each gene. | + | Dysregulation is measured in the expression dataset for each pair of genes connected by an edge in the network. It is determined by calculating the Kullback-Leibler (KL)-divergence of each pair. The p-values for all dysregulated edges for each gene are then summed and corrected for number of interactions and dependence. The resulting p-value per gene reflects the significance of dysregulation of each gene. |
| Line 14: | Line 14: | ||
The local version of DeMAND requires that R be installed on the same machine as geWorkbench. Please see the R installation instructions on the [[Download_and_Installation|Download and Installation]] page. The R location must then be set in the geWorkbench [[Preferences|Preferences]]. | The local version of DeMAND requires that R be installed on the same machine as geWorkbench. Please see the R installation instructions on the [[Download_and_Installation|Download and Installation]] page. The R location must then be set in the geWorkbench [[Preferences|Preferences]]. | ||
| + | Also required are | ||
| + | * A microarray data matrix must be loaded. | ||
| + | * An annotation file (Affmetrix format) must be loaded which has at least the following columns shown below ([[File_Formats#Creating_a_custom_annotation_file |see here for creating a custom annotation file]]): | ||
| + | ** Probe Set ID | ||
| + | ** Entrez Gene ID | ||
| + | ** Gene Symbol | ||
| + | ** Chromosomal Location | ||
| + | * A network (interactome) must be loaded (e.g. see [[ARACNe|ARACNe]] for producing a transcriptional network). See also [[File_Formats#Network_Formats |Network File Formats]] for more information. | ||
==Data== | ==Data== | ||
| Line 63: | Line 71: | ||
==References== | ==References== | ||
| − | |||
| − | |||
| − | |||
<span id="Lefebvre2010"></span> | <span id="Lefebvre2010"></span> | ||
| − | * Lefebvre C, Rajbhandari P, Alvarez MJ, Bandaru P, Lim WK, Sato M, Wang K, Sumazin P, Kustagi M, Bisikirska BC, Basso K, Beltrao P, Krogan N, Gautier J, Dalla-Favera R, Califano A (2010) A human B-cell interactome identifies MYB and FOXM1 as master regulators of proliferation in germinal centers. Mol Syst Biol. 6:377. PMID: 20531406 ([http://www.ncbi.nlm.nih.gov/pubmed/ | + | * Lefebvre C, Rajbhandari P, Alvarez MJ, Bandaru P, Lim WK, Sato M, Wang K, Sumazin P, Kustagi M, Bisikirska BC, Basso K, Beltrao P, Krogan N, Gautier J, Dalla-Favera R, Califano A (2010) A human B-cell interactome identifies MYB and FOXM1 as master regulators of proliferation in germinal centers. Mol Syst Biol. '''6''':377. ([http://www.ncbi.nlm.nih.gov/pubmed/20531406 PMID: 20531406]). |
| + | <span id="Woo2015"></span> | ||
| + | * Woo JH, Shimoni Y, Yang WS, Subramaniam P, Iyer A, Nicoletti P, Rodríguez Martínez M, López G, Mattioli M, Realubit R, Karan C, Stockwell BR, Bansal M, Califano A (2015) Elucidating Compound Mechanism of Action by Network Perturbation Analysis. Cell '''162'''(2):441-51. doi: 10.1016/j.cell.2015.05.056. ([http://www.ncbi.nlm.nih.gov/pubmed/26186195 PMID: 26186195]). | ||
Latest revision as of 15:09, 29 July 2015
The DeMAND (Drug Mode of Action through Network Dysreguation) [Woo et al., 2015] algorithm measures dysregulation between the expression of two genes in a network caused by e.g. a drug perturbation. The list of top dysregulated gene pairs can reveal details of a drug's mode of action in the tested cellular system or tissue.
DeMAND is currently used with networks that integrate transcriptional (TF-target), post-translational (modulator-TF) and curated protein-protein interactions [Lefebvre et al., 2010]. Transcriptional interactions can be ascertained e.g. with the program ARACNe. Post-translational interactions can be found using the program MINDy (command-line version). Bayesian integration has been used to assemble final interactomes.
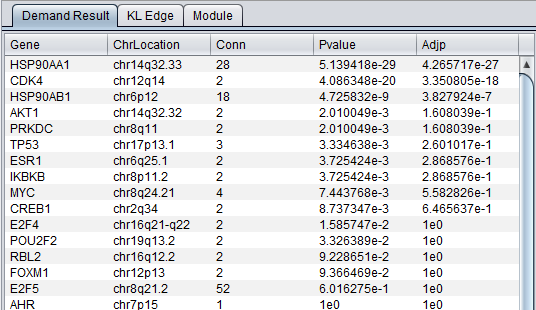
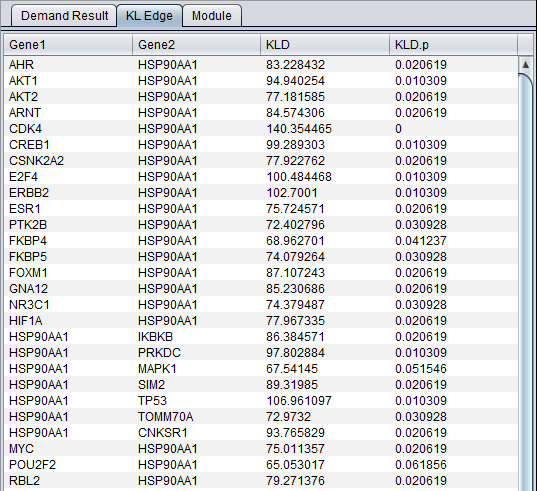
Dysregulation is measured in the expression dataset for each pair of genes connected by an edge in the network. It is determined by calculating the Kullback-Leibler (KL)-divergence of each pair. The p-values for all dysregulated edges for each gene are then summed and corrected for number of interactions and dependence. The resulting p-value per gene reflects the significance of dysregulation of each gene.
DeMAND and its source code are released in geWorkbench under the DeMAND Software License.
Contents
Prerequistes
The local version of DeMAND requires that R be installed on the same machine as geWorkbench. Please see the R installation instructions on the Download and Installation page. The R location must then be set in the geWorkbench Preferences.
Also required are
- A microarray data matrix must be loaded.
- An annotation file (Affmetrix format) must be loaded which has at least the following columns shown below (see here for creating a custom annotation file):
- Probe Set ID
- Entrez Gene ID
- Gene Symbol
- Chromosomal Location
- A network (interactome) must be loaded (e.g. see ARACNe for producing a transcriptional network). See also Network File Formats for more information.
Data
The expression dataset should contain at least six experimental and six control arrays. The experimental arrays should result from e.g. a drug perturbation.
Analysis
The expression dataset must be loaded into the geWorkbench Workspace. The network can be then loaded into the Workspace as a child of the expression dataset, or it can be loaded directly into the DeMAND component. Case and control arrays can be defined in the Arrays component, or loaded from file.
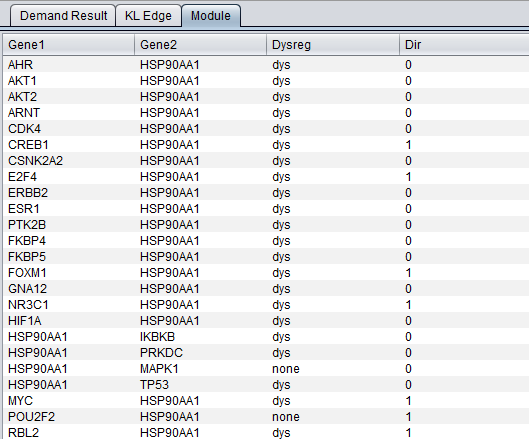
The result of the DeMAND analysis is a list of dysregulated edges (gene pairs), presented in the DeMAND Viewer component in several levels of detail.
Parameters
- Select Service
- Local Service - run DeMAND on an instance of R installed on the same machine as geWorkbench.
- Web service - not yet implemented. Run DeMAND on a remote server.
- Load Network
- From Workspace - select a network that has already been loaded into the Workspace as a child of the current expression dataset.
- From File - load a network directly from disk. Networks can be in ADJ or SIF format.
- Drug Arrays/Control Arrays
- From Set - Use a set of arrays already defined in the Arrays component.
- From File - Load in a list of arrays, one to a line, from a file.
- Load Sample Information - (intended for internal lab use only) loads the Drug and Control arrays from a special file that contains two lines, with each listing arrays to use by index number rather than by name. The first line starts with "Drug" and the second line with "Ctrl".
Results Viewer
Main Result Tab
KL Edge Tab
Module Tab
References
- Lefebvre C, Rajbhandari P, Alvarez MJ, Bandaru P, Lim WK, Sato M, Wang K, Sumazin P, Kustagi M, Bisikirska BC, Basso K, Beltrao P, Krogan N, Gautier J, Dalla-Favera R, Califano A (2010) A human B-cell interactome identifies MYB and FOXM1 as master regulators of proliferation in germinal centers. Mol Syst Biol. 6:377. (PMID: 20531406).
- Woo JH, Shimoni Y, Yang WS, Subramaniam P, Iyer A, Nicoletti P, Rodríguez Martínez M, López G, Mattioli M, Realubit R, Karan C, Stockwell BR, Bansal M, Califano A (2015) Elucidating Compound Mechanism of Action by Network Perturbation Analysis. Cell 162(2):441-51. doi: 10.1016/j.cell.2015.05.056. (PMID: 26186195).


