Difference between revisions of "ARACNe"

(Quick Example)
Line 13: Line 13:
  
 
The resulting adjancency matrix will be displayed in the Cytoscape network visualization component.
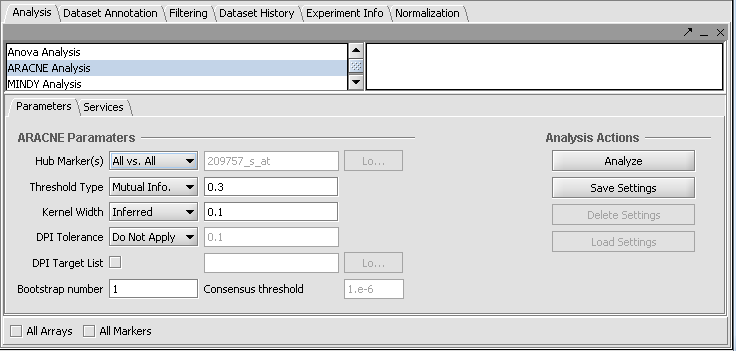
 
The resulting adjancency matrix will be displayed in the Cytoscape network visualization component.
 +
 +
 +
 +
 +
[[Image:T_ARACNE_parameters.png]]
 +
 +
 +
 +
[[Image:T_ARACNE_parameters_List.png]]

Revision as of 11:52, 16 October 2008

Home | Quick Start | Basics | Menu Bar | Preferences | Component Configuration Manager | Workspace | Information Panel | Local Data Files | File Formats | caArray | Array Sets | Marker Sets | Microarray Dataset Viewers | Filtering | Normalization | Tutorial Data | geWorkbench-web Tutorials

Analysis Framework | ANOVA | ARACNe | BLAST | Cellular Networks KnowledgeBase | CeRNA/Hermes Query | Classification (KNN, WV) | Color Mosaic | Consensus Clustering | Cytoscape | Cupid | DeMAND | Expression Value Distribution | Fold-Change | Gene Ontology Term Analysis | Gene Ontology Viewer | GenomeSpace | genSpace | Grid Services | GSEA | Hierarchical Clustering | IDEA | Jmol | K-Means Clustering | LINCS Query | Marker Annotations | MarkUs | Master Regulator Analysis | (MRA-FET Method) | (MRA-MARINa Method) | MatrixREDUCE | MINDy | Pattern Discovery | PCA | Promoter Analysis | Pudge | SAM | Sequence Retriever | SkyBase | SkyLine | SOM | SVM | T-Test | Viper Analysis | Volcano Plot


A new ARACNE tutorial is coming soon....

ARACNE in geWorkbench is used to determine interactions between a hub gene and a set of selected genes (or all genes in the set).

Quick Example

  1. Load a microarray dataset, e.g. Bcell-100.exp.
  2. Set a hub gene (e.g 1973_s_at)
  3. Click Analyze.

The resulting adjancency matrix will be displayed in the Cytoscape network visualization component.


T ARACNE parameters.png


T ARACNE parameters List.png