Difference between revisions of "Marker Annotations"
(→New Content) |
(→Changes in geWorkbench 2.5.0) |
||
| (45 intermediate revisions by 3 users not shown) | |||
| Line 5: | Line 5: | ||
| − | |||
| − | |||
| − | |||
| − | |||
| − | |||
| − | |||
==Overview== | ==Overview== | ||
| − | |||
| − | |||
| − | |||
| − | |||
| − | |||
| − | |||
| − | |||
| − | |||
| − | |||
| − | |||
| − | |||
| − | |||
| − | |||
| − | |||
| − | |||
| − | |||
| − | |||
| − | |||
| − | |||
| − | |||
| − | |||
| − | |||
| − | |||
| − | |||
| − | |||
| − | |||
| − | |||
| − | |||
| − | |||
| − | |||
| − | |||
| − | |||
| − | |||
| − | |||
| − | |||
| − | |||
| − | |||
| − | |||
| − | |||
| − | |||
| − | |||
| − | |||
| − | |||
| − | |||
| − | |||
The Marker Annotations component enables the retrieval of biological annotation information for a collection of genes. For every gene, the following data can be retrieved: | The Marker Annotations component enables the retrieval of biological annotation information for a collection of genes. For every gene, the following data can be retrieved: | ||
| + | * Links to gene detail pages. | ||
* A set of pathways containing the gene. | * A set of pathways containing the gene. | ||
| − | + | ||
| − | All annotations are retrieved from remote servers maintained by the National Cancer Institute (NCI). | + | All annotations are retrieved from remote servers maintained by the National Cancer Institute (NCI) [http://biodbnet.abcc.ncifcrf.gov/ bioDBnet resource of the Advanced Biomedical Computing Center] (NCI Frederick). |
| − | + | ==Submit Query== | |
| − | |||
| − | |||
| − | Submit Query | ||
The Marker Annotations module will retrieve information for all markers that belong to activated marker sets, or, more precisely, for the genes corresponding to those markers: | The Marker Annotations module will retrieve information for all markers that belong to activated marker sets, or, more precisely, for the genes corresponding to those markers: | ||
| − | [[Image: | + | [[Image:MarkerAnnotations_Marker_set_activation.png]] |
| − | |||
| − | |||
| − | |||
| − | |||
| − | |||
| − | |||
| − | |||
| − | |||
| − | |||
| − | |||
| − | |||
| − | |||
| − | |||
| − | |||
| − | |||
| − | |||
| − | |||
| − | |||
| − | |||
| − | |||
| − | |||
| − | |||
| − | |||
| − | |||
| − | |||
| − | |||
| − | |||
| − | |||
| − | |||
| − | |||
| − | |||
| − | |||
| − | |||
| − | |||
| − | |||
| − | |||
| − | |||
| − | |||
| − | |||
| − | |||
| − | |||
| − | |||
| − | |||
| − | |||
| − | |||
| − | |||
| − | |||
| − | + | E.g., in the example shown above, information will be retrieved about the genes STAT3 and CEBPB. Clicking the "Retrieve Annotations" button initiates the communication with the remote server: | |
| − | |||
| − | + | [[Image:MarkerAnnotations_Controls.png|{{ImageMaxWidth}}]] | |
| − | |||
| − | |||
| − | |||
| + | While the information is being retrieved, a progress bar will be shown. | ||
| − | + | [[Image:MarkerAnnotations_ProgressBar.png]] | |
| − | + | ==Pathway and Gene Annotations== | |
| + | The "Annotations" tab presents a summary listing of the annotations retrieved from bioDBnet: | ||
| + | [[Image:MarkerAnnotations_Results.png|{{ImageMaxWidth}}]] | ||
| − | + | The listing contains at least one row for each gene which annotation information is available for. If a gene is associated with more than one pathways, then one row for every pathway is listed (e.g., as is the case above for STAT3). Every row displays the marker (i.e., probeset) id, the corresponding gene name and the name of the associated pathway. | |
| − | + | Right-clicking on a gene name shows the following menu options. Each will link to the named data source to display gene information in your browser: | |
| − | |||
| − | |||
| + | [[Image:MarkerAnnotations_Gene_Menu.png]] | ||
| − | + | * '''Go to Entrez for ''gene name''''' | |
| + | * '''Go to CGAP for ''gene name''''' | ||
| + | * '''Go to GeneCards for ''gene name''''' | ||
| − | |||
| − | + | Right-clicking on a pathway brings up a popup menu offering the following options: | |
| − | |||
| − | + | [[Image:MarkerAnnotations_Pathway_Menu.png]] | |
| + | * '''View Diagram''': available only for BioCarta pathways. geWorkbench generates a diagram of the pathway based on the BioCarta description. Selecting the "View Diagram" option will display this diagram within the "Pathway" tab. | ||
| + | * '''View Diagram on BioCarta site''' - View the BioCarta diagram in your browser directly on the BioCarta website. | ||
| + | * '''Add pathway genes to set''': extracts the pathway genes for which there are associated probes in the microarray set currently selected by the user and places all such probes in a new marker set within the "Markers" component (by default, the marker set is named after the pathway). | ||
| + | * '''Export genes to CSV''': creates a new text file containing a listing of all pathway genes. The file format (csv = comma separated values) is compatible with Microsoft Excel. | ||
| + | The export file contains the following columns: | ||
| + | * Marker | ||
| + | * Gene | ||
| + | * Entrez GeneId | ||
| + | * Pathway | ||
| + | * Entrez URL | ||
| + | * CGAP URL | ||
| + | * GeneCards URL | ||
| − | + | [[Image:MarkerAnnotations_h_erkPathway.png]] | |
| − | |||
| − | + | A BioCarta pathway image is displayed above after selecting the "View Diagram" option from the "Annotations" tab. | |
| + | * '''pathway dropdown box''' - The drop-down box, on the top left corner above the diagram, shows the name of the currently displayed diagram. The component keeps a history of all BioCarta diagrams selected by the user; using the drop-down it is possible to switch among the corresponding pathway images. | ||
| + | * '''Clear Diagram''' - this button clears the currently displayed diagram. | ||
| + | * '''Clear History''' - this button clears the currently displayed diagram and removes all pathway history information from the pathway name drop-down box. | ||
| + | * '''Image Snapshot''' - save a snapshot of the diagram to the [[Workspace]]. | ||
| − | + | ==References== | |
| + | Mudunuri,U., Che,A., Yi,M. and Stephens,R.M. (2009) bioDBnet: the biological database network. Bioinformatics, 25, 555-556. [http://www.ncbi.nlm.nih.gov/pubmed/19129209 link to paper] | ||
| − | |||
| + | [http://www.biocarta.com BioCarta] | ||
| − | [ | + | [http://www.biocarta.com/legal/terms.asp Biocarta Terms of Use] |
Latest revision as of 18:27, 22 January 2014
|
Home | Quick Start | Basics | Menu Bar | Preferences | Component Configuration Manager | Workspace | Information Panel | Local Data Files | File Formats | caArray | Array Sets | Marker Sets | Microarray Dataset Viewers | Filtering | Normalization | Tutorial Data | geWorkbench-web Tutorials |
Analysis Framework | ANOVA | ARACNe | BLAST | Cellular Networks KnowledgeBase | CeRNA/Hermes Query | Classification (KNN, WV) | Color Mosaic | Consensus Clustering | Cytoscape | Cupid | DeMAND | Expression Value Distribution | Fold-Change | Gene Ontology Term Analysis | Gene Ontology Viewer | GenomeSpace | genSpace | Grid Services | GSEA | Hierarchical Clustering | IDEA | Jmol | K-Means Clustering | LINCS Query | Marker Annotations | MarkUs | Master Regulator Analysis | (MRA-FET Method) | (MRA-MARINa Method) | MatrixREDUCE | MINDy | Pattern Discovery | PCA | Promoter Analysis | Pudge | SAM | Sequence Retriever | SkyBase | SkyLine | SOM | SVM | T-Test | Viper Analysis | Volcano Plot |
Overview
The Marker Annotations component enables the retrieval of biological annotation information for a collection of genes. For every gene, the following data can be retrieved:
- Links to gene detail pages.
- A set of pathways containing the gene.
All annotations are retrieved from remote servers maintained by the National Cancer Institute (NCI) bioDBnet resource of the Advanced Biomedical Computing Center (NCI Frederick).
Submit Query
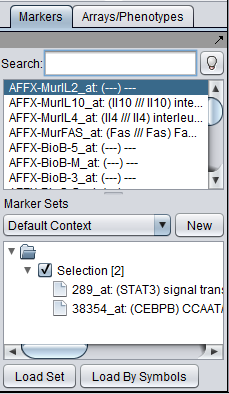
The Marker Annotations module will retrieve information for all markers that belong to activated marker sets, or, more precisely, for the genes corresponding to those markers:
E.g., in the example shown above, information will be retrieved about the genes STAT3 and CEBPB. Clicking the "Retrieve Annotations" button initiates the communication with the remote server:
While the information is being retrieved, a progress bar will be shown.
Pathway and Gene Annotations
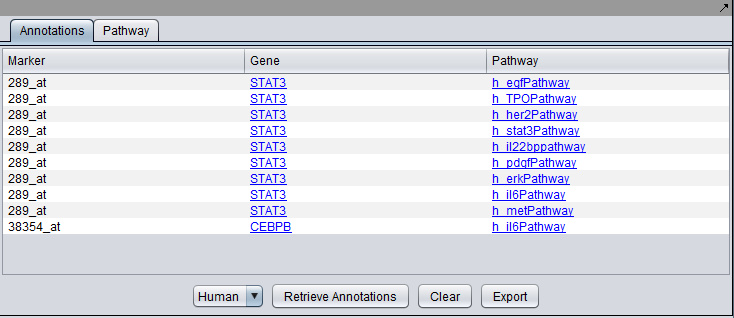
The "Annotations" tab presents a summary listing of the annotations retrieved from bioDBnet:
The listing contains at least one row for each gene which annotation information is available for. If a gene is associated with more than one pathways, then one row for every pathway is listed (e.g., as is the case above for STAT3). Every row displays the marker (i.e., probeset) id, the corresponding gene name and the name of the associated pathway.
Right-clicking on a gene name shows the following menu options. Each will link to the named data source to display gene information in your browser:
- Go to Entrez for gene name
- Go to CGAP for gene name
- Go to GeneCards for gene name
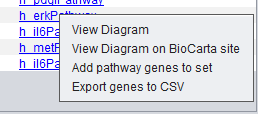
Right-clicking on a pathway brings up a popup menu offering the following options:
- View Diagram: available only for BioCarta pathways. geWorkbench generates a diagram of the pathway based on the BioCarta description. Selecting the "View Diagram" option will display this diagram within the "Pathway" tab.
- View Diagram on BioCarta site - View the BioCarta diagram in your browser directly on the BioCarta website.
- Add pathway genes to set: extracts the pathway genes for which there are associated probes in the microarray set currently selected by the user and places all such probes in a new marker set within the "Markers" component (by default, the marker set is named after the pathway).
- Export genes to CSV: creates a new text file containing a listing of all pathway genes. The file format (csv = comma separated values) is compatible with Microsoft Excel.
The export file contains the following columns:
- Marker
- Gene
- Entrez GeneId
- Pathway
- Entrez URL
- CGAP URL
- GeneCards URL
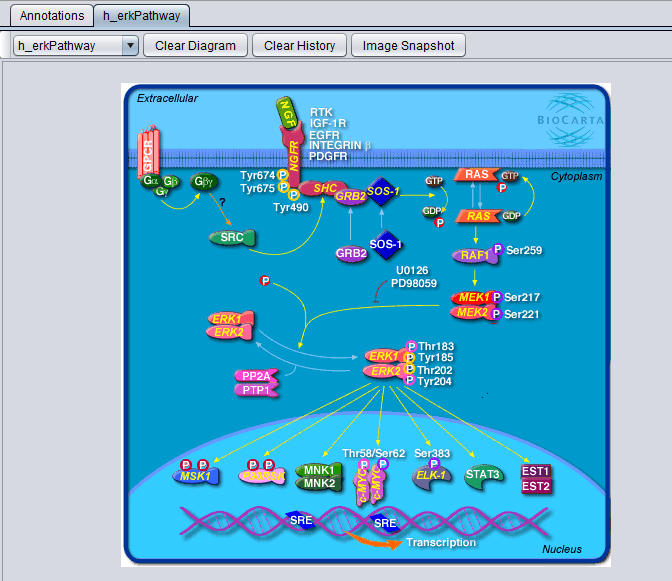
A BioCarta pathway image is displayed above after selecting the "View Diagram" option from the "Annotations" tab.
- pathway dropdown box - The drop-down box, on the top left corner above the diagram, shows the name of the currently displayed diagram. The component keeps a history of all BioCarta diagrams selected by the user; using the drop-down it is possible to switch among the corresponding pathway images.
- Clear Diagram - this button clears the currently displayed diagram.
- Clear History - this button clears the currently displayed diagram and removes all pathway history information from the pathway name drop-down box.
- Image Snapshot - save a snapshot of the diagram to the Workspace.
References
Mudunuri,U., Che,A., Yi,M. and Stephens,R.M. (2009) bioDBnet: the biological database network. Bioinformatics, 25, 555-556. link to paper


