Difference between revisions of "Promoter Analysis"
(→The LOGO display) |
(→Prerequisites) |
||
| (111 intermediate revisions by 2 users not shown) | |||
| Line 1: | Line 1: | ||
{{TutorialsTopNav}} | {{TutorialsTopNav}} | ||
| − | |||
| − | |||
=Overview= | =Overview= | ||
| Line 10: | Line 8: | ||
=JASPAR CORE database= | =JASPAR CORE database= | ||
| − | The | + | The promoter component of geWorkbench includes the JASPAR CORE database (Bryne 2008, Sandelin 2004) ([http://jaspar.genereg.net/ http://jaspar.genereg.net/]). As of the October 2009 release, it contains 459 curated, non-redundant profiles. These "profiles are derived from published collections of experimentally defined transcription factor binding sites for multi-cellular eukaryotes. The database represents a curated collection of target sequences" ([http://jaspar.genereg.net/html/TEMPLATES/help.html JASPAR Documentation]). |
| − | |||
| − | The profiles | + | The profiles represent counts of how many times each of the four nucleotide bases occurs at a particular position in the aligned promoter sequences. |
=Working with the Promoter graphical interface= | =Working with the Promoter graphical interface= | ||
| + | |||
| + | ==Prerequisites== | ||
| + | * To use the Promoter component, first check that it has been loaded in the Component Configuration Manager. | ||
| + | * The Promoter component appears when a data node of type "sequence" has been loaded in the [[Workspace]]. | ||
| + | * The Promoter component appears in the upper-right quadrant of geWorkbench, in the "Visual Area". | ||
==Layout== | ==Layout== | ||
| − | The figure shows the display of profile "TBP:TATA-box:MA0108" from the list of those included in JASPAR. | + | The figure shows the display of profile "TBP:TATA-box:MA0108" from the list of those included in JASPAR. The main features of the component include |
| + | * The '''TF Mapping''' tab at left. This area allows profiles to be searched for and selected for use in a sequence scan. | ||
| + | * The '''Logo''', '''Parameters''' and '''Sequence''' tabs at right. These provide respectively visual display of the profile, the parameters, and the scan results. | ||
| + | * Control buttons at bottom left to manage scans and results. | ||
| + | |||
| + | [[Image:Promoter_Logo_TBP.png|{{ImageMaxWidth}}]] | ||
| + | |||
| + | |||
| + | Further details of each part of the component are provided below. | ||
| + | |||
| + | ==TF Mapping tab== | ||
| + | |||
| + | ===List of available transcription factors=== | ||
| + | |||
| + | ====TF list==== | ||
| + | The TF list contains the names of available transcription factor binding site sequence profiles from JASPAR. Double-click on TF signatures in the TF list box (upper box) to add TF's to the Selected TF list (lower box). This lower list displays transcription factors which can be searched against the available genomic sequences by clicking on '''Scan'''. Double-clicking on a TF name clears it from the Selected TF list and returns it to the TF List. | ||
| + | |||
| + | The information displayed in the list contains the following fields from Jaspar, separated by colons: | ||
| + | |||
| + | TF Name:family:Jaspar identifier | ||
| + | |||
| + | |||
| + | Multiple profiles can be moved to the selected list for scanning. | ||
| + | |||
| + | ====Search==== | ||
| + | Searches for any portion of the text displayed in the list. The search is progressive. As each character is entered, the list is updated to display only those entries containing a match to the current search string. | ||
| + | |||
| + | ====Taxa pulldown menu==== | ||
| + | |||
| + | The list of displayed TFs can be restricted to a certain taxa. Taxa assignments are obtained from the Jaspar motif files. | ||
| + | |||
| + | |||
| + | [[Image:Promoter_Taxa_Pulldown.png]] | ||
| + | |||
| + | ===Selected TF=== | ||
| + | |||
| + | This list contains the profiles that will be used in the next scan. Entries on the Selected TF list can be moved back up to the "available TFs" list by again double-clicking on their entry. | ||
| + | |||
| + | Here the motif for TBP (class: Beta-sheet, family: TATA-binding) entry has been moved to the selected list. | ||
| + | |||
| + | [[Image:Promoter_TBP_selected.png]] | ||
| + | |||
| + | ===Controls=== | ||
| + | ====Scan==== | ||
| + | Scans the sequences in the Selected TF list against the available genomic sequences. If the Selected TF list is empty, the system displays an error message. | ||
| + | |||
| + | ====Add TF==== | ||
| + | The profile should consist of a tab delimited series of counts, one for each position in the profile (JASPAR format). It should could four lines, in the order A, C, G, T. There are no header lines or row labels, just the numeric matrix. For example, here is a profile showing the first six columns: | ||
| + | |||
| + | 0 12 0 0 1 0 | ||
| + | |||
| + | 49 0 20 23 3 45 | ||
| − | + | 0 37 29 2 45 4 | |
| − | + | 0 0 0 25 0 0 | |
| − | + | Because the normalization step uses the count total (sequences aligned to generate the profile), loading a frequency matrix is not currently supported. | |
| − | + | New profiles are loaded for the current session of geWorkbench only; they will not persist when geWorkbench is restarted. | |
| − | + | ====Save==== | |
| + | Saves to file a list of hits by a profile to a nucleotide sequence, including the sequence identifier, the transcription factor name and the start and stop points of the match along the sequence, as shown here: | ||
| − | + | gi|65508003 | |
| − | + | ATHB5:HOMEO-ZIP:MA0110 2104 2113 | |
| − | + | ATHB5:HOMEO-ZIP:MA0110 2115 2106 | |
| − | + | ATHB5:HOMEO-ZIP:MA0110 2882 2891 | |
| − | Stop | + | ATHB5:HOMEO-ZIP:MA0110 2893 2884 |
| + | |||
| + | |||
| + | ====Retrieve==== | ||
| + | Not currently available. This button is disabled. | ||
| + | |||
| + | ====Stop'''==== | ||
| + | Stop the current scan. | ||
==The LOGO tab== | ==The LOGO tab== | ||
===LOGO display=== | ===LOGO display=== | ||
| − | The LOGO display implements the method of Schneider to display the information at each position in a motif. Briefly, the total height of the column of letters at a position shows the information available, on a scale of 0 to 2 bits (the information needed to represent the 4 possible nucleotide bases at each position). The relative heights of each letter in a column show their individual contribution to the information at that position. | + | The LOGO display implements the method of Schneider and Stephens (1990) to display the information at each position in a motif. Briefly, the total height of the column of letters at a position shows the information available, on a scale of 0 to 2 bits (the information needed to represent the 4 possible nucleotide bases at each position). The relative heights of each letter in a column show their individual contribution to the information at that position. |
The LOGO display in geWorkbench implements the "small sample correction" described by Schneider, the magnitude of which depends on the number of sequences aligned to generate the profile. The correction is subtracted from the calculated information content at each position, with a minimum value (floor) of zero being displayed. | The LOGO display in geWorkbench implements the "small sample correction" described by Schneider, the magnitude of which depends on the number of sequences aligned to generate the profile. The correction is subtracted from the calculated information content at each position, with a minimum value (floor) of zero being displayed. | ||
| Line 53: | Line 114: | ||
A table is used to show the numeric data from which the LOGO diagram is generated. The table depicts each position in the profile as a column, and has a row for each of the four nucleotide bases A, C, G and T. The user can choose to display the data either as the original counts or as frequencies. | A table is used to show the numeric data from which the LOGO diagram is generated. The table depicts each position in the profile as a column, and has a row for each of the four nucleotide bases A, C, G and T. The user can choose to display the data either as the original counts or as frequencies. | ||
| − | * Display | + | ====Display==== |
| + | * Counts - Display the original counts of the four nucleotide bases at each position in the motif. | ||
| + | * Frequencies - Display the frequency of each base at each position in the motif. | ||
==The Parameters tab== | ==The Parameters tab== | ||
| − | [[Image: | + | [[Image:Promoter_Parameters_initial.png]] |
| + | |||
| + | ===Background sequence and scoring threshold determination=== | ||
| + | |||
| + | A background sequence is used to estimate an appropriate scoring threshold. This background can be generated in two ways. | ||
| + | # determine base composition of input sequence and from this generate random sequence. | ||
| + | # (13K) - use a set of 13,000 promoter sequences as background (obtained from the PRIMA homepage http://acgt.cs.tau.ac.il/prima/). | ||
| + | |||
| + | * The length of background sequence scanned is given by 1000*Iterations/PValue. | ||
| + | |||
| + | * Simplified description of choosing the threshold: | ||
| + | ** The threshold value is calculated by scanning the background sequence with the profile and storing the top 2000 scores. | ||
| + | ** The score in the 100th position below the top score is used as the threshold, subject to correction for duplicate scores. | ||
| + | |||
| + | * Calculated p-values are Bonferroni corrected. | ||
| + | |||
| + | * Positive and negative strands are scanned and values above threshold are reported. | ||
| + | |||
| + | ===Parameters=== | ||
| + | * PValue / 1K - | ||
| + | * Use Thr. - Use threshold - if checked, use a user-input threshold rather than a calculated threshold for scoring a match. | ||
| + | * 13K Set - If not checked (default), use the random background sequence described above. If checked, use the 13K sequences as background. | ||
| + | * Iterations - | ||
| + | * Pseudocount - a small-sample correction factor (default 1.0). See discussion below. | ||
| + | ** Sqrt(n) - if checked, set the pseudocount to be the square root of (n). This option is not recommended, see discussion below. | ||
| + | |||
| + | ===Results=== | ||
| + | ====Total hits and Sequences with hits==== | ||
| + | Total hits counts all hits regardless of how many times one sequence is hit. | ||
| + | * Expected - number of hits expected by chance. | ||
| + | * Actual - observed number of hits. | ||
| + | * Enrich. p-value - p-value for chance of getting this outcome by chance. | ||
| + | * % with hits | ||
| + | |||
| + | ====5' hits and 3'hits==== | ||
| + | * Expected - Expected number of hits | ||
| + | * Actual - Actual number of hits. | ||
| + | |||
| + | ==The Sequence tab== | ||
| + | |||
| + | |||
| + | [[Image:Promoter_Result_CDH2_Sequence_View.png|{{ImageMaxWidth}}]] | ||
| + | |||
| + | |||
| + | [[Image:Promoter_Result_CDH2_Sequence_View_hover.png]] | ||
| + | |||
| + | |||
| + | |||
| + | The Sequence tab can display either a line or a full character representation of the sequence which was searched against. Clicking on a position along the line or character representation will cause that portion of the sequence to be displayed in the detail box at the bottom of the component. This box also displays numbers representing position along the sequence, relative to the start of that particular sequence (not its genomic location). Both the character and detail views will show the location and extent of any profile match to the sequence. | ||
| + | |||
| + | If matches are found, the sequence will include blocks in various colors (each motif will be represented by a unique color) with solid arrows indicating the match orientation (forward or reverse complement). Individual hits can be identified by positioning the mouse pointer over them, which will display a tool tip. Clicking on an area with a match will show it in the Sequence Detail at the bottom with the hits shown as boxes around the characters. | ||
| + | |||
| + | The tooltip format is as follows: numeric position, Transcription Factor name <numeric position of the first character of the pattern, numeric position of last matching pattern character>. | ||
| + | |||
| + | * '''View''' - '''Line''' or '''Full Sequence'''. Line represents the sequence as a simple line, with any hits positioned along it. Full shows the entire sequence as characters. | ||
| + | * '''Show Patterns''' - display hits from Pattern Discovery (this is a separate component, not part of the Promoter component). Implementation note - these hits are represented in the "Active Patterns" data-structure. | ||
| + | * '''Show TFs''' - show hits from a search in this component. Implementation note - these hits are represented in the "Active TFs" data-structure. | ||
| + | * '''Clear All''' - clear all hits from the sequence window (and from the associated data structures). Note this will also clear the two adjacent check boxes. The relevant box must be re-checked to see further results. | ||
| + | |||
| + | |||
| + | The full character display shows any hits in white with a colored border, and a small red arrow marks the start of the match and its direction. Each motif is represented by a unique color. | ||
| + | |||
| + | [[image:Promoter_Result_CDH2_Sequence_View_Full.png]] | ||
| + | |||
| + | |||
| + | ===Implementation details=== | ||
| + | # Each time that a transcription factor (TF) matching operation is run, the "Active TFs" data structure is *AUGMENTED* with the results of the discovery operation (i.e., contents due to previous runs are maintained). The "Active TFs" data structure is not affected by pattern discovery. | ||
| + | # Each time that a Pattern Discovery analysis is run, the contents of the "active patterns" structure are *REPLACED* with the results of the discovery operation (i.e., contents due to previous runs are cleared). | ||
| + | |||
| + | =Scan Implementation= | ||
| + | |||
| + | ==Normalization and the Pseudocount== | ||
| + | The count matrices are normalized to frequencies using an algorithm which includes a "'''pseudocount'''" ([http://www.ncbi.nlm.nih.gov/pubmed/19106141 see Nishida 2009]). The pseudocount is a way to compensate for the effects of small sample sizes in the original observations used to generate the profiles. Nishida et al. studied how to determine an appropriate value for the pseudocount. They found that the optimal values were independent of the sample size and were correlated with the entropy of the original matrices. They say that this implies that the less-conserved the binding site, the larger a value should be used for the pseudocount. They find that 0.8 is a good value "for practical uses". They do not recommend use of the square root of the total count. | ||
| + | |||
| + | geWorkbench allows a pseudocount factor to be directly entered, or it can be selected to be the square root of the total count of sequences used to generate the profile. Prior to geWorkbench 1.8.0, setting the pseudocount to the square root of the total counts was directly coded and not changeable. The current default is to set the pseudocount equal to 1.0. | ||
| + | |||
| + | The normalization forumula used in calculating frequencies is then, where b is the pseudocount, and counts(i, j) is the observed count in a particular entry in the matrix, | ||
| + | |||
| + | freq(i, j) = (counts(i, j) + b/4) / (totalCounts + b). | ||
| + | |||
| + | |||
| + | The resulting frequency matrix is used in the subsequent scan. | ||
| + | |||
| + | Because the pseudocount is a settable parameter, the frequency matrix is recalculated for each scan from the original counts. | ||
| + | |||
| + | ==Scoring== | ||
| + | |||
| + | * Calculated p-values are Bonferroni corrected and also corrected for duplicates in the list of 100 top scores found during the background scan. | ||
| + | |||
| + | * Positive and negative strands are scanned and values above threshold are reported. | ||
| + | |||
| + | =Example: Running and viewing a scan= | ||
| + | |||
| + | ==Prerequisites== | ||
| + | The Promoter component is only available when a sequence has been loaded, either from disk or for example using the Sequence Retriever component to obtain genomic sequence. | ||
| + | |||
| + | For this example, we will obtain upstream genomic sequence for CDH2, the N-Cadherin gene. However, using the Sequence Retriever component requires that a microarray dataset and its annotations be loaded. Here, we will use the JB-ccmp_0120.txt file, which is an Affymetrix HG-U95Av2 '''MAS5''' format text file and is part of the geWorkbench distribution example data, found in data\cardiogenomics.med.harvard.edu. | ||
| + | |||
| + | The Affymetrix HG-U95Av2 annotation file can be obtain from the Affymetrix website. Please see instructions on the [http://wiki.c2b2.columbia.edu/workbench/index.php/FAQ#Q._Where_can_I_obtain_the_latest_annotation_files_for_my_microarray_platform.3F geWorkbench FAQ]. | ||
| + | |||
| + | 1. In the [[Workspace]], load the file JB-ccmp_0120.txt as type MAS5/GCOS. | ||
| + | |||
| + | 2. When prompted, associate the HG-U95Av2 annotation file. | ||
| + | |||
| + | 3. In the Markers component, search for the gene "CDH2". On this chip type, marker 2053_at represents the CDH2 gene. | ||
| + | |||
| + | 4. You can double-click on the marker to add it to the default "Selection" set. Or you can right-click on it and add it to a named set, such as "Cadherins". This is depicted below. | ||
| + | |||
| + | 5. "Activate" (check the box next to) the set to which you added the marker. | ||
| + | |||
| + | [[Image:Markers_Set_CDH2.png]] | ||
| + | |||
| + | 6. Any activated markers will appear in the Sequence Retriever component, as shown below. | ||
| + | |||
| + | 7. Set the retrieval limits to 2000 base pairs up- and downstream from the transcription start site. | ||
| + | |||
| + | 8. Make sure the retrieval type is set to DNA, UCSC (the Santa Cruz genome sequence database). | ||
| + | |||
| + | 9. Click "'''Get Sequence'''". When prompted, select the human genome build. | ||
| + | |||
| + | [[Image:Sequence_Retriever_CDH2.png|{{ImageMaxWidth}}]] | ||
| + | |||
| + | 10. Once the sequence has been retrieved, check the box next to the sequence and then hit the button "Add to Workspace". You will be prompted to enter a name for the sequence. We now have the genomic sequence available for other components to use. | ||
| + | [[Image:Promoter_example_in_Workspace.png]] | ||
| − | + | ==Running the scan== | |
| − | + | 1. In the Promoter component, search for "ap2", which corresponds to transcription factor activator protein 2 alpha. | |
| − | + | 2. Double-click on the TFAP2A entry to move it down to the search list. | |
| − | |||
| − | |||
| − | |||
| + | [[Image:Promoter_CDH2_AP2_2000updn_setup_logo.png|{{ImageMaxWidth}}]] | ||
| + | |||
| + | 3. Hit the "'''Scan'''" button. The result is displayed in the '''Sequence''' tab of the Promoter component as shown here. | ||
| + | |||
| + | [[Image:Promoter_Result_CDH2_Sequence_View.png|{{ImageMaxWidth}}]] | ||
| + | |||
| + | 4. Setting the View to Full Sequence shows the hits in white on the sequence. Red arrows indicate whether the hit is to the forward (right arrow) or reverse (complementary) (left-arrow) strand. | ||
| + | |||
| + | [[Image:Promoter_Result_CDH2_Sequence_View_Full.png]] | ||
| + | |||
| + | 5. The parameters tab displays the actual threshold values calculated during the run, and displays the enrichment results. | ||
| − | |||
| − | |||
| − | + | [[Image:Promoter_Result_CDH2_Parameter_View.png|{{ImageMaxWidth}}]] | |
| − | Vlieghe D, Sandelin A, De Bleser PJ, Vleminckx K, Wasserman WW, van Roy F, Lenhard B. (2006) A new generation of JASPAR, the open-access repository for transcription factor binding site profiles. | + | =References= |
| − | Nucleic Acids Res. Jan 1;34(Database issue):D95-7. | + | * Bryne JC, Valen E, Tang MH, Marstrand T, Winther O, da Piedade I, Krogh A, Lenhard B, Sandelin A. (2008) JASPAR, the open access database of transcription factor-binding profiles: new content and tools in the 2008 update. Nucleic Acids Res. 36(Database issue):D102-6. |
| + | * Lawrence and Reilly (1990) Searching putative regulatory sequences against a collection of known transcription factor DNA-binding signatures represented as a position weight matrices (PWMs) (citation unknown). See perhaps: Lawrence, C. and Reilly, A. (1990). An expectation maximization (EM) algorithm for the identification and characterization of common sites in unaligned biopolymer sequences. Proteins, 7 (1), 41-51. [http://www.ncbi.nlm.nih.gov/pubmed/2184437 Link to Abstract] | ||
| + | * Nishida K, Frith MC, Nakai K. (2009) Pseudocounts for transcription factor binding sites. Nucleic Acids Res. Feb;37(3):939-44. [http://www.ncbi.nlm.nih.gov/pubmed/19106141 link to paper] | ||
| + | * Sandelin A, Alkema W, Engstrom P, Wasserman WW, Lenhard B. (2004) JASPAR: an open-access database for eukaryotic transcription factor binding profiles. Nucleic Acids Res. Jan 1;32(Database issue):D91-4 ([http://www.ncbi.nlm.nih.gov/entrez/query.fcgi?cmd=Retrieve&db=pubmed&dopt=Abstract&list_uids=14681366&query_hl=6 link to paper]). | ||
| + | * Schneider TD, Stephens RM. (1990) Sequence logos: a new way to display consensus sequences. Nucleic Acids Res. Oct 25;18(20):6097-100. ([http://www.ncbi.nlm.nih.gov/pubmed/2172928 link to paper]) | ||
| + | * Vlieghe D, Sandelin A, De Bleser PJ, Vleminckx K, Wasserman WW, van Roy F, Lenhard B. (2006) A new generation of JASPAR, the open-access repository for transcription factor binding site profiles. Nucleic Acids Res. Jan 1;34(Database issue):D95-7. | ||
Latest revision as of 19:19, 22 January 2014
|
Home | Quick Start | Basics | Menu Bar | Preferences | Component Configuration Manager | Workspace | Information Panel | Local Data Files | File Formats | caArray | Array Sets | Marker Sets | Microarray Dataset Viewers | Filtering | Normalization | Tutorial Data | geWorkbench-web Tutorials |
Analysis Framework | ANOVA | ARACNe | BLAST | Cellular Networks KnowledgeBase | CeRNA/Hermes Query | Classification (KNN, WV) | Color Mosaic | Consensus Clustering | Cytoscape | Cupid | DeMAND | Expression Value Distribution | Fold-Change | Gene Ontology Term Analysis | Gene Ontology Viewer | GenomeSpace | genSpace | Grid Services | GSEA | Hierarchical Clustering | IDEA | Jmol | K-Means Clustering | LINCS Query | Marker Annotations | MarkUs | Master Regulator Analysis | (MRA-FET Method) | (MRA-MARINa Method) | MatrixREDUCE | MINDy | Pattern Discovery | PCA | Promoter Analysis | Pudge | SAM | Sequence Retriever | SkyBase | SkyLine | SOM | SVM | T-Test | Viper Analysis | Volcano Plot |
Contents
Overview
The Promoter component scans one or more sequence profiles against nucleotide sequences that the user has loaded into geWorbench. Motifs from the JASPAR database of transcription factor binding sites are included with the component. Additional motifs can be added by the user.
The Promoter component will also display the results of hits found in the Pattern Discovery component.
JASPAR CORE database
The promoter component of geWorkbench includes the JASPAR CORE database (Bryne 2008, Sandelin 2004) (http://jaspar.genereg.net/). As of the October 2009 release, it contains 459 curated, non-redundant profiles. These "profiles are derived from published collections of experimentally defined transcription factor binding sites for multi-cellular eukaryotes. The database represents a curated collection of target sequences" (JASPAR Documentation).
The profiles represent counts of how many times each of the four nucleotide bases occurs at a particular position in the aligned promoter sequences.
Working with the Promoter graphical interface
Prerequisites
- To use the Promoter component, first check that it has been loaded in the Component Configuration Manager.
- The Promoter component appears when a data node of type "sequence" has been loaded in the Workspace.
- The Promoter component appears in the upper-right quadrant of geWorkbench, in the "Visual Area".
Layout
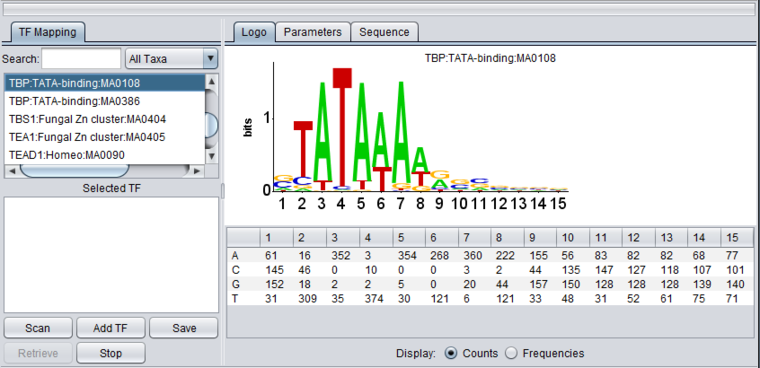
The figure shows the display of profile "TBP:TATA-box:MA0108" from the list of those included in JASPAR. The main features of the component include
- The TF Mapping tab at left. This area allows profiles to be searched for and selected for use in a sequence scan.
- The Logo, Parameters and Sequence tabs at right. These provide respectively visual display of the profile, the parameters, and the scan results.
- Control buttons at bottom left to manage scans and results.
Further details of each part of the component are provided below.
TF Mapping tab
List of available transcription factors
TF list
The TF list contains the names of available transcription factor binding site sequence profiles from JASPAR. Double-click on TF signatures in the TF list box (upper box) to add TF's to the Selected TF list (lower box). This lower list displays transcription factors which can be searched against the available genomic sequences by clicking on Scan. Double-clicking on a TF name clears it from the Selected TF list and returns it to the TF List.
The information displayed in the list contains the following fields from Jaspar, separated by colons:
TF Name:family:Jaspar identifier
Multiple profiles can be moved to the selected list for scanning.
Search
Searches for any portion of the text displayed in the list. The search is progressive. As each character is entered, the list is updated to display only those entries containing a match to the current search string.
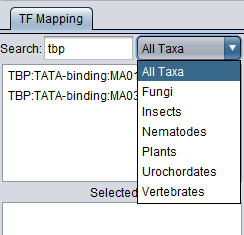
The list of displayed TFs can be restricted to a certain taxa. Taxa assignments are obtained from the Jaspar motif files.
Selected TF
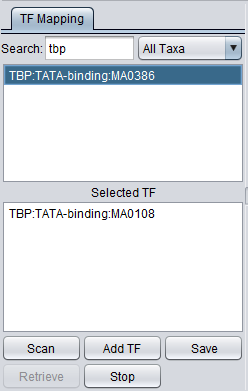
This list contains the profiles that will be used in the next scan. Entries on the Selected TF list can be moved back up to the "available TFs" list by again double-clicking on their entry.
Here the motif for TBP (class: Beta-sheet, family: TATA-binding) entry has been moved to the selected list.
Controls
Scan
Scans the sequences in the Selected TF list against the available genomic sequences. If the Selected TF list is empty, the system displays an error message.
Add TF
The profile should consist of a tab delimited series of counts, one for each position in the profile (JASPAR format). It should could four lines, in the order A, C, G, T. There are no header lines or row labels, just the numeric matrix. For example, here is a profile showing the first six columns:
0 12 0 0 1 0
49 0 20 23 3 45
0 37 29 2 45 4
0 0 0 25 0 0
Because the normalization step uses the count total (sequences aligned to generate the profile), loading a frequency matrix is not currently supported.
New profiles are loaded for the current session of geWorkbench only; they will not persist when geWorkbench is restarted.
Save
Saves to file a list of hits by a profile to a nucleotide sequence, including the sequence identifier, the transcription factor name and the start and stop points of the match along the sequence, as shown here:
gi|65508003
ATHB5:HOMEO-ZIP:MA0110 2104 2113
ATHB5:HOMEO-ZIP:MA0110 2115 2106
ATHB5:HOMEO-ZIP:MA0110 2882 2891
ATHB5:HOMEO-ZIP:MA0110 2893 2884
Retrieve
Not currently available. This button is disabled.
Stop
Stop the current scan.
The LOGO tab
LOGO display
The LOGO display implements the method of Schneider and Stephens (1990) to display the information at each position in a motif. Briefly, the total height of the column of letters at a position shows the information available, on a scale of 0 to 2 bits (the information needed to represent the 4 possible nucleotide bases at each position). The relative heights of each letter in a column show their individual contribution to the information at that position.
The LOGO display in geWorkbench implements the "small sample correction" described by Schneider, the magnitude of which depends on the number of sequences aligned to generate the profile. The correction is subtracted from the calculated information content at each position, with a minimum value (floor) of zero being displayed.
Table display
A table is used to show the numeric data from which the LOGO diagram is generated. The table depicts each position in the profile as a column, and has a row for each of the four nucleotide bases A, C, G and T. The user can choose to display the data either as the original counts or as frequencies.
Display
- Counts - Display the original counts of the four nucleotide bases at each position in the motif.
- Frequencies - Display the frequency of each base at each position in the motif.
The Parameters tab
Background sequence and scoring threshold determination
A background sequence is used to estimate an appropriate scoring threshold. This background can be generated in two ways.
- determine base composition of input sequence and from this generate random sequence.
- (13K) - use a set of 13,000 promoter sequences as background (obtained from the PRIMA homepage http://acgt.cs.tau.ac.il/prima/).
- The length of background sequence scanned is given by 1000*Iterations/PValue.
- Simplified description of choosing the threshold:
- The threshold value is calculated by scanning the background sequence with the profile and storing the top 2000 scores.
- The score in the 100th position below the top score is used as the threshold, subject to correction for duplicate scores.
- Calculated p-values are Bonferroni corrected.
- Positive and negative strands are scanned and values above threshold are reported.
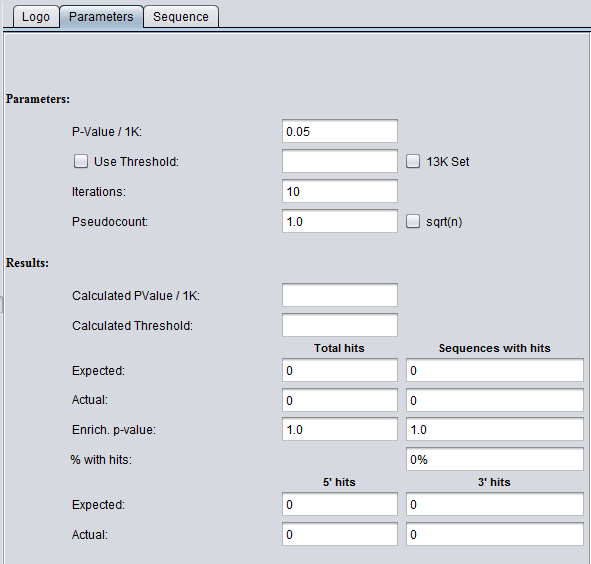
Parameters
- PValue / 1K -
- Use Thr. - Use threshold - if checked, use a user-input threshold rather than a calculated threshold for scoring a match.
- 13K Set - If not checked (default), use the random background sequence described above. If checked, use the 13K sequences as background.
- Iterations -
- Pseudocount - a small-sample correction factor (default 1.0). See discussion below.
- Sqrt(n) - if checked, set the pseudocount to be the square root of (n). This option is not recommended, see discussion below.
Results
Total hits and Sequences with hits
Total hits counts all hits regardless of how many times one sequence is hit.
- Expected - number of hits expected by chance.
- Actual - observed number of hits.
- Enrich. p-value - p-value for chance of getting this outcome by chance.
- % with hits
5' hits and 3'hits
- Expected - Expected number of hits
- Actual - Actual number of hits.
The Sequence tab
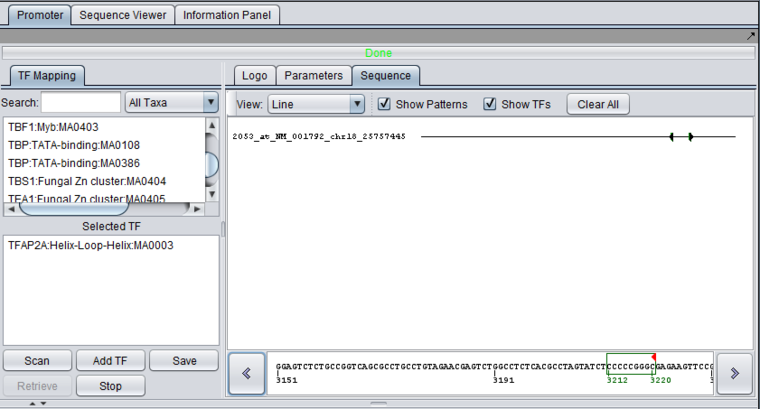
The Sequence tab can display either a line or a full character representation of the sequence which was searched against. Clicking on a position along the line or character representation will cause that portion of the sequence to be displayed in the detail box at the bottom of the component. This box also displays numbers representing position along the sequence, relative to the start of that particular sequence (not its genomic location). Both the character and detail views will show the location and extent of any profile match to the sequence.
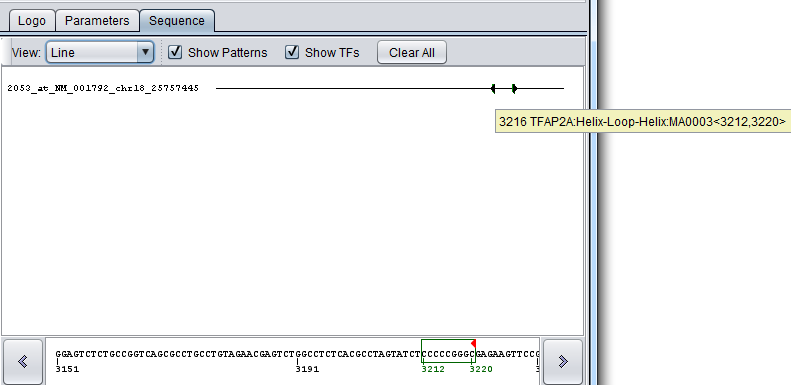
If matches are found, the sequence will include blocks in various colors (each motif will be represented by a unique color) with solid arrows indicating the match orientation (forward or reverse complement). Individual hits can be identified by positioning the mouse pointer over them, which will display a tool tip. Clicking on an area with a match will show it in the Sequence Detail at the bottom with the hits shown as boxes around the characters.
The tooltip format is as follows: numeric position, Transcription Factor name <numeric position of the first character of the pattern, numeric position of last matching pattern character>.
- View - Line or Full Sequence. Line represents the sequence as a simple line, with any hits positioned along it. Full shows the entire sequence as characters.
- Show Patterns - display hits from Pattern Discovery (this is a separate component, not part of the Promoter component). Implementation note - these hits are represented in the "Active Patterns" data-structure.
- Show TFs - show hits from a search in this component. Implementation note - these hits are represented in the "Active TFs" data-structure.
- Clear All - clear all hits from the sequence window (and from the associated data structures). Note this will also clear the two adjacent check boxes. The relevant box must be re-checked to see further results.
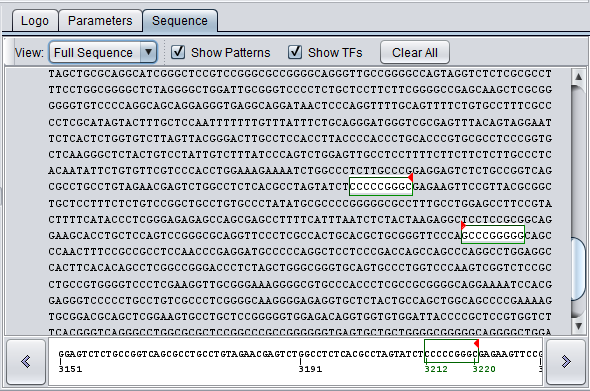
The full character display shows any hits in white with a colored border, and a small red arrow marks the start of the match and its direction. Each motif is represented by a unique color.
Implementation details
- Each time that a transcription factor (TF) matching operation is run, the "Active TFs" data structure is *AUGMENTED* with the results of the discovery operation (i.e., contents due to previous runs are maintained). The "Active TFs" data structure is not affected by pattern discovery.
- Each time that a Pattern Discovery analysis is run, the contents of the "active patterns" structure are *REPLACED* with the results of the discovery operation (i.e., contents due to previous runs are cleared).
Scan Implementation
Normalization and the Pseudocount
The count matrices are normalized to frequencies using an algorithm which includes a "pseudocount" (see Nishida 2009). The pseudocount is a way to compensate for the effects of small sample sizes in the original observations used to generate the profiles. Nishida et al. studied how to determine an appropriate value for the pseudocount. They found that the optimal values were independent of the sample size and were correlated with the entropy of the original matrices. They say that this implies that the less-conserved the binding site, the larger a value should be used for the pseudocount. They find that 0.8 is a good value "for practical uses". They do not recommend use of the square root of the total count.
geWorkbench allows a pseudocount factor to be directly entered, or it can be selected to be the square root of the total count of sequences used to generate the profile. Prior to geWorkbench 1.8.0, setting the pseudocount to the square root of the total counts was directly coded and not changeable. The current default is to set the pseudocount equal to 1.0.
The normalization forumula used in calculating frequencies is then, where b is the pseudocount, and counts(i, j) is the observed count in a particular entry in the matrix,
freq(i, j) = (counts(i, j) + b/4) / (totalCounts + b).
The resulting frequency matrix is used in the subsequent scan.
Because the pseudocount is a settable parameter, the frequency matrix is recalculated for each scan from the original counts.
Scoring
- Calculated p-values are Bonferroni corrected and also corrected for duplicates in the list of 100 top scores found during the background scan.
- Positive and negative strands are scanned and values above threshold are reported.
Example: Running and viewing a scan
Prerequisites
The Promoter component is only available when a sequence has been loaded, either from disk or for example using the Sequence Retriever component to obtain genomic sequence.
For this example, we will obtain upstream genomic sequence for CDH2, the N-Cadherin gene. However, using the Sequence Retriever component requires that a microarray dataset and its annotations be loaded. Here, we will use the JB-ccmp_0120.txt file, which is an Affymetrix HG-U95Av2 MAS5 format text file and is part of the geWorkbench distribution example data, found in data\cardiogenomics.med.harvard.edu.
The Affymetrix HG-U95Av2 annotation file can be obtain from the Affymetrix website. Please see instructions on the geWorkbench FAQ.
1. In the Workspace, load the file JB-ccmp_0120.txt as type MAS5/GCOS.
2. When prompted, associate the HG-U95Av2 annotation file.
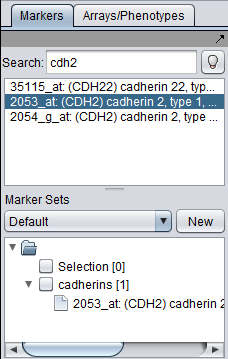
3. In the Markers component, search for the gene "CDH2". On this chip type, marker 2053_at represents the CDH2 gene.
4. You can double-click on the marker to add it to the default "Selection" set. Or you can right-click on it and add it to a named set, such as "Cadherins". This is depicted below.
5. "Activate" (check the box next to) the set to which you added the marker.
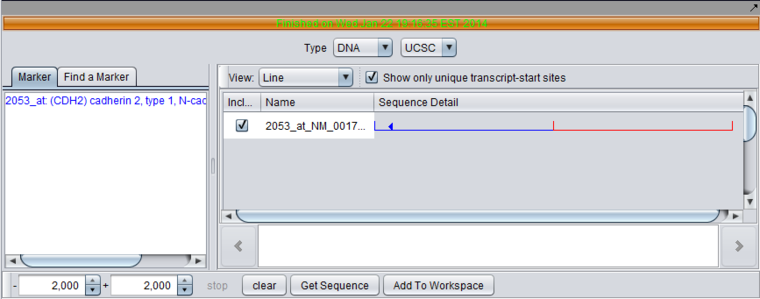
6. Any activated markers will appear in the Sequence Retriever component, as shown below.
7. Set the retrieval limits to 2000 base pairs up- and downstream from the transcription start site.
8. Make sure the retrieval type is set to DNA, UCSC (the Santa Cruz genome sequence database).
9. Click "Get Sequence". When prompted, select the human genome build.
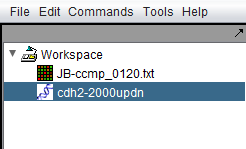
10. Once the sequence has been retrieved, check the box next to the sequence and then hit the button "Add to Workspace". You will be prompted to enter a name for the sequence. We now have the genomic sequence available for other components to use.
Running the scan
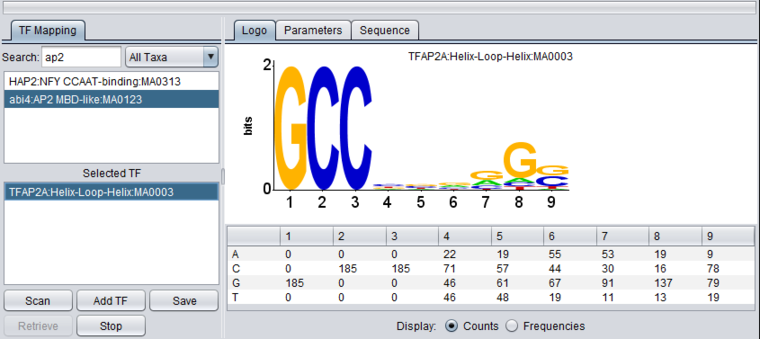
1. In the Promoter component, search for "ap2", which corresponds to transcription factor activator protein 2 alpha.
2. Double-click on the TFAP2A entry to move it down to the search list.
3. Hit the "Scan" button. The result is displayed in the Sequence tab of the Promoter component as shown here.
4. Setting the View to Full Sequence shows the hits in white on the sequence. Red arrows indicate whether the hit is to the forward (right arrow) or reverse (complementary) (left-arrow) strand.
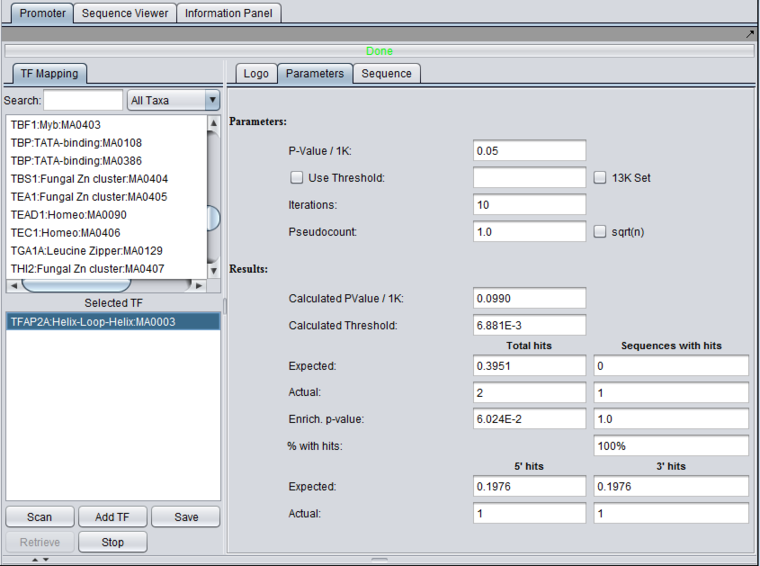
5. The parameters tab displays the actual threshold values calculated during the run, and displays the enrichment results.
References
- Bryne JC, Valen E, Tang MH, Marstrand T, Winther O, da Piedade I, Krogh A, Lenhard B, Sandelin A. (2008) JASPAR, the open access database of transcription factor-binding profiles: new content and tools in the 2008 update. Nucleic Acids Res. 36(Database issue):D102-6.
- Lawrence and Reilly (1990) Searching putative regulatory sequences against a collection of known transcription factor DNA-binding signatures represented as a position weight matrices (PWMs) (citation unknown). See perhaps: Lawrence, C. and Reilly, A. (1990). An expectation maximization (EM) algorithm for the identification and characterization of common sites in unaligned biopolymer sequences. Proteins, 7 (1), 41-51. Link to Abstract
- Nishida K, Frith MC, Nakai K. (2009) Pseudocounts for transcription factor binding sites. Nucleic Acids Res. Feb;37(3):939-44. link to paper
- Sandelin A, Alkema W, Engstrom P, Wasserman WW, Lenhard B. (2004) JASPAR: an open-access database for eukaryotic transcription factor binding profiles. Nucleic Acids Res. Jan 1;32(Database issue):D91-4 (link to paper).
- Schneider TD, Stephens RM. (1990) Sequence logos: a new way to display consensus sequences. Nucleic Acids Res. Oct 25;18(20):6097-100. (link to paper)
- Vlieghe D, Sandelin A, De Bleser PJ, Vleminckx K, Wasserman WW, van Roy F, Lenhard B. (2006) A new generation of JASPAR, the open-access repository for transcription factor binding site profiles. Nucleic Acids Res. Jan 1;34(Database issue):D95-7.
