Difference between revisions of "Cellular Networks KnowledgeBase"
(→Throttle Graph) |
|||
| (173 intermediate revisions by 2 users not shown) | |||
| Line 2: | Line 2: | ||
=Overview= | =Overview= | ||
| + | For the '''geWorkbench web''' version of CNKB please see [[Cellular_Networks_KnowledgeBase_web]]. | ||
| − | |||
| − | + | The Cellular Network Knowledge Base (CNKB) is a repository of molecular interactions, including ones both computationally and experimentally derived. Sources for interactions include both publicly available databases such as BIND, MINT, and Reactome, as well as reverse-engineered cellular context-specific regulatory interactomes developed in the lab of Dr. Andrea Califano at Columbia University. | |
| − | The Cellular Network Knowledge Base (CNKB) is a repository of molecular interactions, including | ||
| − | Each pairwise interaction may have an associated | + | Each pairwise interaction may have an associated likelihood indicator (a value between 0 and 1) or another dataset-specific metric reflecting the strength of the underlying data, whether experimental or computational. Details on the methodology used to construct the CNKB are available in [http://www.ncbi.nlm.nih.gov/pubmed/18277385 Mani et al. 2008]. |
Gene interaction information from the CNKB can be used, for example, in order to assess the plausibility of a hypothesis of concerted molecular action represented by a gene set that has been discovered using computational approaches (e.g., by running a clustering analysis on a microarray set to identify tandems of co-expressed genes). If the genes in such a set are reported in the CNKB to have several direct interactions (or several common targets) then this may be evidence that the gene set indeed reflects at some level a real biological process. | Gene interaction information from the CNKB can be used, for example, in order to assess the plausibility of a hypothesis of concerted molecular action represented by a gene set that has been discovered using computational approaches (e.g., by running a clustering analysis on a microarray set to identify tandems of co-expressed genes). If the genes in such a set are reported in the CNKB to have several direct interactions (or several common targets) then this may be evidence that the gene set indeed reflects at some level a real biological process. | ||
| − | The CNKB component allows the user to select a group of markers of interest, specify the interaction types (e.g. Protein-Protein, Protein-DNA etc.), and choose a particular interaction data source. After a query of the Knowledge Base, results are displayed | + | The CNKB component allows the user to select a group of markers of interest, specify the interaction types (e.g. Protein-Protein, Protein-DNA etc.), and choose a particular interaction data source. After a query of the Knowledge Base, results are displayed in the CNKB Throttle Graph in tabular form. After filtering in the throttle graph based on edge confidence values, a network can be created and placed as a new data node in the [[Workspace|Workspace]]. This node can be visualized in the Cytoscape network viewer. |
| − | ==The CNKB graphical interface= | + | =Data Sources= |
| + | |||
| + | Please see the [[CNKB_Data | CNKB data ]] page for a list of currently available data sources and types of interactions. | ||
| + | |||
| + | |||
| + | =Prerequisites= | ||
| + | |||
| + | * To use the CNKB component, first check that it has been loaded in the [[Component_Configuration_Manager | Component Configuration Manager]]. | ||
| + | * A microarray dataset must be loaded and selected. | ||
| + | * Both queries against the CNKB database, and display of gene annotation information require that an annotation file be associated with the microarray dataset at the time that it is loaded. See [[Local_Data_Files | Local Data Files]] and [[File_Formats#Annotation_Files| File Formats]] for further information. | ||
| + | |||
| + | =The CNKB graphical interface= | ||
| + | |||
| + | The CNKB component appears in the Visual area of the geWorkbench graphical interface when a data node of type microarray is loaded and selected. | ||
| − | [[Image:CNKB_with_markers.png]] | + | |
| + | [[Image:CNKB_with_markers.png|{{ImageMaxWidth}}]] | ||
| Line 23: | Line 36: | ||
The "Activated Marker List" displays markers activated in the [[Data_Subsets_-_Markers|Markers]] component. From this list, the user can select markers to use in querying the CNKB database. This can be done either by double-clicking on desired markers, or through use of a right-click menu (see below); those selected will be added to the "Selected Marker List" just below. | The "Activated Marker List" displays markers activated in the [[Data_Subsets_-_Markers|Markers]] component. From this list, the user can select markers to use in querying the CNKB database. This can be done either by double-clicking on desired markers, or through use of a right-click menu (see below); those selected will be added to the "Selected Marker List" just below. | ||
| − | + | In the "Selected Marker List", the "Main" tab displays which markers will be used in the query, and also displays the query results. Query details are set up in the "Preferences" tab. | |
| − | |||
| − | |||
| + | Interactions which will be used to build a network graph can be adjusted using the "Throttle Graph". It is used to set a minimum likelihood threshold for inclusion in the network. | ||
| − | + | A query against the CNKB database is initiated by clicking on the "Refresh" button. All pairwise interactions in the chosen data source of the desired types(s) that involve any marker in the "Selected Marker List" are retrieved. | |
| − | An interaction network can be constructed by pushing the "Create Network" button. The network will be automatically displayed in the Cytoscape component. | + | An interaction network can be constructed by pushing the "Create Network" button. The network will be placed as an adjacency matrix in the [[Workspace|Workspace]] and will be automatically displayed in the Cytoscape component. |
=Working with the CNKB graphical interface= | =Working with the CNKB graphical interface= | ||
| Line 45: | Line 57: | ||
===Marker=== | ===Marker=== | ||
| − | The marker name (comes from the microarray set node selected in the | + | The marker (probeset) name (comes from the microarray set node selected in the [[Workspace|Workspace]]). |
| + | |||
===Gene=== | ===Gene=== | ||
The gene name corresponding to the marker, if loaded from an annotation file. | The gene name corresponding to the marker, if loaded from an annotation file. | ||
| Line 55: | Line 68: | ||
* (no entry) - type is unknown. | * (no entry) - type is unknown. | ||
| + | ====Selecting Markers for Query==== | ||
Individual markers in the Activated Marker List can be moved to the Selected Markers List by double-clicking on them. | Individual markers in the Activated Marker List can be moved to the Selected Markers List by double-clicking on them. | ||
| − | + | Right-clicking on the list of markers brings up a menu with two choices: | |
| + | * Add selected markers to the selected markers list. | ||
| + | * Add all markers to the selected markers list. | ||
| + | |||
| + | For the former case, shown in the figure above, multiple markers can first be highlighted in the usual way by left-clicking on them while holding down the Shift or Control keys. Then, right-click on the list to get the "Add selected markers to the selected markers list" choice. | ||
==Selected Marker List== | ==Selected Marker List== | ||
| Line 64: | Line 82: | ||
| − | [[Image:CNKB_markers_transfered.png]] | + | [[Image:CNKB_markers_transfered.png|{{ImageMaxWidth}}]] |
| − | Markers which have been moved from the Activated Markers List to the Selected Markers List can be used to query the CNKB database. Until a query is run, the list items are shown in red and | + | Markers which have been moved from the Activated Markers List to the Selected Markers List can be used to query the CNKB database. Until a query is run, the list items are shown in red italics. |
| + | |||
| + | Items that have been added to the Selected Markers list can be removed and sent back to the Activated Markers list by double clicking on their entries or through a right-click menu. The right-click menu (shown below) gives the choice of moving only highlighted, or all markers back to the Activated Markers list. | ||
| − | |||
| + | [[Image:CNKB_Selected_Marker_List_Right_click.png]] | ||
| − | |||
| + | After a query has been run against the CNKB database, the marker entries are shown in regular font, blue letters. | ||
| − | |||
| + | [[Image:CNKB_Selected_Markers_after_query.png|{{ImageMaxWidth}}]] | ||
| − | |||
| Line 87: | Line 106: | ||
====Marker==== | ====Marker==== | ||
| − | The marker | + | The marker (probeset) name. |
| + | |||
====Gene==== | ====Gene==== | ||
The gene name corresponding to the marker, if loaded from an annotation file (same as in the "Activated Marker List"). | The gene name corresponding to the marker, if loaded from an annotation file (same as in the "Activated Marker List"). | ||
| Line 94: | Line 114: | ||
[[Image:CNKB_Gene_List_Right_click.png]] | [[Image:CNKB_Gene_List_Right_click.png]] | ||
| + | |||
| + | |||
| + | Hovering the pointer over the Gene entry will display the full gene name for that gene symbol. | ||
| + | |||
| + | |||
| + | [[Image:CNKB_SelectedMarkerList_GeneHover.png]] | ||
====Gene Type==== | ====Gene Type==== | ||
| − | A gene type designation, derived from the gene's GO annotation The list of type codes is the same as that under '''Type''' under "Activated Marker List". | + | A gene type designation, derived from the gene's GO annotation. The list of type codes is the same as that under '''Type''' under "Activated Marker List": |
| + | |||
| + | * '''TF''' - Transcription Factor, | ||
| + | * '''K''' - Kinase, | ||
| + | * '''P''' - Phosphatase, and | ||
| + | * (no entry) - type is unknown. | ||
====GO Annotation==== | ====GO Annotation==== | ||
| − | The GO annotation of the gene. | + | The Gene Ontology (GO) annotation of the gene. Term are annotated to specific markers in the microarray annotation file, and the term descriptions originate in the gene ontology file. The column displays the Biological Process annotations, however, there may be many more annotations than can be displayed in the available space. Hovering the mouse cursor over the field will display the remaining entries. |
| − | |||
| − | [[Image: | + | [[Image:CNKB_GO_Hover_Text_v2.2.png|{{ImageMaxWidth}}]] |
| − | More extensive GO annotations can be viewed for desired genes in the Selected Marker list by right-clicking on its entry. A pop-up menu will offer a choice of the three categories of GO annotation: Component, Function and Process. Expanding one of these terms will show the available annotations for that gene. | + | More extensive GO annotations can be viewed for desired genes in the Selected Marker list by right-clicking on its entry. A pop-up menu will offer a choice of the three categories of GO annotation: Cellular Component, Molecular Function and Biological Process. Expanding one of these terms will show the available annotations for that gene. |
[[Image:CNKB_GO_Right_Click.png]] | [[Image:CNKB_GO_Right_Click.png]] | ||
| − | |||
| − | |||
| − | + | In turn, clicking on one of the terms will bring up a new window showing the term's position in the Gene Ontology hierarchy, represented in tree form. | |
| + | |||
| + | [[Image:CNKB_Gene_Ontology_Tree.png]] | ||
| + | |||
| + | ====Interaction Type Result columns==== | ||
| + | A separate column will appear in the Selected Markers display for each interaction type, e.g. "Protein-DNA" selected in the Preferences tab. The numbers in the columns indicate, for each marker, the number of interactions returned by the query. | ||
| + | |||
| + | The number of interactions can be adjusted by changing the acceptance threshold using the throttle graph slider control. | ||
| + | |||
| + | ==Controls== | ||
| + | ===Refresh=== | ||
| + | Perform the query against the CNKB database using the selected markers and the interactome and interaction types set in the Preferences tab. | ||
| + | |||
| + | ===Create Network=== | ||
| + | Create a network based on the query results, and as filtered by the throttle graph setting. The new network is placed in the [[Workspace|Workspace]] in the form of an adjacency matrix. The network will be displayed in the Cytoscape component if it is loaded. | ||
| + | |||
| + | * '''Note on network size''' - If the network created is larger than it may be possible to display in Cytoscape, Cytoscape will offer the user the option to use a tabular display instead. | ||
| − | + | Networks created in the CNKB are represented in the adjacency matrix at the gene level. | |
| − | [[Image: | + | ===Cancel=== |
| + | Cancel the current query. | ||
| + | |||
| + | ===Throttle Graph Snapshot=== | ||
| + | Place an image of the current throttle graph display in the [[Workspace|Workspace]], with name "CNKB Throttle Graph". | ||
| + | |||
| + | ==Preferences== | ||
| + | |||
| + | [[Image:CNKB_Preferences_v2.2.png|{{ImageMaxWidth}}]] | ||
====Interactions Database==== | ====Interactions Database==== | ||
| − | + | The preferences panel shows a description (if available) of the chosen interactome, and in a separate pane a description of the interactome version. | |
| − | |||
| − | |||
| − | ''' | + | ====Select CNKB instance==== |
| + | '''Change''' - This button allows the address at which to connect to the CNKB servlet to be changed. This should not normally be necessary. | ||
| − | [[ | + | ====Select Interactome==== |
| + | A list of all interactomes available in the CNKB is presented. The number of interactions present in each is shown in parentheses after the name. See also the [[CNKB_Data | CNKB data sources]] page. | ||
| + | ====Interactome Description==== | ||
| + | When an interactome is highlighted, its description, if available, will be presented in this window. | ||
| − | + | ====Select Version==== | |
| + | An interactome may have multiple versions or releases. Each available version of the selected interactome will be presented here. | ||
| − | + | Some versions of an interactome may not yet be public. If so, the version number will appear in red, indicating that it is password protected. | |
| − | + | ====Version Description==== | |
| − | + | A description of the selected version is displayed here. | |
| − | |||
====Column Display Preferences==== | ====Column Display Preferences==== | ||
| Line 154: | Line 208: | ||
* '''Selected Interaction Types''' - A column in the Main tab "Selected Marker List" will appear for each interaction type appearing in this list. | * '''Selected Interaction Types''' - A column in the Main tab "Selected Marker List" will appear for each interaction type appearing in this list. | ||
| + | |||
List entries can be moved between the "Available" and "Selected" lists by either double-clicking directly on an entry, or through use of the right and left triple arrows "<<<", ">>>" located between them. | List entries can be moved between the "Available" and "Selected" lists by either double-clicking directly on an entry, or through use of the right and left triple arrows "<<<", ">>>" located between them. | ||
| − | + | [[Image:CNKB_Preferences_Column_Display_v2.2.png|{{ImageMaxWidth}}]] | |
| − | |||
| − | + | ====Definition of Membership in a Microarray Dataset==== | |
| + | Whether a gene is considered present in the microarray dataset is determined as follows: | ||
| + | # If a CNKB interactor has an Entrez ID, then a direct match on the Entrez ID is required. | ||
| + | # If a CNKB interactor does not have an Entrez ID, then matching is done using gene symbols. | ||
| + | Both of these methods of course require that the appropriate annotation file be loaded along with the microarray dataset, to supply the Entrez IDs and gene symbols for each marker. | ||
| − | |||
| − | |||
| − | |||
| − | == | + | ====Network Generation Preferences==== |
| − | This | + | This section controls how the interactions returned by the database query will be used in creating a network. It allows control of display to be separated from that of the query. |
| + | [[Image:CNKB Preferences Network Generation v2.2.png|{{ImageMaxWidth}}]] | ||
| − | |||
| + | * '''Restrict to genes present in microarray set''' - queries to the CNKB database may return interaction partners that are not members of the microarray dataset from which the original query markers were chosen. Checking this box will cause such markers to NOT be used in generating a network graph or interactome export. The definition of which genes are counted as being part of the microarray dataset is given above. | ||
| + | ** "Restrict" box is NOT checked - if genes not in the microarray dataset are encountered, they will be displayed in Cytoscape, but with type set to "Unknown". | ||
| + | ** "Restrict" box IS checked - if genes not in the microarray dataset are encountered, they will NOT be displayed in Cytoscape. | ||
| − | * ''' | + | * '''Use setting from column display preferences''' |
| + | ** If checked, the same interaction types that have been selected in the "Column Display Preferences" control above will be used in generating the network graph. | ||
| + | ** If unchecked, only those interaction types added to the "Selected Interaction Types" list will be used to construct a network graph. | ||
| + | ===Export Interactome=== | ||
| + | '''Note''' - due to the large size of many of the interactomes, currently only three smaller interactomes can be exported. The others will report a message that they can not be exported. Work to allow export of larger interactomes is underway. | ||
| − | + | * '''Restrict to genes present in microarray set''' - The check box '''Restrict to genes present in microarray set''', described above, can also apply to the export of an interactome. However, because of the options offered for interactome export, its effect is somewhat different than for network generation and display as described above. | |
| + | ** "Restrict" box is NOT checked - genes will be exported based only on the selections described below under "Search Base On" (Choice of Symbol). | ||
| + | ** "Restrict" box IS checked - this has an effect only when the options for "Search Base On" of '''Entrez ID Only''' or '''Gene Symbol Only''' are chosen. In these cases, an exact match is required to a gene in the microarray dataset, based on the Entrez ID or the Gene Symbol, respectively. | ||
| − | + | ====Export to (Destination )==== | |
| − | |||
| − | |||
| − | |||
| − | |||
| − | |||
| + | [[Image:CNKB_Export_to_Project.png]] | ||
| − | + | There are two choices for the "Export To" menu choice: | |
| + | * '''Workspace''' - export the interactome to the Workspace. | ||
| + | * '''File''' - export the interactome to a file on disk. | ||
| − | [[ | + | If the interactome is exported to the Workspace, it will be added as a child of the currently active microarray data node. The interactome data node will be named by prepending the word "export_" to the interactome version name. |
| + | For example for the "HGi V3" interactome, the name of the data node in the [[Workspace|Workspace]] will be "export_HGi_3.0". | ||
| − | + | If the interactome is exported to file, it will be named in the same way as just described, but in addition it will receive a file type suffix of .adj or .siff to indicate the file format chosen (see further below). | |
| − | + | ====Search Based On (Choice of Symbol)==== | |
| − | + | [[Image:CNKB_Export_Symbols.png]] | |
| − | The | + | The interactomes are stored in the CNKB Database at Columbia, and must be retrieved through a query. |
| + | The CNKB Database has three columns dedicated to gene identifiers: | ||
| + | # '''primary accession''' - this is always the Entrez ID, if one is present. Otherwise, null. | ||
| + | # '''secondary accession''' - if there is no primary accession, the alternate identifier, e.g. miRBase ID or UniProt ID, is placed here. | ||
| + | # '''gene symbol''' - for any gene with an Entrez ID, there is usually also a gene symbol. Likewise, for genes with UniProt IDs in the secondary accession column, the gene symbol column should contain a gene symbol, but we have seen instances where it actually contains the UniProt ID again. | ||
| + | The choices for symbol to use, and there effects, are as follows: | ||
| − | + | # '''Gene Symbol Only''' - omit nodes without a gene symbol. | |
| − | + | # '''Entrez ID Only''' - omit nodes without an Entrez ID. | |
| + | # '''Gene Symbol Preferred''' - if a gene symbol is not present, use the primary accession, or if none, use the secondary accession. | ||
| + | # '''Entrez ID Preferred''' - if Entrez ID not present, use secondary accession. | ||
| − | + | ====File Format (Export)==== | |
| − | + | When exported to file, the interactions can be represented in either of two formats, SIF or ADJ. | |
| − | |||
| − | |||
| − | |||
| + | (These formats are also described at [[File_Formats#Network_Formats | File Formats]]). | ||
| − | + | The chosen format is written as a tab-delimited file to disk. | |
| − | + | =====SIF format===== | |
| + | The Simple Interaction Format (SIF) was developed for Cytoscape. | ||
| − | + | For a full definition see the [http://www.cytoscape.org Cytoscape] manual, for example [http://cytoscape.org/manual/Cytoscape2_8Manual.html#SIF%20Format Ctyoscape manual v2.8] | |
| − | + | Each line contains interactions of a particular type for the first node with one or more target nodes: | |
| − | + | node1 interaction-type-code node2 node3 node4 etc. | |
| − | + | Some interaction-type-codes used in the CNKB are | |
| − | + | * '''pp''' protein-protein | |
| + | * '''pd''' protein-DNA | ||
| + | * '''tm''' modulator-TF | ||
| − | + | =====ADJ format===== | |
| + | For each of the interactions in which node1 takes part, | ||
| − | + | * node1 node2 value2 node3 value3 node4 value4 etc.... | |
| − | + | where ''valueN'' can be for example the mutual information, a confidence value etc. | |
| − | + | ==Throttle Graph== | |
| + | This interactive graph allows users to "throttle" (for the genes in the Selected Markers table) which interactions to work with, using as a criterion the interactions’ likelihood indicator. As the required threshold of likelihood of the interactions is increased, the number of interactions meeting this criterion decreases, as displayed in the query results columns (e.g "Protein-DNA") of the Selected Markers list. | ||
| − | |||
| + | The graph shows the result of querying on three interaction types. A fourth line depicts the sum of those three. | ||
| + | Check-boxes allow individual interactions types to be turn on or off in the display. | ||
| − | [[Image: | + | [[Image:CNKB_Result_Display_3types_v2.2.png|{{ImageMaxWidth}}]] |
| − | |||
| − | + | Below, the likelihood cutoff is set to a value of 0.75. | |
| − | |||
| − | + | [[Image:CNKB_Result_Display_3types_threshold0.75_v2.2.png|{{ImageMaxWidth}}]] | |
| − | + | * '''Right-click menu''' - Right-clicking on the Throttle Graph will bring up a menu which allows the graph to be customized. | |
| − | |||
| + | [[Image:CNKB_throttle_graph_RC.png]] | ||
| − | |||
| − | + | * '''Properties''' - Make changes to the plot labels and style. | |
| + | * '''Save as''' - | ||
| + | * '''Print''' - | ||
| + | * '''Zoom in''' - | ||
| + | * '''Zoom out''' - | ||
| + | * '''Auto Range''' - return to an automatically calculated range e.g. after use of Zoom function. | ||
| − | + | Additional Zoom option - | |
| + | * right- or left-click in the graph and draw a selection box around the area you wish to zoom in on. | ||
| + | * To zoom back out, right- or left-click in the graph and move the mouse to the left. | ||
| − | + | =Example - Creating an interaction network and viewing it in Cytoscape= | |
| + | Once the desired set of markers is present and its interaction data has been retrieved from the database, an adjacency matrix can be computed by clicking the "'''Create Network'''" button. The resulting matrix is placed in the [[Workspace|Workspace]] under its parent microarray dataset. The adjacency matrix is visualized in the [[Tutorial_-_Cytoscape_Network_Viewer | Cytoscape Viewer]]. | ||
| − | + | Please note that if the targets retrieved from the Knowledge Base include markers/genes not present in the active microarray dataset, then whether those markers will be used in creating the network graph in Cytoscape is determined by the setting of the "'''Restrict to genes present in microarray set'''" checkbox under "'''Network Generation Preferences'''" on the CNKB '''Preferences''' tab. | |
| + | In addition, the display of gene type in Cytoscape (using shape) is controlled by whether the CNKB component determined that the gene was part of the microarray dataset or not. CNKB may choose to display a hit gene in Cytoscape but mark it as not part of the microarray dataset, for example if it has an Entrez ID that is not found in the microarray dataset. The gene name may match a name in the microarray dataset, but the non-match of EntrezIDs takes precedence, and the gene type will not be displayed. | ||
| − | [[ | + | The Cytoscape Viewer maintains a list of networks which it has currently loaded. It allows individual loaded networks to be deleted. However, the network can be reloaded by clicking on its entry in the [[Workspace|Workspace]]. Cytoscape controls are more fully described in the [[Tutorial_-_Cytoscape_Network_Viewer | Cytoscape]] component tutorial. |
| + | This example will briefly recapitulate the steps used in creating the figures shown in the above sections. | ||
| − | |||
| − | == | + | ==Prerequisites== |
| + | * '''Data File:''' This example uses the Bcell-100.exp dataset available in the data/public_data directory of geWorkbench, and further described on the [[Download]] page. Briefly, this dataset is composed of 100 Affymetrix HG-U95Av2 arrays on which various B-cell lines, both normal and cancerous, were analyzed. Thus it explores a potentially wide variety of expression phenotypes. | ||
| − | + | * '''Annotation File:''' Obtain the annotation file for the HG-U95Av2 array type from the Affymetrix NetAffx website (http://www.affymetrix.com/analysis/index.affx). The name will be similar to "HG_U95Av2.na32.annot.csv", where "na32" is the version number. Loading the annotation file associates gene names and Gene Ontology information with the Affymetrix probeset IDs (see the geWorkbench FAQ for details on obtaining these files). | |
| − | * | + | * '''Marker List:''' The list of markers used in this example is available in the file [[Media: GBM_MR_Markers.csv | GBM_MR_Markers]]. These represent a set of genes that were found to be master regulators of glioblastoma in brain. Here, we will investigate what kinds of interactions these genes have in B-cell lines. |
| − | |||
| − | |||
| − | ==== | + | ==Loading the example data== |
| − | [[ | + | # Load the Bcell-100.exp dataset into geWorkbench as type "Affymetrix File Matrix". (See [[Tutorial_-_Local_Data_Files | Local Data Files]]). |
| + | # When prompted, load the annotation file. | ||
| + | # Create and activate a set of markers in the Markers component. For this example, save the file [[Media: GBM_MR_Markers.csv | GBM_MR_Markers]] to disk and then load it directly into the Markers component by pushing its "'''Load Set'''" button and browsing to the file located in the geWorkbench directory data/public_data. | ||
| − | + | [[Image:CNKB_marker_setup.png]] | |
| − | |||
| + | When the set is activated by checking the box to the left of its name, the transcription factor markers will appear in the "Activated Markers" list in the CNKB component. | ||
| − | == | + | ==Setting up the query in the CNKB component== |
| + | (The steps shown below are also depicted in the screenshots for the individual control descriptions above). | ||
| − | + | 1. In the "Activated Markers List", select (highlight) one marker for each gene. Choosing more than one marker per gene will just cause duplicates to appear in the query results display. Right-click on the "Activated Markers" list choose "Add Selected Markers to Selected Markers List". They will appear in the list in the "Main" tab of the Selected Markers list. | |
| + | 2. In the "Preferences" tab under Selected Markers choose the desired data source, version and interaction types. | ||
| + | * Select BCi. | ||
| + | * Choose version 1.0 in the pulldown to the right. | ||
| + | * Select all three interaction types - modulator-TF, protein-DNA, protein-protein. | ||
| − | + | 3. Return to the "Main' tab and hit the "'''Refresh'''" button. This will perform the query against the Cellular Networks Knowledge Base database. | |
| − | + | 4. Adjust the Throttle Graph to set a minimum likelihood requirement on interactions that will be used to create a network. Here, a value of 0.75 was used. | |
| − | |||
| − | + | Note how the number of reported interactions decreases as the threshold is increased. | |
| − | + | 5. Hit the "'''Create Network'''" button. | |
| − | |||
| + | 6. The resulting adjacency matrix is displayed in the '''Cytoscape''' component in geWorkbench. | ||
| − | |||
| − | + | The edges are colored by the interaction type, e.g. Protein-DNA etc. | |
| − | |||
| + | [[Image:CNKB_Result_Cytoscape_3types_v2.2.png]] | ||
| − | |||
| + | After enlarging the image, three node shapes can be seen, as well as the edges colored by the interaction types. | ||
| − | |||
| − | + | [[Image:CNKB_Cytoscape_Results_type_shapes_v2.2.png|{{ImageMaxWidth}}]] | |
| − | |||
| − | |||
| − | + | 7. See the [[Cytoscape_Network_Viewer]] section for complete details on the many options available for working with this network. | |
| − | |||
| − | |||
| − | |||
| − | |||
| − | |||
| − | [[ | ||
| − | |||
| − | |||
| − | |||
| − | |||
| − | = | + | =Technical Note= |
| − | + | For some ids used in the CNKB database, there may a matching marker which however does not have a gene symbol. In the Affymetrix annotation file, these are indicated with a gene symbol of "---". These results are included in the CNKB results table. | |
Latest revision as of 17:36, 17 March 2015
|
Home | Quick Start | Basics | Menu Bar | Preferences | Component Configuration Manager | Workspace | Information Panel | Local Data Files | File Formats | caArray | Array Sets | Marker Sets | Microarray Dataset Viewers | Filtering | Normalization | Tutorial Data | geWorkbench-web Tutorials |
Analysis Framework | ANOVA | ARACNe | BLAST | Cellular Networks KnowledgeBase | CeRNA/Hermes Query | Classification (KNN, WV) | Color Mosaic | Consensus Clustering | Cytoscape | Cupid | DeMAND | Expression Value Distribution | Fold-Change | Gene Ontology Term Analysis | Gene Ontology Viewer | GenomeSpace | genSpace | Grid Services | GSEA | Hierarchical Clustering | IDEA | Jmol | K-Means Clustering | LINCS Query | Marker Annotations | MarkUs | Master Regulator Analysis | (MRA-FET Method) | (MRA-MARINa Method) | MatrixREDUCE | MINDy | Pattern Discovery | PCA | Promoter Analysis | Pudge | SAM | Sequence Retriever | SkyBase | SkyLine | SOM | SVM | T-Test | Viper Analysis | Volcano Plot |
Contents
- 1 Overview
- 2 Data Sources
- 3 Prerequisites
- 4 The CNKB graphical interface
- 5 Working with the CNKB graphical interface
- 5.1 Activated Marker List
- 5.2 Selected Marker List
- 5.3 Controls
- 5.4 Preferences
- 5.4.1 Interactions Database
- 5.4.2 Select CNKB instance
- 5.4.3 Select Interactome
- 5.4.4 Interactome Description
- 5.4.5 Select Version
- 5.4.6 Version Description
- 5.4.7 Column Display Preferences
- 5.4.8 Definition of Membership in a Microarray Dataset
- 5.4.9 Network Generation Preferences
- 5.4.10 Export Interactome
- 5.5 Throttle Graph
- 6 Example - Creating an interaction network and viewing it in Cytoscape
- 7 Technical Note
Overview
For the geWorkbench web version of CNKB please see Cellular_Networks_KnowledgeBase_web.
The Cellular Network Knowledge Base (CNKB) is a repository of molecular interactions, including ones both computationally and experimentally derived. Sources for interactions include both publicly available databases such as BIND, MINT, and Reactome, as well as reverse-engineered cellular context-specific regulatory interactomes developed in the lab of Dr. Andrea Califano at Columbia University.
Each pairwise interaction may have an associated likelihood indicator (a value between 0 and 1) or another dataset-specific metric reflecting the strength of the underlying data, whether experimental or computational. Details on the methodology used to construct the CNKB are available in Mani et al. 2008.
Gene interaction information from the CNKB can be used, for example, in order to assess the plausibility of a hypothesis of concerted molecular action represented by a gene set that has been discovered using computational approaches (e.g., by running a clustering analysis on a microarray set to identify tandems of co-expressed genes). If the genes in such a set are reported in the CNKB to have several direct interactions (or several common targets) then this may be evidence that the gene set indeed reflects at some level a real biological process.
The CNKB component allows the user to select a group of markers of interest, specify the interaction types (e.g. Protein-Protein, Protein-DNA etc.), and choose a particular interaction data source. After a query of the Knowledge Base, results are displayed in the CNKB Throttle Graph in tabular form. After filtering in the throttle graph based on edge confidence values, a network can be created and placed as a new data node in the Workspace. This node can be visualized in the Cytoscape network viewer.
Data Sources
Please see the CNKB data page for a list of currently available data sources and types of interactions.
Prerequisites
- To use the CNKB component, first check that it has been loaded in the Component Configuration Manager.
- A microarray dataset must be loaded and selected.
- Both queries against the CNKB database, and display of gene annotation information require that an annotation file be associated with the microarray dataset at the time that it is loaded. See Local Data Files and File Formats for further information.
The CNKB graphical interface
The CNKB component appears in the Visual area of the geWorkbench graphical interface when a data node of type microarray is loaded and selected.
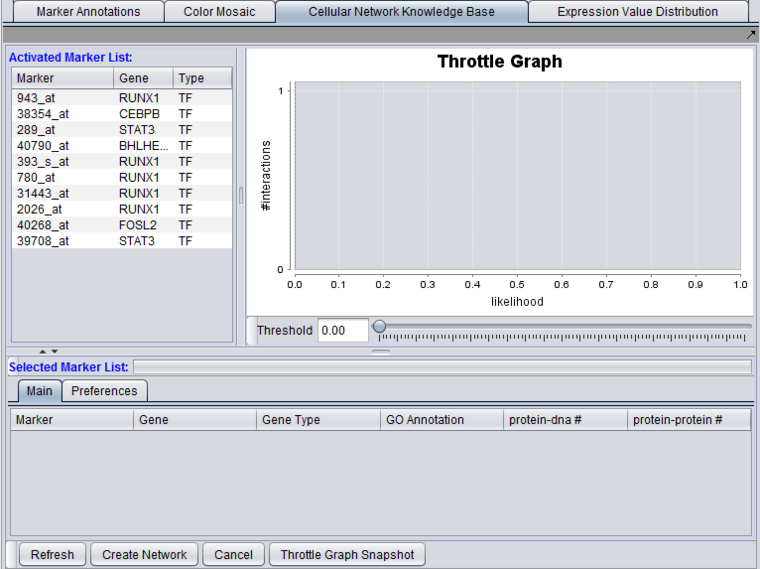
The graphical user interface (GUI) of the CNKB component has three areas of distinct functionality: The "Activated Marker List", the "Selected Marker List", and the "Throttle Graph". The data source, version, and interaction types are specified on a separate "Preferences" tab.
The "Activated Marker List" displays markers activated in the Markers component. From this list, the user can select markers to use in querying the CNKB database. This can be done either by double-clicking on desired markers, or through use of a right-click menu (see below); those selected will be added to the "Selected Marker List" just below.
In the "Selected Marker List", the "Main" tab displays which markers will be used in the query, and also displays the query results. Query details are set up in the "Preferences" tab.
Interactions which will be used to build a network graph can be adjusted using the "Throttle Graph". It is used to set a minimum likelihood threshold for inclusion in the network.
A query against the CNKB database is initiated by clicking on the "Refresh" button. All pairwise interactions in the chosen data source of the desired types(s) that involve any marker in the "Selected Marker List" are retrieved.
An interaction network can be constructed by pushing the "Create Network" button. The network will be placed as an adjacency matrix in the Workspace and will be automatically displayed in the Cytoscape component.
Working with the CNKB graphical interface
The figures in this section correspond to the example in the final section of this tutorial.
Activated Marker List
The "Activated Marker List" contains the markers that belong to activated marker sets from the Markers component. It contains 3 columns:
Marker
The marker (probeset) name (comes from the microarray set node selected in the Workspace).
Gene
The gene name corresponding to the marker, if loaded from an annotation file.
Type
A gene type designation, derived from the gene's GO annotation:
- TF - Transcription Factor,
- K - Kinase,
- P - Phosphatase, and
- (no entry) - type is unknown.
Selecting Markers for Query
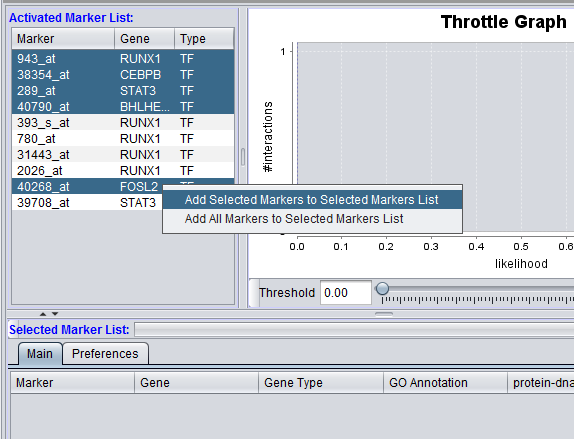
Individual markers in the Activated Marker List can be moved to the Selected Markers List by double-clicking on them.
Right-clicking on the list of markers brings up a menu with two choices:
- Add selected markers to the selected markers list.
- Add all markers to the selected markers list.
For the former case, shown in the figure above, multiple markers can first be highlighted in the usual way by left-clicking on them while holding down the Shift or Control keys. Then, right-click on the list to get the "Add selected markers to the selected markers list" choice.
Selected Marker List
Main
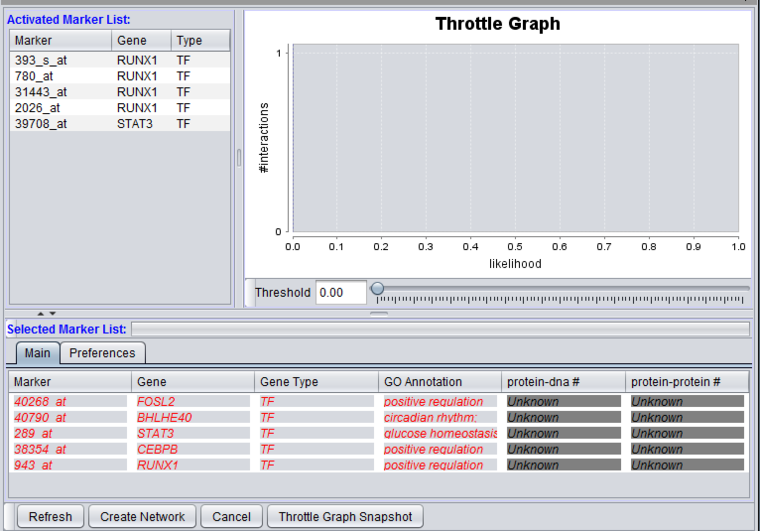
Markers which have been moved from the Activated Markers List to the Selected Markers List can be used to query the CNKB database. Until a query is run, the list items are shown in red italics.
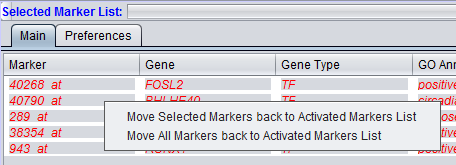
Items that have been added to the Selected Markers list can be removed and sent back to the Activated Markers list by double clicking on their entries or through a right-click menu. The right-click menu (shown below) gives the choice of moving only highlighted, or all markers back to the Activated Markers list.
After a query has been run against the CNKB database, the marker entries are shown in regular font, blue letters.
The Selected Marker List table contains the following columns:
Marker
The marker (probeset) name.
Gene
The gene name corresponding to the marker, if loaded from an annotation file (same as in the "Activated Marker List").
Right-clicking on a gene name will provide link-outs to Gene Cards and Entrez Gene.
Hovering the pointer over the Gene entry will display the full gene name for that gene symbol.
Gene Type
A gene type designation, derived from the gene's GO annotation. The list of type codes is the same as that under Type under "Activated Marker List":
- TF - Transcription Factor,
- K - Kinase,
- P - Phosphatase, and
- (no entry) - type is unknown.
GO Annotation
The Gene Ontology (GO) annotation of the gene. Term are annotated to specific markers in the microarray annotation file, and the term descriptions originate in the gene ontology file. The column displays the Biological Process annotations, however, there may be many more annotations than can be displayed in the available space. Hovering the mouse cursor over the field will display the remaining entries.
More extensive GO annotations can be viewed for desired genes in the Selected Marker list by right-clicking on its entry. A pop-up menu will offer a choice of the three categories of GO annotation: Cellular Component, Molecular Function and Biological Process. Expanding one of these terms will show the available annotations for that gene.
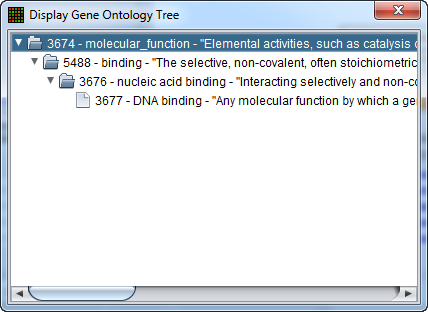
In turn, clicking on one of the terms will bring up a new window showing the term's position in the Gene Ontology hierarchy, represented in tree form.
Interaction Type Result columns
A separate column will appear in the Selected Markers display for each interaction type, e.g. "Protein-DNA" selected in the Preferences tab. The numbers in the columns indicate, for each marker, the number of interactions returned by the query.
The number of interactions can be adjusted by changing the acceptance threshold using the throttle graph slider control.
Controls
Refresh
Perform the query against the CNKB database using the selected markers and the interactome and interaction types set in the Preferences tab.
Create Network
Create a network based on the query results, and as filtered by the throttle graph setting. The new network is placed in the Workspace in the form of an adjacency matrix. The network will be displayed in the Cytoscape component if it is loaded.
- Note on network size - If the network created is larger than it may be possible to display in Cytoscape, Cytoscape will offer the user the option to use a tabular display instead.
Networks created in the CNKB are represented in the adjacency matrix at the gene level.
Cancel
Cancel the current query.
Throttle Graph Snapshot
Place an image of the current throttle graph display in the Workspace, with name "CNKB Throttle Graph".
Preferences
Interactions Database
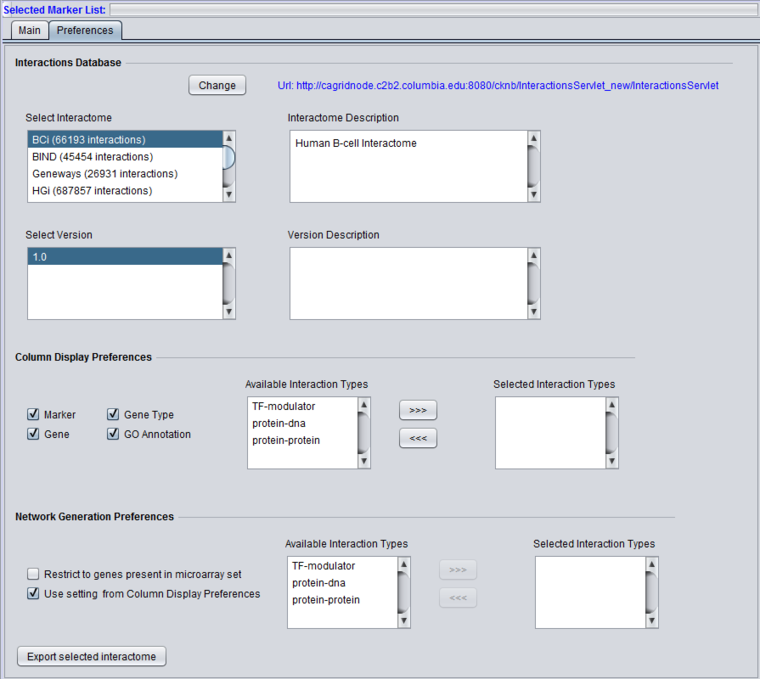
The preferences panel shows a description (if available) of the chosen interactome, and in a separate pane a description of the interactome version.
Select CNKB instance
Change - This button allows the address at which to connect to the CNKB servlet to be changed. This should not normally be necessary.
Select Interactome
A list of all interactomes available in the CNKB is presented. The number of interactions present in each is shown in parentheses after the name. See also the CNKB data sources page.
Interactome Description
When an interactome is highlighted, its description, if available, will be presented in this window.
Select Version
An interactome may have multiple versions or releases. Each available version of the selected interactome will be presented here.
Some versions of an interactome may not yet be public. If so, the version number will appear in red, indicating that it is password protected.
Version Description
A description of the selected version is displayed here.
Column Display Preferences
These selections control which data columns will be displayed in the main "Selected Markers" pane.
- Marker
- Gene
- Gene Type
- GO Annotation
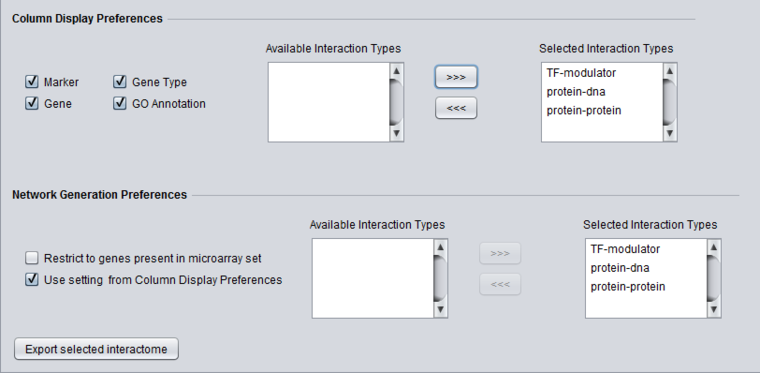
- Available Interaction Types - Contains a list of all interaction types used in the CNKB component that have not been already moved to the "Selected Interaction Types" list to the right. Note that this list is not specific to the particular data source chosen.
- Selected Interaction Types - A column in the Main tab "Selected Marker List" will appear for each interaction type appearing in this list.
List entries can be moved between the "Available" and "Selected" lists by either double-clicking directly on an entry, or through use of the right and left triple arrows "<<<", ">>>" located between them.
Definition of Membership in a Microarray Dataset
Whether a gene is considered present in the microarray dataset is determined as follows:
- If a CNKB interactor has an Entrez ID, then a direct match on the Entrez ID is required.
- If a CNKB interactor does not have an Entrez ID, then matching is done using gene symbols.
Both of these methods of course require that the appropriate annotation file be loaded along with the microarray dataset, to supply the Entrez IDs and gene symbols for each marker.
Network Generation Preferences
This section controls how the interactions returned by the database query will be used in creating a network. It allows control of display to be separated from that of the query.
- Restrict to genes present in microarray set - queries to the CNKB database may return interaction partners that are not members of the microarray dataset from which the original query markers were chosen. Checking this box will cause such markers to NOT be used in generating a network graph or interactome export. The definition of which genes are counted as being part of the microarray dataset is given above.
- "Restrict" box is NOT checked - if genes not in the microarray dataset are encountered, they will be displayed in Cytoscape, but with type set to "Unknown".
- "Restrict" box IS checked - if genes not in the microarray dataset are encountered, they will NOT be displayed in Cytoscape.
- Use setting from column display preferences
- If checked, the same interaction types that have been selected in the "Column Display Preferences" control above will be used in generating the network graph.
- If unchecked, only those interaction types added to the "Selected Interaction Types" list will be used to construct a network graph.
Export Interactome
Note - due to the large size of many of the interactomes, currently only three smaller interactomes can be exported. The others will report a message that they can not be exported. Work to allow export of larger interactomes is underway.
- Restrict to genes present in microarray set - The check box Restrict to genes present in microarray set, described above, can also apply to the export of an interactome. However, because of the options offered for interactome export, its effect is somewhat different than for network generation and display as described above.
- "Restrict" box is NOT checked - genes will be exported based only on the selections described below under "Search Base On" (Choice of Symbol).
- "Restrict" box IS checked - this has an effect only when the options for "Search Base On" of Entrez ID Only or Gene Symbol Only are chosen. In these cases, an exact match is required to a gene in the microarray dataset, based on the Entrez ID or the Gene Symbol, respectively.
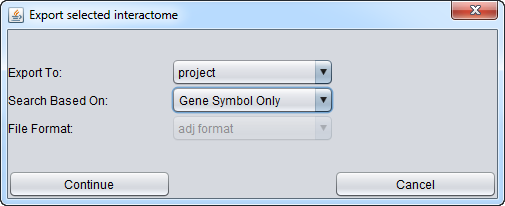
Export to (Destination )
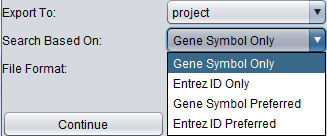
There are two choices for the "Export To" menu choice:
- Workspace - export the interactome to the Workspace.
- File - export the interactome to a file on disk.
If the interactome is exported to the Workspace, it will be added as a child of the currently active microarray data node. The interactome data node will be named by prepending the word "export_" to the interactome version name. For example for the "HGi V3" interactome, the name of the data node in the Workspace will be "export_HGi_3.0".
If the interactome is exported to file, it will be named in the same way as just described, but in addition it will receive a file type suffix of .adj or .siff to indicate the file format chosen (see further below).
Search Based On (Choice of Symbol)
The interactomes are stored in the CNKB Database at Columbia, and must be retrieved through a query.
The CNKB Database has three columns dedicated to gene identifiers:
- primary accession - this is always the Entrez ID, if one is present. Otherwise, null.
- secondary accession - if there is no primary accession, the alternate identifier, e.g. miRBase ID or UniProt ID, is placed here.
- gene symbol - for any gene with an Entrez ID, there is usually also a gene symbol. Likewise, for genes with UniProt IDs in the secondary accession column, the gene symbol column should contain a gene symbol, but we have seen instances where it actually contains the UniProt ID again.
The choices for symbol to use, and there effects, are as follows:
- Gene Symbol Only - omit nodes without a gene symbol.
- Entrez ID Only - omit nodes without an Entrez ID.
- Gene Symbol Preferred - if a gene symbol is not present, use the primary accession, or if none, use the secondary accession.
- Entrez ID Preferred - if Entrez ID not present, use secondary accession.
File Format (Export)
When exported to file, the interactions can be represented in either of two formats, SIF or ADJ.
(These formats are also described at File Formats).
The chosen format is written as a tab-delimited file to disk.
SIF format
The Simple Interaction Format (SIF) was developed for Cytoscape.
For a full definition see the Cytoscape manual, for example Ctyoscape manual v2.8
Each line contains interactions of a particular type for the first node with one or more target nodes:
node1 interaction-type-code node2 node3 node4 etc.
Some interaction-type-codes used in the CNKB are
- pp protein-protein
- pd protein-DNA
- tm modulator-TF
ADJ format
For each of the interactions in which node1 takes part,
- node1 node2 value2 node3 value3 node4 value4 etc....
where valueN can be for example the mutual information, a confidence value etc.
Throttle Graph
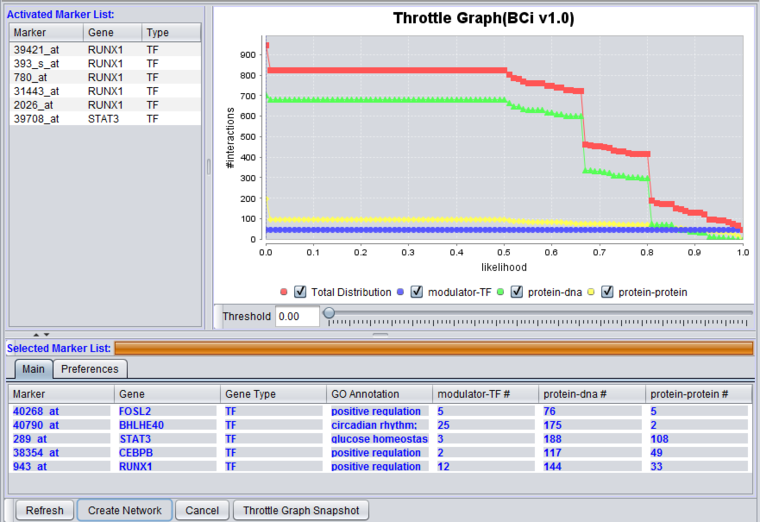
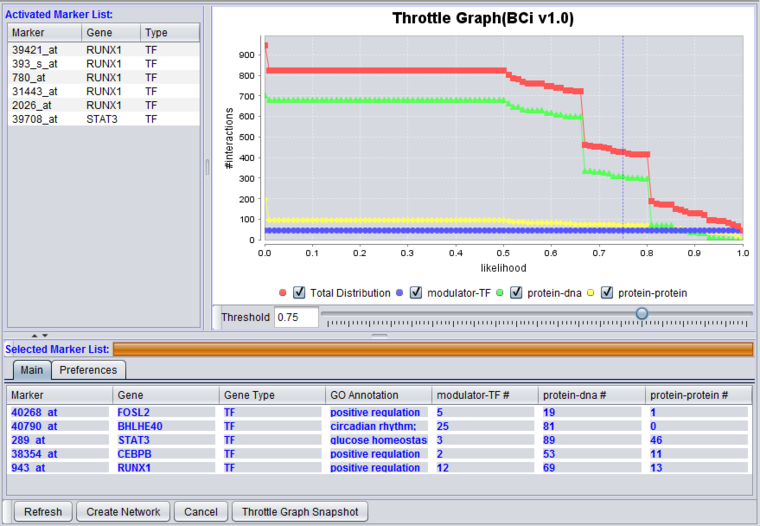
This interactive graph allows users to "throttle" (for the genes in the Selected Markers table) which interactions to work with, using as a criterion the interactions’ likelihood indicator. As the required threshold of likelihood of the interactions is increased, the number of interactions meeting this criterion decreases, as displayed in the query results columns (e.g "Protein-DNA") of the Selected Markers list.
The graph shows the result of querying on three interaction types. A fourth line depicts the sum of those three.
Check-boxes allow individual interactions types to be turn on or off in the display.
Below, the likelihood cutoff is set to a value of 0.75.
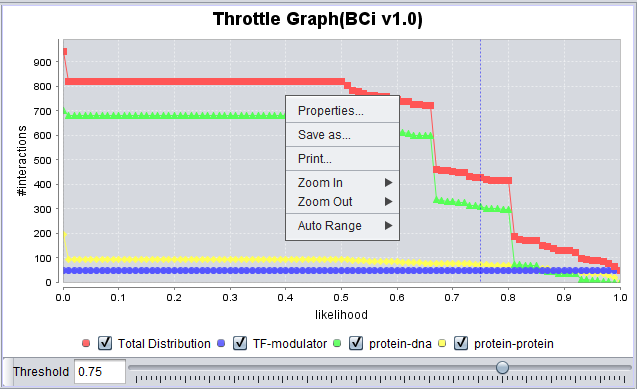
- Right-click menu - Right-clicking on the Throttle Graph will bring up a menu which allows the graph to be customized.
- Properties - Make changes to the plot labels and style.
- Save as -
- Print -
- Zoom in -
- Zoom out -
- Auto Range - return to an automatically calculated range e.g. after use of Zoom function.
Additional Zoom option -
- right- or left-click in the graph and draw a selection box around the area you wish to zoom in on.
- To zoom back out, right- or left-click in the graph and move the mouse to the left.
Example - Creating an interaction network and viewing it in Cytoscape
Once the desired set of markers is present and its interaction data has been retrieved from the database, an adjacency matrix can be computed by clicking the "Create Network" button. The resulting matrix is placed in the Workspace under its parent microarray dataset. The adjacency matrix is visualized in the Cytoscape Viewer.
Please note that if the targets retrieved from the Knowledge Base include markers/genes not present in the active microarray dataset, then whether those markers will be used in creating the network graph in Cytoscape is determined by the setting of the "Restrict to genes present in microarray set" checkbox under "Network Generation Preferences" on the CNKB Preferences tab.
In addition, the display of gene type in Cytoscape (using shape) is controlled by whether the CNKB component determined that the gene was part of the microarray dataset or not. CNKB may choose to display a hit gene in Cytoscape but mark it as not part of the microarray dataset, for example if it has an Entrez ID that is not found in the microarray dataset. The gene name may match a name in the microarray dataset, but the non-match of EntrezIDs takes precedence, and the gene type will not be displayed.
The Cytoscape Viewer maintains a list of networks which it has currently loaded. It allows individual loaded networks to be deleted. However, the network can be reloaded by clicking on its entry in the Workspace. Cytoscape controls are more fully described in the Cytoscape component tutorial.
This example will briefly recapitulate the steps used in creating the figures shown in the above sections.
Prerequisites
- Data File: This example uses the Bcell-100.exp dataset available in the data/public_data directory of geWorkbench, and further described on the Download page. Briefly, this dataset is composed of 100 Affymetrix HG-U95Av2 arrays on which various B-cell lines, both normal and cancerous, were analyzed. Thus it explores a potentially wide variety of expression phenotypes.
- Annotation File: Obtain the annotation file for the HG-U95Av2 array type from the Affymetrix NetAffx website (http://www.affymetrix.com/analysis/index.affx). The name will be similar to "HG_U95Av2.na32.annot.csv", where "na32" is the version number. Loading the annotation file associates gene names and Gene Ontology information with the Affymetrix probeset IDs (see the geWorkbench FAQ for details on obtaining these files).
- Marker List: The list of markers used in this example is available in the file GBM_MR_Markers. These represent a set of genes that were found to be master regulators of glioblastoma in brain. Here, we will investigate what kinds of interactions these genes have in B-cell lines.
Loading the example data
- Load the Bcell-100.exp dataset into geWorkbench as type "Affymetrix File Matrix". (See Local Data Files).
- When prompted, load the annotation file.
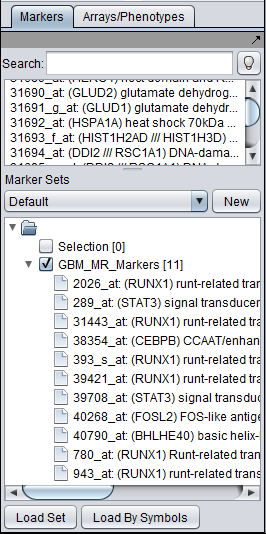
- Create and activate a set of markers in the Markers component. For this example, save the file GBM_MR_Markers to disk and then load it directly into the Markers component by pushing its "Load Set" button and browsing to the file located in the geWorkbench directory data/public_data.
When the set is activated by checking the box to the left of its name, the transcription factor markers will appear in the "Activated Markers" list in the CNKB component.
Setting up the query in the CNKB component
(The steps shown below are also depicted in the screenshots for the individual control descriptions above).
1. In the "Activated Markers List", select (highlight) one marker for each gene. Choosing more than one marker per gene will just cause duplicates to appear in the query results display. Right-click on the "Activated Markers" list choose "Add Selected Markers to Selected Markers List". They will appear in the list in the "Main" tab of the Selected Markers list.
2. In the "Preferences" tab under Selected Markers choose the desired data source, version and interaction types.
- Select BCi.
- Choose version 1.0 in the pulldown to the right.
- Select all three interaction types - modulator-TF, protein-DNA, protein-protein.
3. Return to the "Main' tab and hit the "Refresh" button. This will perform the query against the Cellular Networks Knowledge Base database.
4. Adjust the Throttle Graph to set a minimum likelihood requirement on interactions that will be used to create a network. Here, a value of 0.75 was used.
Note how the number of reported interactions decreases as the threshold is increased.
5. Hit the "Create Network" button.
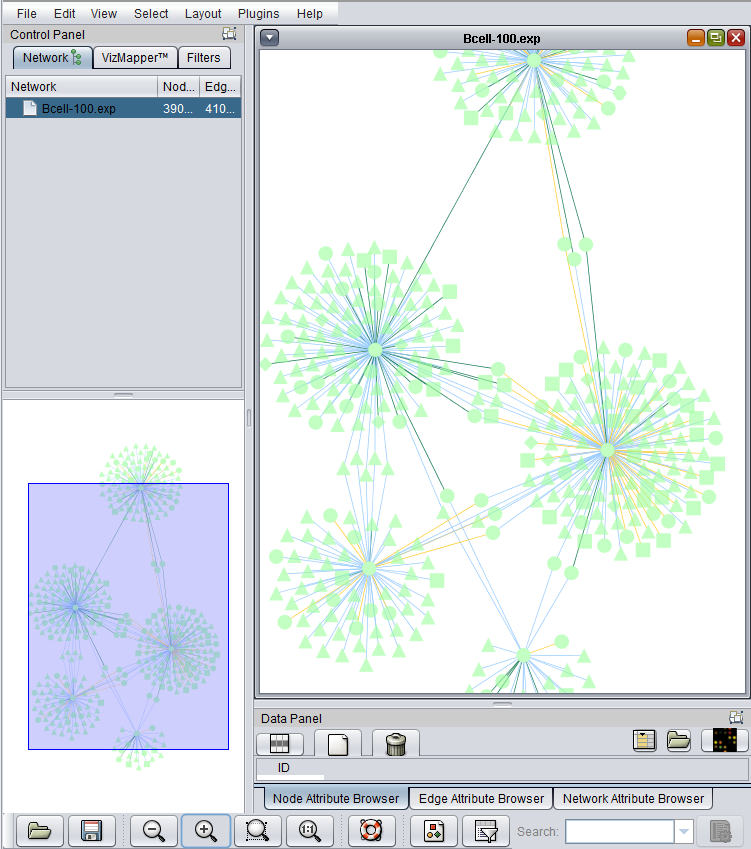
6. The resulting adjacency matrix is displayed in the Cytoscape component in geWorkbench.
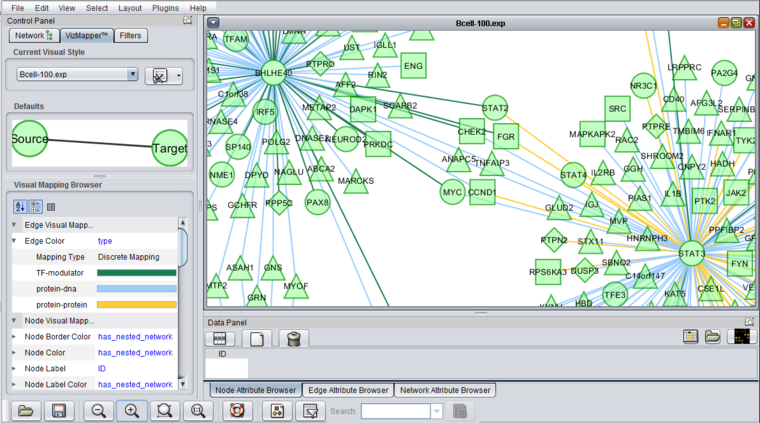
The edges are colored by the interaction type, e.g. Protein-DNA etc.
After enlarging the image, three node shapes can be seen, as well as the edges colored by the interaction types.
7. See the Cytoscape_Network_Viewer section for complete details on the many options available for working with this network.
Technical Note
For some ids used in the CNKB database, there may a matching marker which however does not have a gene symbol. In the Affymetrix annotation file, these are indicated with a gene symbol of "---". These results are included in the CNKB results table.
