Difference between revisions of "Sequence Retriever"
| Line 4: | Line 4: | ||
==Background== | ==Background== | ||
| − | geWorkbench contains a number of modules that allow DNA or protein sequences to be analyzed. Sequences can be loaded from a local disk as a FASTA format file, or can be retrieved from a | + | geWorkbench contains a number of modules that allow DNA or protein sequences to be visualized and analyzed. Sequences can be loaded from a local disk as a FASTA format file, or can be retrieved from a remote resource. Here we discuss retrieval of sequences from the network. |
| − | + | ==Limitations== | |
| + | In the current version (v1.03), for DNA sequences, only the sequence +-2000 bp from the transcription start site is available, and only for markers in the Affymetrix HG_U95 chip. These results have been pre-cached on the geWorkbench webserver and are downloaded to the application the first time they are requested. In the next version, this will be changed to obtain sequences directly from the UC Santa Cruz Golden Path database where possible. Amino-acid sequences are retrieved on-the-fly from | ||
| − | We will | + | ==Example== |
| + | |||
| + | For this example, we will start with the group of markers selected in an exercise similar to that shown in the [[Clustering]] tutorial. The list of markers can be loaded from the file "cluster_tree_12markers.csv" found in the tutorial data file (see [[Download]]). To load the markers, press the "Load Set" button at the bottom of the component and browse to the desired file. | ||
| + | |||
| + | We will retrieve sequences from +-2000 bp from the transcription start site of each gene. This region may contain some regulatory elements such as transcription factor binding sites. | ||
==Retrieving the sequences== | ==Retrieving the sequences== | ||
| Line 22: | Line 27: | ||
| − | Retrieved FASTA format sequences can be added to a project by clicking the '''Add to Project''' button at lower right in the component (see interface picture above). Note that if the entry | + | Retrieved FASTA format sequences can be added to a project by clicking the '''Add to Project''' button at lower right in the component (see interface picture above). Note that if the sequence entry is then selected, modules supporting sequence analysis will appear, for example Pattern Discovery and the Promoter component, in the lower right-hand Analytical Tools portion of the GUI. |
| Line 35: | Line 40: | ||
| − | Double clicking on the sequence display will return to the summary view. Sequences can also be viewed in the '''Sequence''' and '''Promoter''' components. | + | Double-clicking on the sequence display will return to the summary view. Sequences can also be viewed in the '''Sequence''' and '''Promoter''' components. Analytical tools for sequence analysis are displayed, in the default layout, in the lower right portion of the interface. |
Revision as of 15:31, 20 July 2006
|
Home | Quick Start | Basics | Menu Bar | Preferences | Component Configuration Manager | Workspace | Information Panel | Local Data Files | File Formats | caArray | Array Sets | Marker Sets | Microarray Dataset Viewers | Filtering | Normalization | Tutorial Data | geWorkbench-web Tutorials |
Analysis Framework | ANOVA | ARACNe | BLAST | Cellular Networks KnowledgeBase | CeRNA/Hermes Query | Classification (KNN, WV) | Color Mosaic | Consensus Clustering | Cytoscape | Cupid | DeMAND | Expression Value Distribution | Fold-Change | Gene Ontology Term Analysis | Gene Ontology Viewer | GenomeSpace | genSpace | Grid Services | GSEA | Hierarchical Clustering | IDEA | Jmol | K-Means Clustering | LINCS Query | Marker Annotations | MarkUs | Master Regulator Analysis | (MRA-FET Method) | (MRA-MARINa Method) | MatrixREDUCE | MINDy | Pattern Discovery | PCA | Promoter Analysis | Pudge | SAM | Sequence Retriever | SkyBase | SkyLine | SOM | SVM | T-Test | Viper Analysis | Volcano Plot |
Contents
Background
geWorkbench contains a number of modules that allow DNA or protein sequences to be visualized and analyzed. Sequences can be loaded from a local disk as a FASTA format file, or can be retrieved from a remote resource. Here we discuss retrieval of sequences from the network.
Limitations
In the current version (v1.03), for DNA sequences, only the sequence +-2000 bp from the transcription start site is available, and only for markers in the Affymetrix HG_U95 chip. These results have been pre-cached on the geWorkbench webserver and are downloaded to the application the first time they are requested. In the next version, this will be changed to obtain sequences directly from the UC Santa Cruz Golden Path database where possible. Amino-acid sequences are retrieved on-the-fly from
Example
For this example, we will start with the group of markers selected in an exercise similar to that shown in the Clustering tutorial. The list of markers can be loaded from the file "cluster_tree_12markers.csv" found in the tutorial data file (see Download). To load the markers, press the "Load Set" button at the bottom of the component and browse to the desired file.
We will retrieve sequences from +-2000 bp from the transcription start site of each gene. This region may contain some regulatory elements such as transcription factor binding sites.
Retrieving the sequences
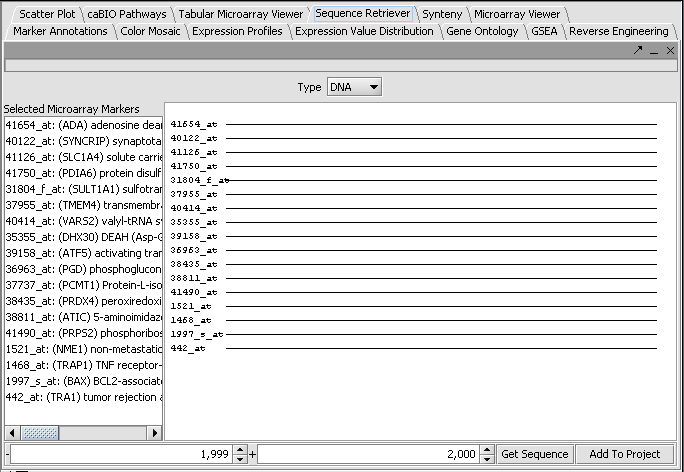
Press the Get Sequence button to download the sequences.
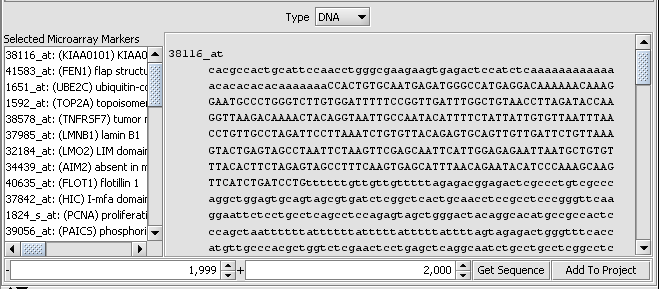
The sequence can be viewed by double-clicking on the desired line in the display.
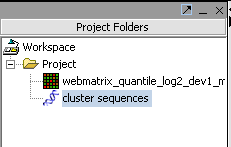
Retrieved FASTA format sequences can be added to a project by clicking the Add to Project button at lower right in the component (see interface picture above). Note that if the sequence entry is then selected, modules supporting sequence analysis will appear, for example Pattern Discovery and the Promoter component, in the lower right-hand Analytical Tools portion of the GUI.
Viewing retrieved sequences
The underlying sequence for any marker in the Sequence Retriever display can be seen by double-clicking on the line representing it.
Double-clicking on the sequence display will return to the summary view. Sequences can also be viewed in the Sequence and Promoter components. Analytical tools for sequence analysis are displayed, in the default layout, in the lower right portion of the interface.


