Difference between revisions of "Marker Sets"
m |
|||
| Line 1: | Line 1: | ||
{{TutorialsTopNav}} | {{TutorialsTopNav}} | ||
| − | ==Overview== | + | ==Overview of Marker and Array Sets== |
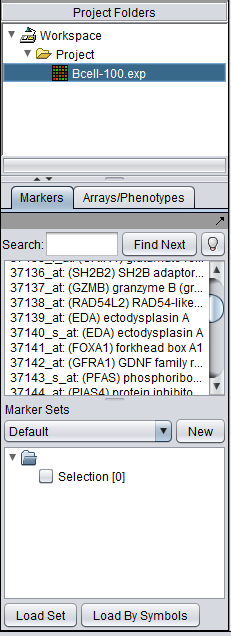
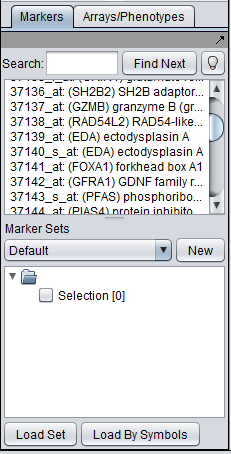
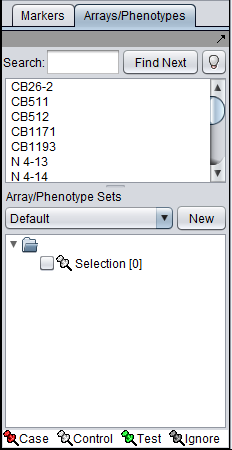
The Markers/Arrays component, located at lower left in the geWorkbench graphical interface, allows the user to define and use subsets of arrays and markers for a number of purposes. | The Markers/Arrays component, located at lower left in the geWorkbench graphical interface, allows the user to define and use subsets of arrays and markers for a number of purposes. | ||
Revision as of 11:37, 16 June 2010
Overview of Marker and Array Sets
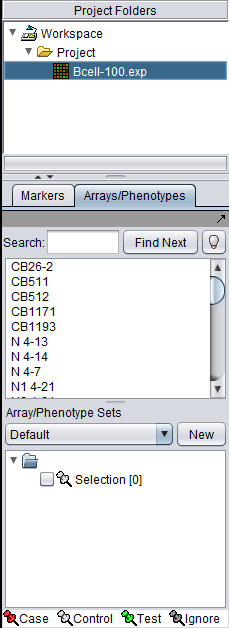
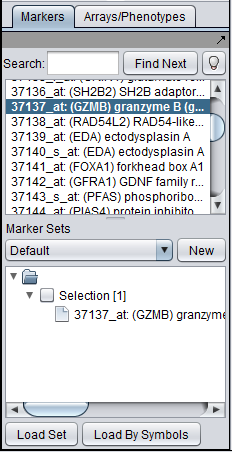
The Markers/Arrays component, located at lower left in the geWorkbench graphical interface, allows the user to define and use subsets of arrays and markers for a number of purposes.
As used in geWorkbench, the term "marker" includes genes, probes/probesets, and individual sequences, depending on the type of data loaded. Sets of markers can be returned by various analysis routines. For example the t-test returns a list of markers showing significant differential expression, and after hierarchical clustering, the markers in a subtree of the resulting dendrogram can be saved to a list.
Sets of microarrays can be used to group arrays in a meaningful fashion for statistical analysis. For example, two such phenotypes might be the diseased and normal states of a tissue from which samples have been taken. geWorkbench uses the terms "Case" and "Control" to categorize these, but in biological setting the equivalent would be "Experimental" vs "Control".
This section discusses the use of subsets of markers. Please see the chapter Data Subsets - Arrays for a discussion of the use of Array sets.
Further examples of working with sets of markers can be found in Tutorial_-_Differential_Expression and Tutorial_-_Clustering.
