Difference between revisions of "Preferences"
(→Suggested Number of Cytoscape Networks Objects) |
(→Introduction) |
||
| Line 7: | Line 7: | ||
| − | '''Note | + | '''Note - All changes to preferences only affect datasets loaded after the change is made.''' |
==Text Editor== | ==Text Editor== | ||
Revision as of 15:31, 22 July 2011
Contents
Introduction
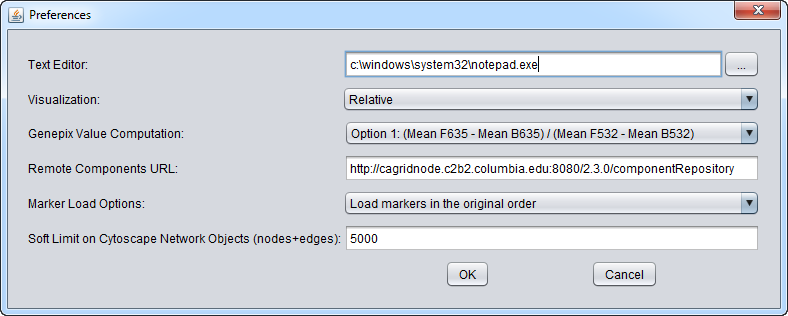
The Preferences item in the menu bar allows a number of features of geWorkbench to be configured.
Note - All changes to preferences only affect datasets loaded after the change is made.
Text Editor
The user can change the default text editor used to view data files. For example, when you right-click on a data node in the Project Folders component, "View in Editor" is one of the options offered.
Visualization
Heat maps, e.g. in the Color Mosaic component, can be displayed using either a relative or an absolute color scheme.
A change in this setting only takes effect the next time a new microarray data node is loaded. It does not affect the visualization of any node already loaded.
Note - Changing the relative/absolute preference will not take effect until the next time a data set is loaded.
- Absolute
- Red represents positive expression values, and green represents negative expression values. Black represents a value of zero. The shade represents the expression magnitude as follows:
- Formal spec: Let M = max{|min|, |max|} over all expression measurements, across all arrays. If expression value x > 0, assign it the red spectrum x / M * 256. If expression value x is negative, assign it to the green spectrum -x / M * 256.
- Relative (default)
- Relative is similar to the setting for Absolute, but each marker is mean-variance normalized first. A Red-Blue color scheme is used, with red representing the highest values and blue the lowest. White represents the marker average.
- Note - Relative will give odd-looking results if only a small number of arrays are loaded.
GenePix Value Computation
Four methods for calculating a composite expression measurement for each marker in a GenePix file are offered. They combine the foreground and background and mean or median measurements from each channel in different ways.
- ( F635 Mean - B635 Mean) / (F532 Mean - B532 Mean).
- ( F635 Median - B635 Median) / (F532 Median - B532 Median).
- ( F532 Mean - B532 Mean) / (F635 Mean - B635 Mean).
- ( F532 Median - B532 Median) / (F635 Median - B635 Median).
See the entry GenePix Format in the GenePix tutorial chapter for further details of processing GenePix data on input.
Remote Components URL
geWorkbench can download certain components from a network repository. This specifies the location of the network component repository.
Marker Load Options
When a microarray dataset is loaded, along with its annotation file, it is possible to re-sort the markers at the global level - the new order will then be seen in all geWorkbench components. There are three options:
- Load markers in the original order
- Load markers ordered by gene name
- Load markers ordered by probeset id
If no annotation file is loaded, sorting by probeset id can still be done.
If the Marker Load option is changed, it will take effect the next time a dataset is loaded.
In addition to this global sorting, markers can also be sorted by the same three methods in the Markers component (right-click on the marker list).
Remote Workspaces URL
Development versions of geWorkbench have a feature which allows a workspace to be saved to a remote server for later retrieval or sharing.
Soft Limit on Cytoscape Networks Objects
There is a limit to the size of networks that Cytoscape can be used to visualize in geWorkbench. This limit will depend on the amount of memory allocated to geWorkbench. Viewing too large a network can cause geWorkbench to run out of memory and stop responding.
As of release 2.2.1, if the user attempts to view a large network in Cytocape, he or she will be offered the option to instead view the network using a built-in text viewer.
This "Soft Limit" preference setting controls the size of a network, calculated at the sum of the node (genes) and edges (interactions), that will trigger display of the dialog allowing the user to choose the text viewer. The user can experiment with attempting to view larger networks.

