Difference between revisions of "Fold Change"
(→Overview) |
(→Criterion) |
||
| Line 13: | Line 13: | ||
==Parameters== | ==Parameters== | ||
===Criterion=== | ===Criterion=== | ||
| − | The fold-change threshold that must be met for a marker to be included in the positive or negative fold-change set. | + | The fold-change threshold that must be met for a marker to be included in the positive or negative fold-change set. This number must be greater than or equal to zero. |
The criterion is not adjusted based on the type of calculation. For the ratio method, a fold-change criterion of 4 is comparable in scale to a criterion of 2 for the average log2 method. | The criterion is not adjusted based on the type of calculation. For the ratio method, a fold-change criterion of 4 is comparable in scale to a criterion of 2 for the average log2 method. | ||
Revision as of 18:57, 28 February 2012
Contents
Overview
Fold change is used to compare the expression of genes between two sets of arrays, e.g. case and control sets.
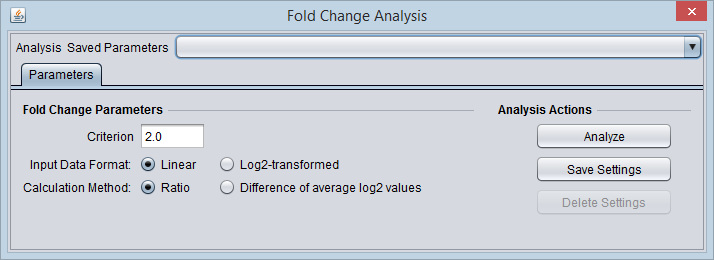
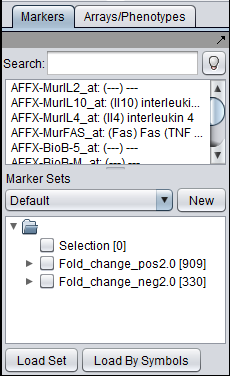
This component allows a threshold for fold-change to be set. Markers that exceed the threshold are placed into new sets in the Markers component - one for those with positive fold-change, the other for negative (further described below).
Two methods are provided to calculate fold change. The component also allows either calculation to be carried out starting with either linear or log2-transformed data.
Parameters
Criterion
The fold-change threshold that must be met for a marker to be included in the positive or negative fold-change set. This number must be greater than or equal to zero.
The criterion is not adjusted based on the type of calculation. For the ratio method, a fold-change criterion of 4 is comparable in scale to a criterion of 2 for the average log2 method.
Input Data Format
To correctly calculate the chosen fold-change value, the component must know if the data is linear or log2 transformed. This must be specified by the user.
- Linear
- Log2-transformed
Calculation Method
Ratio
- The ratio of case to control is calculated with linear values. Log2 data will first be transformed to linear.
- For each marker, calculate Avg(Case arrays) / Avg(Control arrays).
- Ratios less than 1 are inverted and given a negative sign, e.g. 0.25 is reported as -4.
Difference of average log2 values
- Calculated with log2 values. Linear data will be transformed to log2 (shown in formula below).
- Because of the log2 transformation of linear data, no linear value should be less than or equal to zero. If such a value is encountered, a warning will be issued and the analysis terminated.
- For each marker, calculate Avg( log2(Case arrays) ) - Avg( log2(Control arrays) ).
- Here, if the Case arrays have lower expression than the Control, the negative sign results directly.
Tranformation Notice
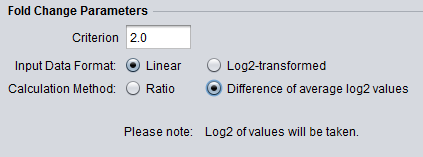
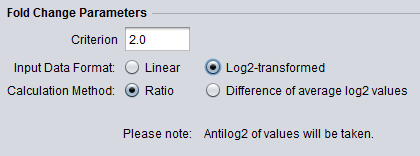
The below figures show that when the data is to be transformed, the transformation is indicated below the parameter selections.
- Log2 Transform:
- Antilog2 Transform:
Example and Results
Setup
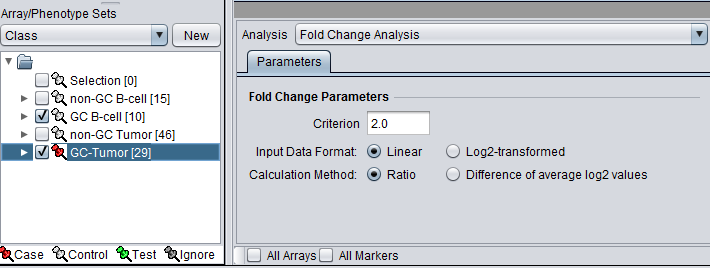
- At least two set of markers must be activated, and at least one marked as Case and one marked as Control.
Results
Separate marker sets are created in the Markers component for those markers with positive and negative fold change. The set names are created as "Fold_change_Pos#.#" and "Fold_change_Neg#.#, where #.# indicates the fold-change threshold criterion that was met.
