Difference between revisions of "Information Panel"
(→Project Folders Component) |
(→Project Folders Component) |
||
| Line 7: | Line 7: | ||
==Project Folders Component== | ==Project Folders Component== | ||
| − | For microarray datasets, adjacency matrices (network nodes), and | + | For microarray datasets, adjacency matrices (network nodes), sequence and pattern nodes, moving the mouse cursor over the data nodes will display additional details about a dataset. |
Microarray datasets: hover text displays number of markers and arrays. | Microarray datasets: hover text displays number of markers and arrays. | ||
Revision as of 12:07, 28 February 2012
|
Home | Quick Start | Basics | Menu Bar | Preferences | Component Configuration Manager | Workspace | Information Panel | Local Data Files | File Formats | caArray | Array Sets | Marker Sets | Microarray Dataset Viewers | Filtering | Normalization | Tutorial Data | geWorkbench-web Tutorials |
Analysis Framework | ANOVA | ARACNe | BLAST | Cellular Networks KnowledgeBase | CeRNA/Hermes Query | Classification (KNN, WV) | Color Mosaic | Consensus Clustering | Cytoscape | Cupid | DeMAND | Expression Value Distribution | Fold-Change | Gene Ontology Term Analysis | Gene Ontology Viewer | GenomeSpace | genSpace | Grid Services | GSEA | Hierarchical Clustering | IDEA | Jmol | K-Means Clustering | LINCS Query | Marker Annotations | MarkUs | Master Regulator Analysis | (MRA-FET Method) | (MRA-MARINa Method) | MatrixREDUCE | MINDy | Pattern Discovery | PCA | Promoter Analysis | Pudge | SAM | Sequence Retriever | SkyBase | SkyLine | SOM | SVM | T-Test | Viper Analysis | Volcano Plot |
Contents
Overview
geWorkbench provides several mechanisms by which descriptive information about particular data nodes can be viewed and added. These include "hover text" in the Project Folders component for certain dataset types, and several text windows for different types of information. These later components are displayed in the Command and Analysis area of geWorkbench.
Project Folders Component
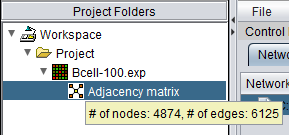
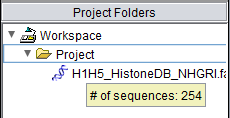
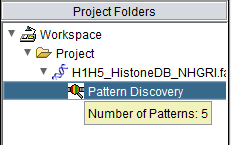
For microarray datasets, adjacency matrices (network nodes), sequence and pattern nodes, moving the mouse cursor over the data nodes will display additional details about a dataset.
Microarray datasets: hover text displays number of markers and arrays.
Adjacency Matrix: hover text displays number of nodes and edges in the network.
Sequence node:
Pattern node:
Dataset History and Annotation
Dataset History
The Dataset History component is used to log the data transformations applied by operations such as the application of filters, normalizers, etc. For example, when a dataset in the Project Folders is normalized, the Dataset History for that dataset is updated to record that event. Dataset histories are part of the workspace and are persisted when the workspace is saved with their pertinent dataset. Data in the Dataset History pane is non-editable.
Dataset Annotation
The Dataset Annotation component allows users to attach comments to Project Folders nodes. A user first selects the node of interest in the Project Folders tree and then enters the desired annotation (in the form of free text) in the Dataset Annotation pane. Annotations are stored along with their corresponding Project Folder nodes when the workspace is saved.
Experiment Information
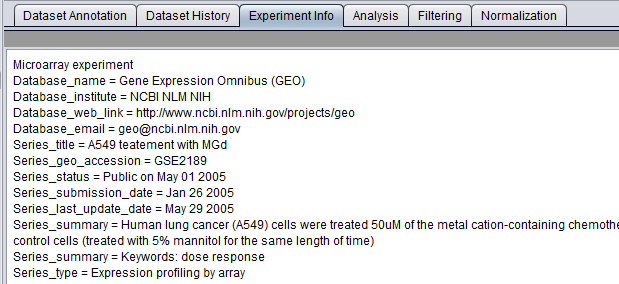
Experiment Info is a non-editable component intended for viewing information associated with a Microarray dataset. What constitutes "experiment information" varies depending on the source of the microarray dataset. E.g., for Affymetrix MAS5 files the file preamble (the part just before the data lines which provides various experiment execution parameters) becomes the experiment information.
Currently only header information from GEO files appears to be supported.


