Difference between revisions of "SOM"
(→SOM Example) |
|||
| Line 33: | Line 33: | ||
The resulting display of nine clusters is shown here: | The resulting display of nine clusters is shown here: | ||
| − | Image:T_SOM_display.png | + | [[Image:T_SOM_display.png]] |
| − | |||
| − | |||
==Hierarchical Clustering - Example== | ==Hierarchical Clustering - Example== | ||
Revision as of 16:58, 6 June 2006
Note
(June 6, 2006) A problem has been identified in the Hierarchical Clustering analysis with the implementations of Average Linkage and Total Linkage. This problem is present in the current version (1.0.3) of geWorkbench and all previous versions. This problem will be fixed in the next release. The implementation of single linkage is believed to be working correctly.
Background
Clustering methods can allow identification of groups of markers with similar expression. geWorkbench supports two clustering methods:
- Self-organizing maps (SOMs)
- Hierarchical Clustering
Self-organizing maps group the markers into a user-specified number of bins. In geWorkbench, a SOM visualizer component displays the results graphically. Hierarchical clustering constructs a tree-like relationship among the expression patterns of all markers present. Results are viewed in the Dendrogram component.
Preparation
For the clustering examples, load a microarray dataset such as "webmatrix_quantile_log2_dev1_mv0.exp", available in the tutorial_data.zip Download.
SOM Example
- In the Arrays/Phenotypes component pulldown menu, select the group labeled "Class".
- Activate two sets of arrays to compare, the GC B-cell and non-GC B-cell, by checking the boxes before the names.
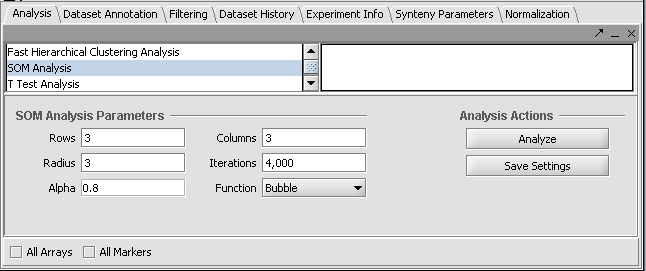
- Go to the Analysis component, and select SOM Analysis.
The default parameters are shown below. We will accept these parameters.
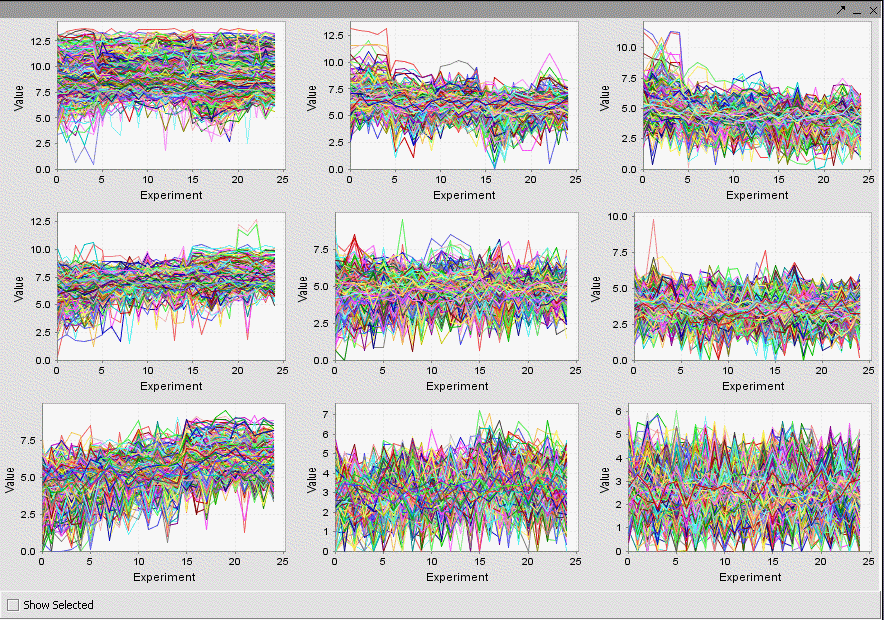
The resulting display of nine clusters is shown here:
Hierarchical Clustering - Example
- In the Arrays/Phenotypes component, select the set of arrays labeled "Class".
- Activate two classes of arrays to compare, the GC B-cell and non-GC B-cell, by checking the boxes before the names.
- Go to the Analysis component, and select Hierarchical Clustering.
- At the bottom of the Analysis component, the box that says All Arrays should be unchecked, so that the array selection above is used.
- In Hierarchical Clustering, set the parameters to:
- Clustering Method: Total Linkage
- Clustering Dimension: Both
- Clustering Metric: Euclidean
- Click Analyze.
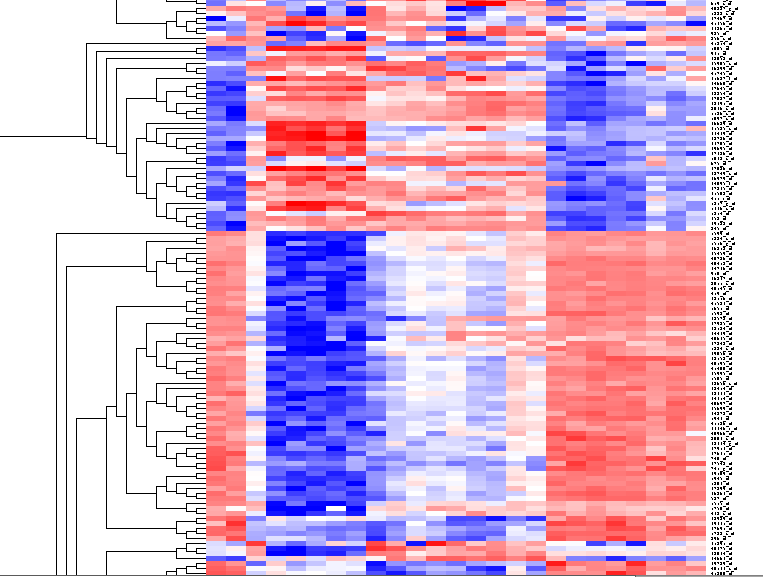
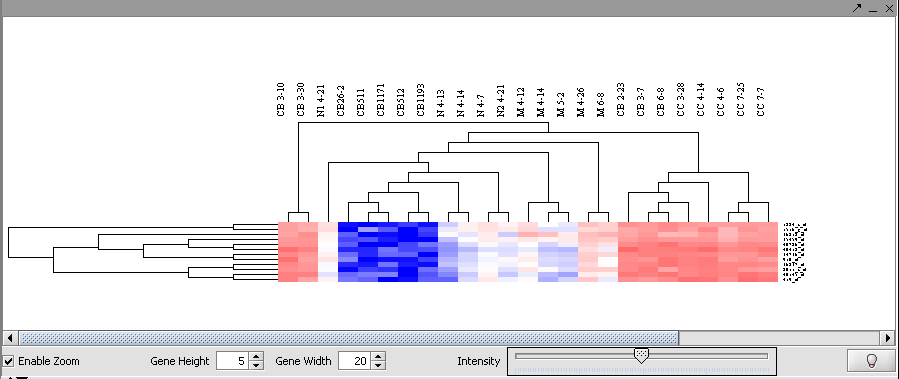
The results will be displayed in the Dendrogram component.
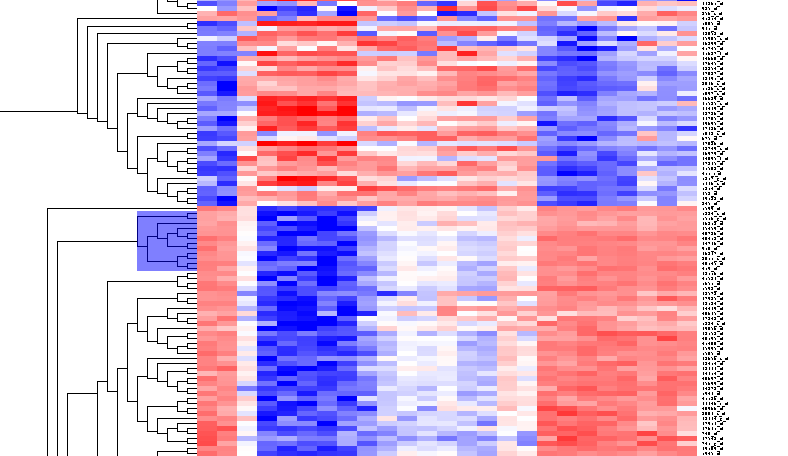
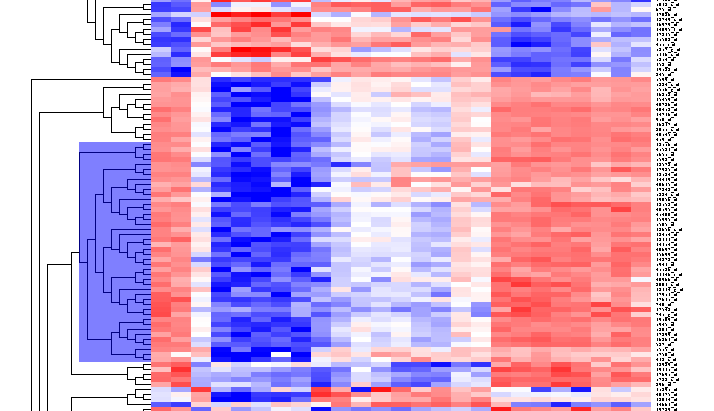
By scrolling down a bit, one finds a large interesting area, showing clear differences between groups of arrays. We will select two clearly differentiated clusters. Check the Enable Zoom checkbox. Then highlight the first cluster of 12 markers as shown here:
Then left-click to select this subset of the dendrogram. It will be displayed alone.
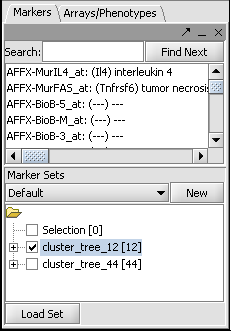
Now right-click and select "Add to Set". In the Markers component, the select genes are added as Cluster Tree [12], where 12 is the number of markers selected.
Repeat for the similar region just below, which contains another 44 markers.
This will result in two sets of markers having been added to the Markers component, as shown below:
