Difference between revisions of "MatrixREDUCE"
Hbussemaker (talk | contribs) (→Table Columns:) |
Hbussemaker (talk | contribs) (→Table Columns:) |
||
| Line 54: | Line 54: | ||
'''Seed sequence''' - the motif used as the seed for the PSAM fit. | '''Seed sequence''' - the motif used as the seed for the PSAM fit. | ||
| − | '''F''' - | + | '''F''' - regression coefficient resulting from the model fit. See eq 12, pg. e143 of Foat et al. 2006 [http://www.ncbi.nlm.nih.gov/pubmed/16873464?ordinalpos=9&itool=EntrezSystem2.PEntrez.Pubmed.Pubmed_ResultsPanel.Pubmed_DefaultReportPanel.Pubmed_RVDocSum link to paper]. |
| − | '''t''' - | + | '''t''' - t-value, equal to the regression coefficient divided by standard error. |
| − | '''P''' - P-value corresponding to the significance of the t-value | + | '''P''' - P-value corresponding to the significance of the t-value. |
| − | |||
| − | |||
| − | |||
| − | |||
| − | |||
| − | |||
===Sequence Tab=== | ===Sequence Tab=== | ||
Revision as of 10:31, 12 June 2009
Contents
Outline
This tutorial contains
- an overview of MatrixREDUCE,
- descriptions of data types, parameters, and the graphical user interface, and
- an example of a simple run of the program.
Overview
MatrixREDUCE is a tool for inferring the binding specificity and nuclear concentration of transcription factors from microarray data. The sequence specificity of the transcription factors' DNA-binding domain is modeled using a position-specific affinity matrix (PSAM), whose elements represent the change in the binding affinity whenever a specific position within a reference binding sequence is mutated. The PSAM(s) resulting from the fit to the microarray data can be displayed as an affinity logo or as a consensus sequence.
MatrixREDUCE was developed by Harmen Bussemaker at Columbia University. For further details see MatrixREDUCE.
Data Files
MatrixREDUCE operates on two data files plus an optional topological pattern file.
The data files required are a microarray gene expression dataset and a FASTA file containing the DNA sequences corresponding to the regulatory region of genes probed in the microarray experiment. The gene/probe identifiers used in the microarray dataset and the sequence identifiers used in the FASTA file must match. However, case is not important; the program will change the identifiers to lower case before attempting to match the records. If an identifier appears more than once in a file, the last instance is used.
The topological pattern can either be specified by name or loaded from an external file (via the adjacent "Load" button).
Parameters
(default values are shown in parentheses)
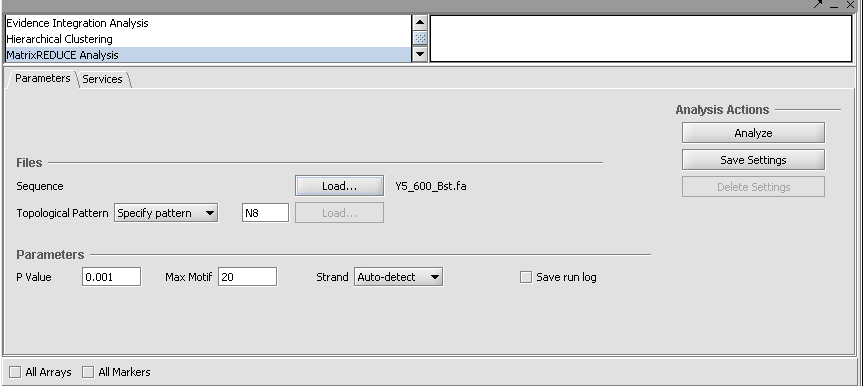
Topological Pattern - a flexible way to specify which motif patterns to search for; e.g. X6 for all hexamers, X3N5X3 for all dyads of trimers with a 5-bp spacer
P value - maximum p-value to accept a new motif (0.001).
Max Motif - Maximum # of motifs to search.
Strand - [("Auto-detect"), "Leading", "Reverse", "Both"]
Save run log - diagnostic messages from the run will be saved to a file.
Graphical Interface for results
PSAM Detail Tab
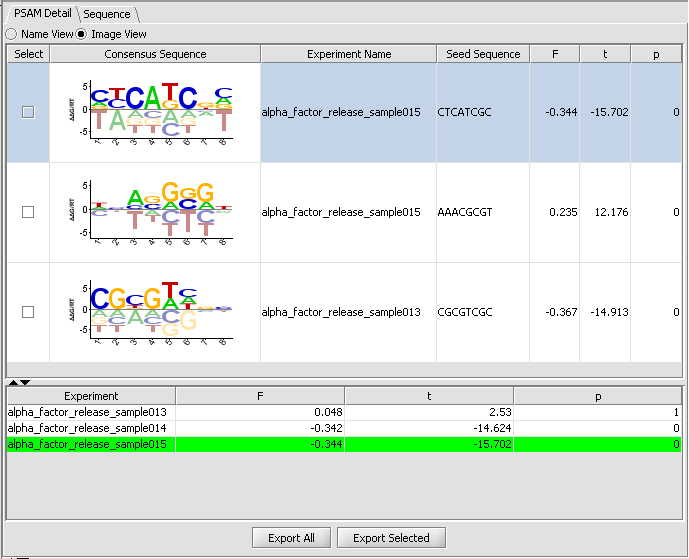
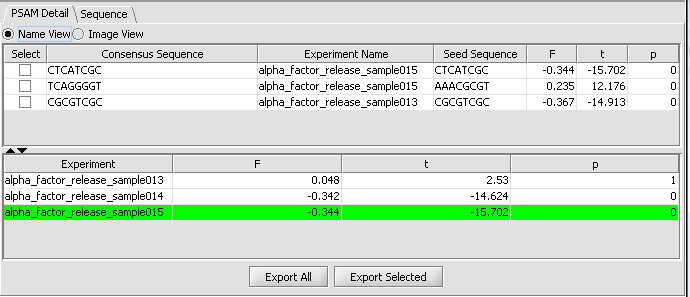
The PSAM detail tab displays the result PSAMs in a table format. Users can modify the display so that each PSAM is represented either by its sequence logo or its consensus sequence. Selected or all PSAMs can be exported to a text file using the "ExportAll" or "Export Selected" buttons.
Table Columns:
Select - If the box is checked, and the Export Selected button is pushed, the selected PSAMs will be exported to a file.
Consensus Sequence - This displays the PSAM resulting from the analysis as an affinity logo. The logo displays "the actual relative free energies of binding for each nucleotide at each position". The horizontal line indicates the average delta-delta-G at each position, each letter is placed above or below the line depending on whether its delta-delta-G is more or less favorable than the average. "The height of the letter can be interpreted as free energy difference from the average in units of RT." The tallest letters thus contribute most to the sequence specificity of the motif.
Experiment Name - the experiment used to fit the PSAM parameters, which had the strongest (absolute) correlation with the seed motif.
Seed sequence - the motif used as the seed for the PSAM fit.
F - regression coefficient resulting from the model fit. See eq 12, pg. e143 of Foat et al. 2006 link to paper.
t - t-value, equal to the regression coefficient divided by standard error.
P - P-value corresponding to the significance of the t-value.
Sequence Tab
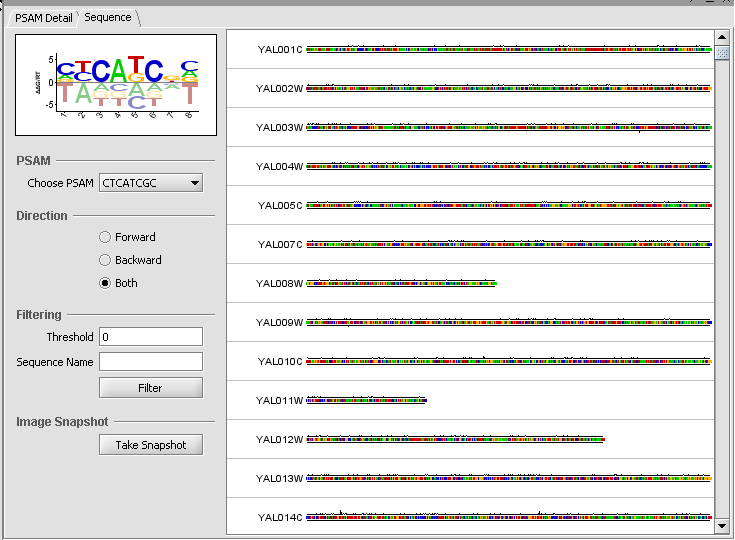
The sequence tab displays the DNA sequences of the regulatory region associated with each gene that is probed. Users can visualize the matching scores of PSAMs against each sequence. Sequence score is the product of weights w across all positions in the sliding window.
When a PSAM is selected, its weighted score is displayed graphically on the input (upstream) sequences (Affinity score graph). The system computes for every position an aggregate affinity score for all selected PSAMs and plots the scores along all sequence positions. Each score is between 0 and 1. Only scores larger than the designated cut-off threshold are drawn.
PSAM:
Choose PSAM - select which PSAM to slide along the upstream sequence to generate a score at each position.
Direction - controls whether to generate a sliding score for the Forward, Backward (Reverse) or both directions. Forward is displayed above the sequence, while Backward is displayed below the sequence.
Filtering:
Threshold - Only show sequences which have a weighted score exceeding the given threshold at some location along the sequence.
Sequence Name - Only show sequences matching the input name.
Image Snapshot
Take Snapshot - Places an image of the sequence view in the Project folders component.
Example
In this example, we will use two files that are included in the data directory of the geWorkbench distribution iteself. They are SpellmanReduced.txt and Y5_600_Bst.fa. SpellmanReduced.txt contains a subset of the data from Spellman 1998. Y5_600_Bst.fa contains the corresponding upstream DNA sequences for these genes.
1. In the Project Folders component, either use an existing Project, or create a new one.
2. Right-click on Project and select "Open File(s)".
3. Browse to the file SpellmanReduced.txt and set the file type to "Tab-Delimted". This file is found in the data directory of the geWorkbench installation. Open the file.
4. You will be asked for an annotations file. This is not needed for this example, so you can hit Cancel.
5. Go to the Analysis tab and select Matrix Reduce.
6. To load the sequence file, click the "Load..." button. Browser to the sequence file "Y5_600_Bst.fa" and open it.
7. Click Analyze to run MatrixREDUCE. (If you are running geWorkbench from a console window using ANT, you can follow the progress of the calculations there).
8. The result is placed as a node beneath the parent microarray dataset in the Project Folders component. At the same time, the results are displayed in the Visual Area of geWorkbench.
There are two tabs in the viewer, PSAM Detail and Sequence. Within PSAM Detail there are two options. The first is the Image view, which depicts the PSAM graphically.
The second viewing option is the Name view, which just shows the consensus sequence without the weighted components.
Finally, the Sequence tab depicts scores along each sequence.
References
- Foat BC, Houshmandi SS, Olivas WM, Bussemaker HJ. (2005). Profiling condition-specific, genome-wide regulation of mRNA stability in yeast. PNAS 102(49), 17675-17680. link to paper
- Foat BC, Morozov AV, Bussemaker HJ. (2006). Statistical mechanical modeling of genome-wide transcription factor occupancy data by MatrixREDUCE. Bioinformatics 22(14):e141-e149. link to paper
- Spellman et al., (1998). Comprehensive Identification of Cell Cycle-regulated Genes of the Yeast Saccharomyces cerevisiae by Microarray Hybridization. Molecular Biology of the Cell 9, 3273-3297.


