Difference between revisions of "Cellular Networks KnowledgeBase"
(→Selected Marker List) |
|||
| Line 24: | Line 24: | ||
=Working with the CNKB graphical interface= | =Working with the CNKB graphical interface= | ||
| + | |||
| + | |||
==Activated Marker List== | ==Activated Marker List== | ||
| Line 46: | Line 48: | ||
Items that have been added to the Selected Markers list are initially shown using an italic font, to indicate the CKNB has not yet been queried to retrieve their interaction information. After the query has been completed they are displayed in a normal font. (Red is used in both cases). | Items that have been added to the Selected Markers list are initially shown using an italic font, to indicate the CKNB has not yet been queried to retrieve their interaction information. After the query has been completed they are displayed in a normal font. (Red is used in both cases). | ||
| − | Items that have been added to the Selected Markers list can be removed and sent back to the Activated Markers list by double clicking on their entries. | + | Items that have been added to the Selected Markers list can be removed and sent back to the Activated Markers list by double clicking on their entries or through a right-click menu. The right-click menu gives the choice of moving only highlighted, or all markers back to the Activated Markers list. |
Before a query has been run, the markers are shown in red, italicized letters. After the query has been run against the CNKB database, the marker entries are shown in regular font, blue letters. | Before a query has been run, the markers are shown in red, italicized letters. After the query has been run against the CNKB database, the marker entries are shown in regular font, blue letters. | ||
| Line 67: | Line 69: | ||
Hovering the mouse cursor over an entry in the GO Description column will display a short summary of the Gene Ontology terms associated with that entry. | Hovering the mouse cursor over an entry in the GO Description column will display a short summary of the Gene Ontology terms associated with that entry. | ||
| + | |||
| + | |||
| + | [[Image:T_CNKB_GO_hover_text.png]] | ||
| + | |||
More extensive GO annotations can be viewed for desired genes in the Selected Marker list by right-clicking on its entry. A pop-up menu will offer a choice of the three categories of GO annotation: Component, Function and Process. Expanding one of these terms will show the available annotations for that gene. | More extensive GO annotations can be viewed for desired genes in the Selected Marker list by right-clicking on its entry. A pop-up menu will offer a choice of the three categories of GO annotation: Component, Function and Process. Expanding one of these terms will show the available annotations for that gene. | ||
| + | |||
| + | |||
| + | [[Image:T_CNKB_GO_rightclick_menu.png]] | ||
| + | |||
| + | |||
| + | |||
===# of Protein-DNA, Protein-Protein Interactions=== | ===# of Protein-DNA, Protein-Protein Interactions=== | ||
| Line 79: | Line 91: | ||
==Throttle Graph== | ==Throttle Graph== | ||
This interactive graph allows users to "throttle" (for the genes in the Selected Markers table) which interactions to work with, using as a criterion the interactions’ confidence indicator. As the required threshold of likelihood of the interactions is increased, the sum of interactions meeting this criterion decreases. | This interactive graph allows users to "throttle" (for the genes in the Selected Markers table) which interactions to work with, using as a criterion the interactions’ confidence indicator. As the required threshold of likelihood of the interactions is increased, the sum of interactions meeting this criterion decreases. | ||
| + | |||
| + | * '''Right-click menu''' - Right-clicking on the Throttle Graph will bring up a menu which allows the graph to be customized. | ||
| + | |||
| + | |||
| + | [[Image:T_CNKB_ThrottleGraph_rightclick_menu.png]] | ||
| + | |||
| + | |||
=Creating an interaction network and viewing it in Cytoscape= | =Creating an interaction network and viewing it in Cytoscape= | ||
Revision as of 18:04, 9 October 2009
|
Home | Quick Start | Basics | Menu Bar | Preferences | Component Configuration Manager | Workspace | Information Panel | Local Data Files | File Formats | caArray | Array Sets | Marker Sets | Microarray Dataset Viewers | Filtering | Normalization | Tutorial Data | geWorkbench-web Tutorials |
Analysis Framework | ANOVA | ARACNe | BLAST | Cellular Networks KnowledgeBase | CeRNA/Hermes Query | Classification (KNN, WV) | Color Mosaic | Consensus Clustering | Cytoscape | Cupid | DeMAND | Expression Value Distribution | Fold-Change | Gene Ontology Term Analysis | Gene Ontology Viewer | GenomeSpace | genSpace | Grid Services | GSEA | Hierarchical Clustering | IDEA | Jmol | K-Means Clustering | LINCS Query | Marker Annotations | MarkUs | Master Regulator Analysis | (MRA-FET Method) | (MRA-MARINa Method) | MatrixREDUCE | MINDy | Pattern Discovery | PCA | Promoter Analysis | Pudge | SAM | Sequence Retriever | SkyBase | SkyLine | SOM | SVM | T-Test | Viper Analysis | Volcano Plot |
Contents
- 1 Overview
- 2 Working with the CNKB graphical interface
- 3 Creating an interaction network and viewing it in Cytoscape
- 4 Example of using the CNKB component
- 5 Appendix - Data Sources
- 5.1 CNKB for geWorkbench queries
- 5.1.1 B-cell lymphoma Interactome (INTERACTOME) (Della Favera/Califano labs, collected by Celine Lefebvre)
- 5.1.2 Munich Information Center for Protein Sequences (MIPS)
- 5.1.3 Protein-protein interaction database at EBI (INTACT). No species restriction.
- 5.1.4 The Molecular INTeraction database (MINT)
- 5.1.5 The Biomolecular Interaction Network Database (BIND)
- 5.1.6 Database of Interacting Proteins (DIP)
- 5.1.7 Reactome knowledgebase (REACTOME)
- 5.1.8 Human Protein Reference Database (HPRD)
- 5.1.9 Geneways (GENEWAYS)
- 5.1 CNKB for geWorkbench queries
- 6 References
Overview
General
The Cellular Network Knowledge Base (CNKB) is a repository of interactions between protein-protein and protein-DNA interactions (these interactions can be either computationally or experimentally derived). Both direct, physical interactions can be captured as well as indirect transcriptional relationships (where an interaction is between a transcription factor and its gene target). Each pairwise interaction has an associated confidence indicator (a value between 0 and 1) reflecting the strength of the underlying data, whether experimental or computational. Details on the methodology used to construct the CNKB are available in Mani et al. 2008.
Gene interaction information from the CNKB can be used, for example, in order to assess the plausibility of a hypothesis of concerted molecular action represented by a gene set that has been discovered using computational approaches (e.g., by running a clustering analysis on a microarray set to identify tandems of co-expressed genes). If the genes in such a set are reported in the CNKB to have several direct interactions (or several common targets) then this may be evidence that the gene set indeed reflects at some level a real biological process.
The CNKB component allows the user to select a group of markers and specify for each the interaction type of interest (Protein-Protein and/or Protein-DNA). All interactions (of the designated types) involving the selected markers are retrieved from the CNKB and displayed (along with associated information such as GO annotation, interaction attributes, etc) both in the CNKB component and also in Cytoscape.
The CNKB graphical interface
The CNKB component displays a list of markers that have been activated in the Markers component. The user can select from these markers by double-clicking them; those selected will be added to the Selected Marker List just below.
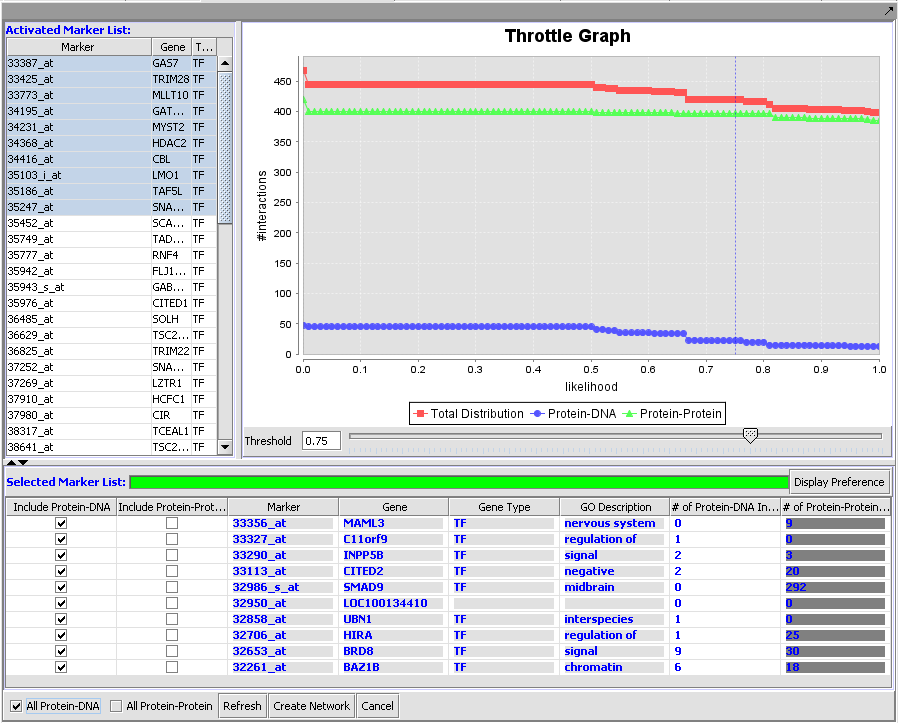
The graphical user interface (GUI) of the CNKB component has three areas of distinct functionality: The "Activated Marker List", the "Selected Marker List", and the "Throttle Graph". To use the component a microarray set node must first be selected in the Project Folders area of geWorkbench and then one or more marker sets from the Markers component must be activated. The markers in those activated marker sets will appear in the "Activated Marker List" area of the the CNKB GUI. From there, one or more markers can be selected and moved into the "Selected Marker List" (markers can be selected one at a time by double-clicking; or they can be selected as a group and moved by right-clicking on the selection). Communication with the CNKB database is initiated by clicking on the "Refresh" button and all pairwise interactions that involve genes represented by a marker in the "Select Marker List" are retrieved (an interaction is retrieved if at least one of its 2 members is in the "Selected Marker List"). There are 2 types of interactions stored in the CNKB: Protein-Protein and Protein-Dna (the latter indicating transcriptional relationships between transcription factors and their target). The aggregate number (across all genes) of retrieved interactions is displayed on the Throttle Graph. Three distinct graphs are drawn, showing the aggregate for each of the two interaction categories as well as their combined total.
The interactions can be assembled into a network and visualized in the Cytoscape component. This is achieved by clicking on the "Create Network" button. The x-axis slider in the Throttle graph can be used to threshold which interactions will be included in the Cytoscape network; by moving the slider to any given threshold value from 0-1, only interactions whose confidence level is above the threshold will be retained. Further, it is possible to include/exclude interactions that belong to one or the other type. To that end, the checkboxes in the "Selected Marker List" can be used.
Working with the CNKB graphical interface
Activated Marker List
The "Activated Marker List" contains the markers that belong to activated marker sets from the Markers component. It contains 3 columns:
Marker
The marker name (comes from the microarray set node selected in the Project Folders area).
Gene
The gene name corresponding to the marker, if loaded from an annotation file.
Type
A gene type designation, derived from the gene's GO annotation:
- TF - Transcription Factor,
- K - Kinase,
- P - Phosphatase, and
- (no entry) - type is unknown.
Individual markers in the Activated Marker List can be moved to the Selected Markers List by double-clicking on them.
Selected Marker List
The "Selected Markers List" table contains the subset of markers from the "Activated Marker List" about which information will be retrieved from the CNKB.
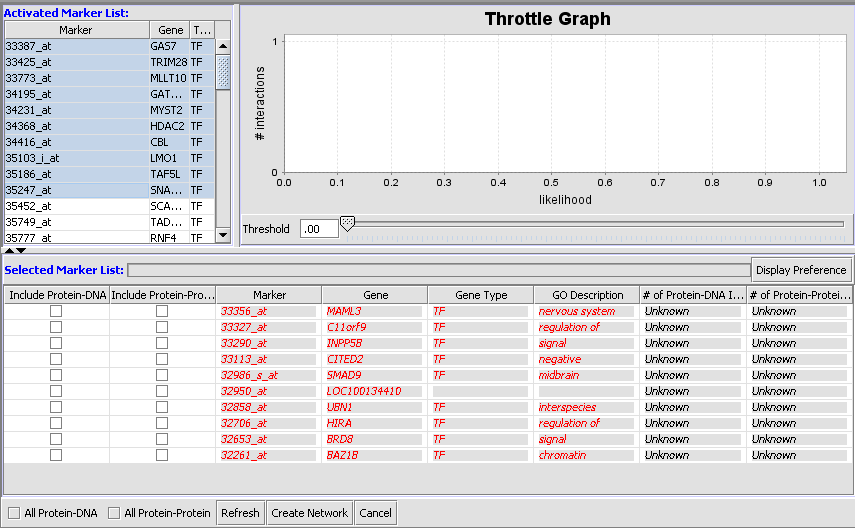
Items that have been added to the Selected Markers list are initially shown using an italic font, to indicate the CKNB has not yet been queried to retrieve their interaction information. After the query has been completed they are displayed in a normal font. (Red is used in both cases).
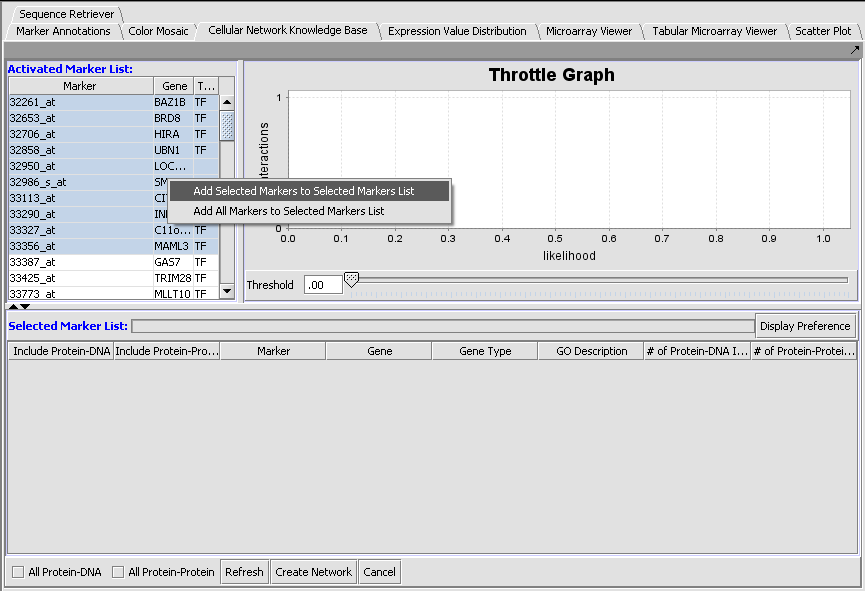
Items that have been added to the Selected Markers list can be removed and sent back to the Activated Markers list by double clicking on their entries or through a right-click menu. The right-click menu gives the choice of moving only highlighted, or all markers back to the Activated Markers list.
Before a query has been run, the markers are shown in red, italicized letters. After the query has been run against the CNKB database, the marker entries are shown in regular font, blue letters.
The Selected Marker List table contains the following columns:
Include Protein-DNA, Include Protein-Protein
Check boxes used to specify which type(s) of interactions to use when assembling the Cytoscape network. These check boxes do not affect retrieval of interactions from the CNKB database, only network creation.
Marker
The marker name (same as in the "Activated Marker List"). Appears italicized to indicate that interaction information has not yet been retrieved. Bold face font indicates that interaction information has been retrieved (and is displayed).
Gene
The gene name corresponding to the marker, if loaded from an annotation file (same as in the "Activated Marker List").
Gene Type
A gene type designation, derived from the gene's GO annotation The list of type codes is the same as that under Type under "Activated Marker List".
GO Description
The GO annotation of the gene. Right clicking on the column brings up the the gene GO classification of the gene across the 3 top-level GO categories: Component, Function and Process.
Hovering the mouse cursor over an entry in the GO Description column will display a short summary of the Gene Ontology terms associated with that entry.
More extensive GO annotations can be viewed for desired genes in the Selected Marker list by right-clicking on its entry. A pop-up menu will offer a choice of the three categories of GO annotation: Component, Function and Process. Expanding one of these terms will show the available annotations for that gene.
# of Protein-DNA, Protein-Protein Interactions
These entries display the number of interactions (of each type) that pass the confidence threshold specified by the x-axis slider in the Throttle Graph. The values in these columns will change when the slider moves. A value will be displayed grayed out if its corresponding checkbox (from the first 2 columns in the table) is not enabled. This acts as a visual reminder that those interaction will not be included in the interaction network constructed when clicking on the "Create Network" button.
Display Preferences
The “"Display Preferences" button can be used to control how many of the columns listed above are visible within the Selected Marker List.
Throttle Graph
This interactive graph allows users to "throttle" (for the genes in the Selected Markers table) which interactions to work with, using as a criterion the interactions’ confidence indicator. As the required threshold of likelihood of the interactions is increased, the sum of interactions meeting this criterion decreases.
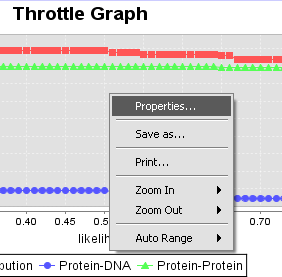
- Right-click menu - Right-clicking on the Throttle Graph will bring up a menu which allows the graph to be customized.
Creating an interaction network and viewing it in Cytoscape
Once the desired set of markers is present and its interation data has been retrieved from the database, an adjacency matrix can be computed by clicking the "Create Network" button. The resulting matrix is placed in the Project Folders component under its parent microarray dataset. The adjacency matrix is visualized in the Cytoscape Viewer.
Please note that if the targets retrieved from the Knowledge Base include genes not present in the active microarray dataset, then those targets will not be displayed in the Cytoscape viewer.
The Cytoscape Viewer maintains a list of networks which it has currently loaded (See image after Example step 8 below). It allows individual loaded networks to be deleted. However, the network can be reloaded by clicking on its entry in the Project Folders component. Cytoscape controls are more fully described in the Cytoscape component tutorial.
Example of using the CNKB component
This example uses the Bcell-100.exp dataset available in the data/public_data directory of geWorkbench, and further described on the Download page. Briefly, this dataset is composed of 100 Affymetrix HG-U95Av2 arrays on which various B-cell lines, both normal and cancerous, were analyzed. Thus it explores a potentially wide variety of expression phenotypes.
Prerequisites
- Obtain the annotation file for the HG-U95Av2 array type from the Affymetrix NetAffx website (http://www.affymetrix.com/analysis/index.affx). The name will be similar to "HG_U95Av2.na29.annot.csv", where na29 is the version number. Loading the annotation file associates gene names and Gene Ontology information with the Affymetrix probeset IDs (see the geWorkbench FAQ for details on obtaining these files).
Loading the example data
- Load the Bcell-100.exp dataset into geWorkbench as type "Affymetrix File Matrix". (See Local Data Files).
- When prompted, load the annotation file.
- Create and activate a set of markers in the Markers component. For this example, load the file "70_TFs_from_HG-U95Av2.na28.csv" directly into the Markers component by pushing its "Load Set" button and browsing to the file located in the geWorkbench directory data/public_data.
When the set is activated by checking the box to the left of its name, the 70 transcription factor markers will appear in the "Activate Markers" list in the CNKB component.
Setting up the query in the CNKB component
1. We will now show how to select just a subset of the activated markers for use in the query. Highlight the first 10 markers on the list (Shift-right-click). Right-clicking on the "Activated Markers" list will then bring up a menu which allows one to move all activated markers or just the highlighted markers to the "Selected Markers List" for querying.
Select "Add Selected Markers to Selected Markers List".
The 10 selected markers now appear in the the "Selected Markers List". They appear in red and in italics, indicating the query has not yet been performed.
2. Now hit the "Refresh" button to perform the query against the Cellular Networks Knowledge Base database. The results are now displayed in regular font, blue letters to show that the query has been completed.
3. The Throttle Graph allows one to set a minimum confidence requirement on interactions that will be used to create a network. In the figure above we have adjusted the cutoff to 75% confidence.
4. Check the "All Protein-DNA" box to limit network creation to only protein-DNA interactions.
5. Hit the "Create Network" button.
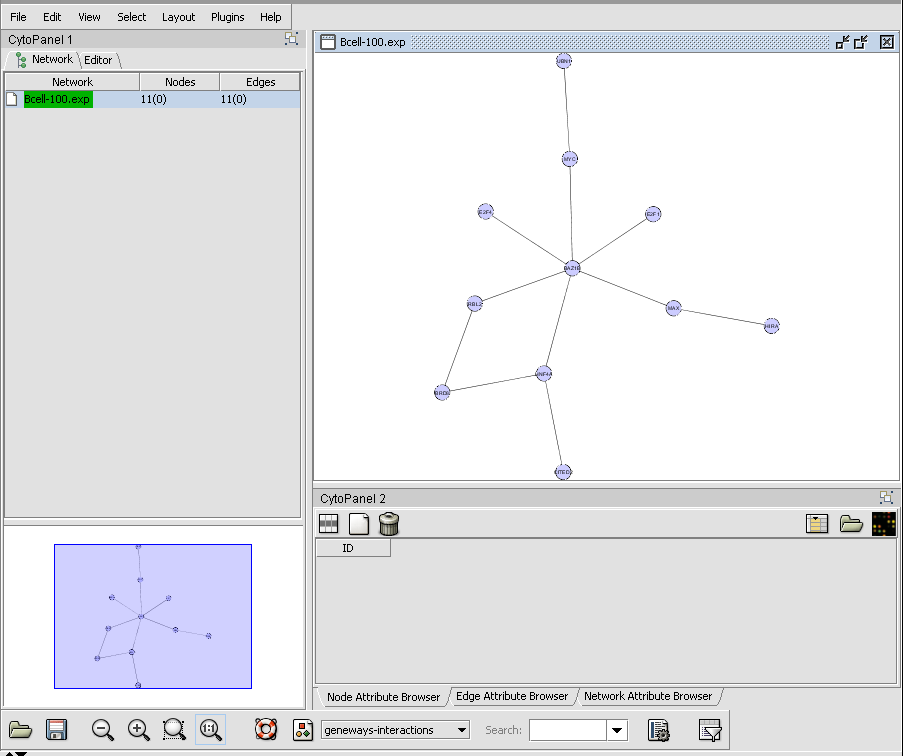
8. The resulting adjacency matrix is displayed in the Cytoscape component.
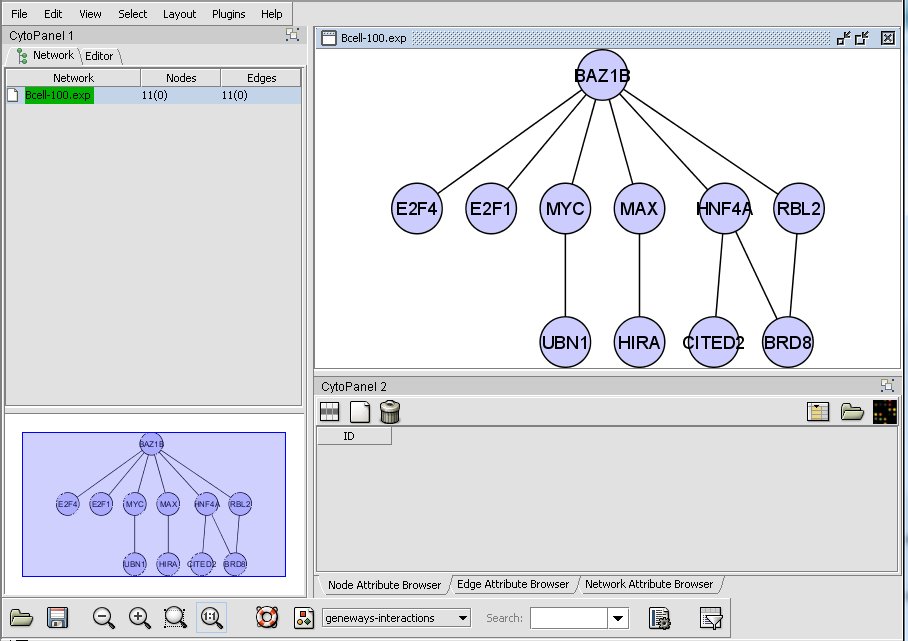
9. Within Cytoscape, changing the layout to yFiles->Hierachic will redraw the network in a hierachical fashion.
Appendix - Data Sources
Cellular Network Knowledge Base (CNKB) Source Descriptions & Interaction Statistics
CNKB for geWorkbench queries
The CNKB itself is comprised of data from sources shown in the following sections. However, geWorkbench only queries for two types of interactions, protein-protein and protein-dna, coded in the database as "ppi" and "pdi".
As of 7/1/2009, the following datasources will match these geWorkbench queries:
- PPI: BIND, HPRD, INTACT, INTERACTOME, MIPS.
- PDI: BIND, INTERACTOME.
B-cell lymphoma Interactome (INTERACTOME) (Della Favera/Califano labs, collected by Celine Lefebvre)
- 12,902 protein-dna interactions
- 22,734 protein-protein interactions
Munich Information Center for Protein Sequences (MIPS)
- http://mips.gsf.de/proj/ppi/
- 322 protein-protein interactions
Protein-protein interaction database at EBI (INTACT). No species restriction.
- http://www.ebi.ac.uk/intact/site/index.jsf
- 7,701 interactions
The Molecular INTeraction database (MINT)
- http://mint.bio.uniroma2.it/mint/Welcome.do
- 3,196 human interactions
- MINT focuses on experimentally verified protein interactions mined from the scientific literature by expert curators.
The Biomolecular Interaction Network Database (BIND)
- http://bond.unleashedinformatics.com/Action?pg=23299#BIND
- 48,573 protein-protein interactions (various species)
Database of Interacting Proteins (DIP)
- http://dip.doe-mbi.ucla.edu/dip/Guide.cgi
- 820 human protein-protein interaction pairs
Reactome knowledgebase (REACTOME)
- http://www.reactome.org/
- Reactome knowledgebase
- 27,534 human protein-protein interaction pairs
Human Protein Reference Database (HPRD)
- http://www.hprd.org/
- 36,501 protein-protein interactions
Geneways (GENEWAYS)
- http://geneways.genomecenter.columbia.edu/
- 27,938 interactions
- GeneWays is a system for automatically extracting, analzying, visualizing and integrating molecular pathway data from the research literature.
References
- Mani KM, Lefebvre C, Wang K, Lim WK, Basso K, Dalla-Favera R, Califano A., " A systems biology approach to prediction of oncogenes and molecular perturbation targets in B-cell lymphomas", Molecular Systems Biology 4:169, 2008 link to paper
