Difference between revisions of "Cytoscape Network Viewer"
(→Correlation: Example) |
(→Correlation: Example) |
||
| Line 383: | Line 383: | ||
''Graph Correlation Values'' | ''Graph Correlation Values'' | ||
| − | + | One can examine a histogram of the correlation values. This can aid in setting a reasonable cutoff for the correlation threshold used in visualizing the network overlap. | |
| Line 392: | Line 392: | ||
This slider allows the threshold for accepting an edge based on its Pearson's correlation coefficient to be set. | This slider allows the threshold for accepting an edge based on its Pearson's correlation coefficient to be set. | ||
| − | |||
| − | |||
| − | |||
| − | |||
| − | |||
| − | |||
''Redraw network'' | ''Redraw network'' | ||
| − | + | Only edges that meet the threshold Pearson's correlation value are displayed. All nodes are retained. Edges are colored red or blue according to positive or negative correlation, respectively. | |
| Line 411: | Line 405: | ||
[[Image:Cytoscape_correlation_redrawn_network_detail_v2.2.png]] | [[Image:Cytoscape_correlation_redrawn_network_detail_v2.2.png]] | ||
| + | |||
| + | |||
| + | |||
| + | ''Create subnetwork'' | ||
| + | |||
| + | Creates a subnetwork containing only nodes that are connected by above-threshold correlation results. | ||
| + | |||
| + | [[Image:Cytoscape_correlation_subnetwork_displayed_v2.2.png]] | ||
| + | |||
| + | |||
Revision as of 18:10, 4 February 2011
Contents
- 1 Overview
- 2 Layout of the Cytoscape component
- 3 Selecting Nodes and Edges
- 4 Options for selected nodes
- 5 Projecting marker sets onto Cytoscape
- 6 Altering the view in Cytoscape
- 7 Network commands
- 8 Changes coming in geWorkbench v2.2
- 9 References
Overview
Cytoscape (www.cytoscape.org) is a sophisticated network and pathway visualization tool that has been incorporated into geWorkbench as a component. Within geWorkbench, Cytoscape is used to depict putative interaction networks, for example as created from running ARACNe or a Cellular Network Knowledge Base query. Both of these tools return "adjacency matrices", that is, interaction networks, to the Project Folders component.
Cytoscape has been integrated into geWorkbench in such a way that it can communicate in both directions with the Markers component.
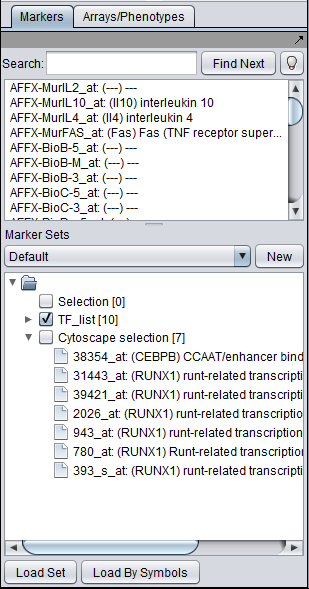
- Nodes in a Cytoscape network can be selected individually or by drawing a selection box around them. This will result in the selected nodes being placed into the "Cytoscape selection" set in the Markers component.
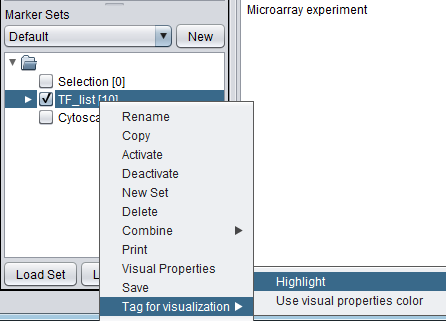
- A set of markers in the Markers component can be labeled with the "tag for visualization" property, which will project that set onto the network depicted in Cytoscape. Those markers in the intersection of the tagged set and the network display will be highlighted in yellow.
The use of Cytoscape, and its interactions with geWorkbench, are described in the following sections. The figures shown in this chapter were generated using the query results obtained in the Cellular_Networks_KnowledgeBase chapter.
First we will describe the layout of the Cytoscape graphical interface.
Layout of the Cytoscape component
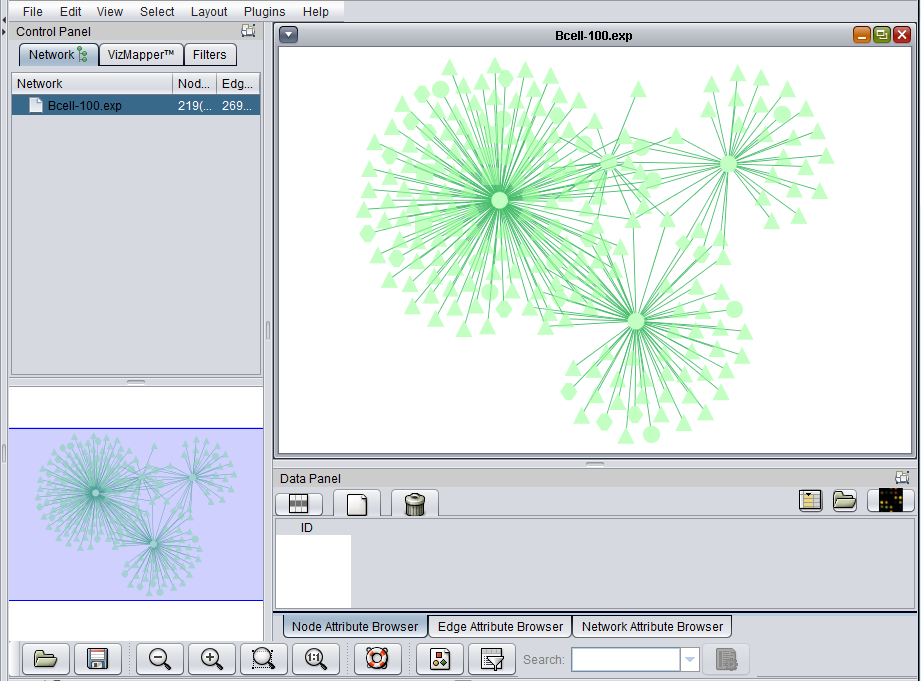
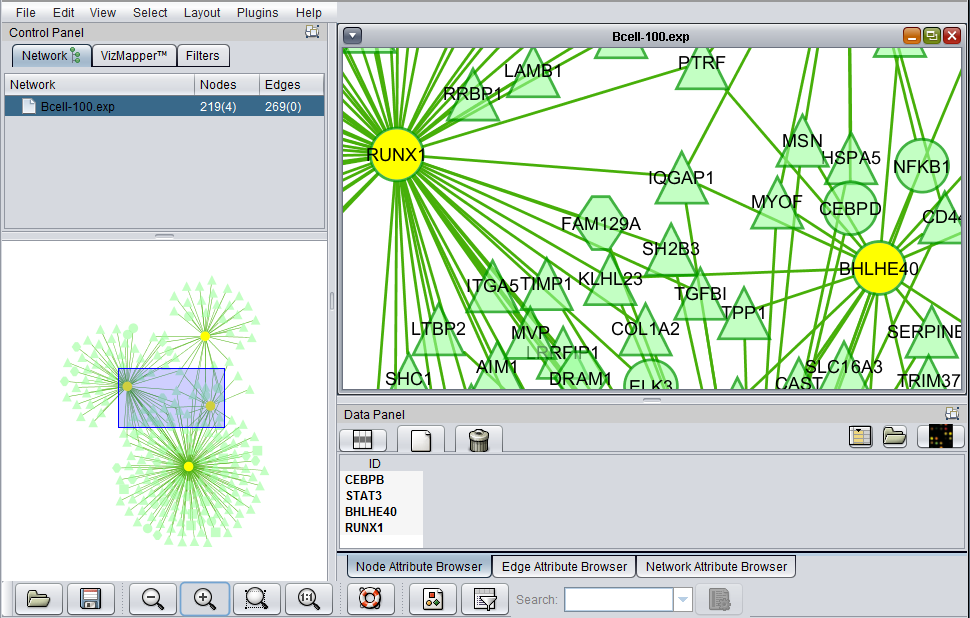
The Cytoscape component has 4 main areas:
- At upper left is a list of networks that have been loaded into Cytoscape, showing the network name and the number of nodes and edges. In addition, the numbers in parentheses show the numbers of nodes and edges which have been highlighted (selected) in the network depiction.
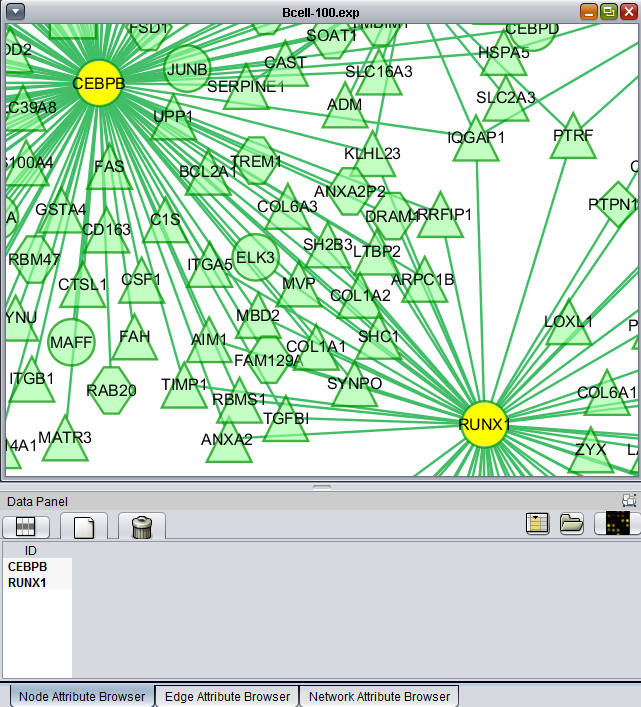
- At upper right is the main network depiction pane. Gene or protein symbols/names will be depicted if available. However, if for example an Affymetrix microarray dataset was read in but no annotation file was associated with it, then only probeset names will appear. Selected nodes are depicted in yellow and are returned to the "Cytoscape selection" set in the Markers component. Selected edges are depicted in red.
- At lower left is a navigation tool which shows the entire network and the location and size (purple rectangle) of the current viewing pane. The purple viewing pane can be moved about the network as desired. This is done by left-clicking with the mouse in the purple rectangle and moving it.
- At lower right, nodes or edges that have been selected in the network display will appear in the Data Panel.
Selecting Nodes and Edges
This section depicts the network generated in the Cellular_Networks_KnowledgeBase chapter.
Selecting interactions (edges)
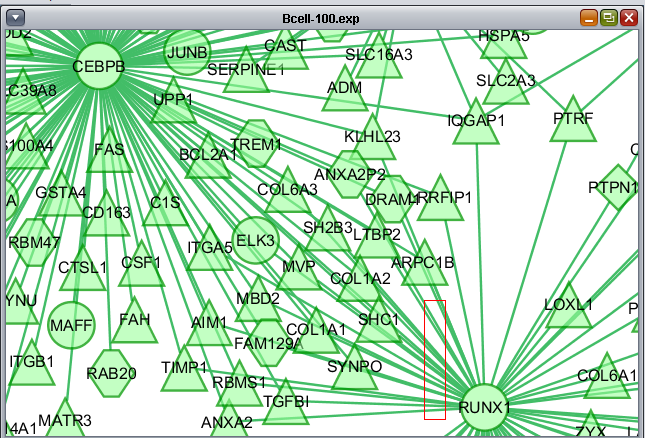
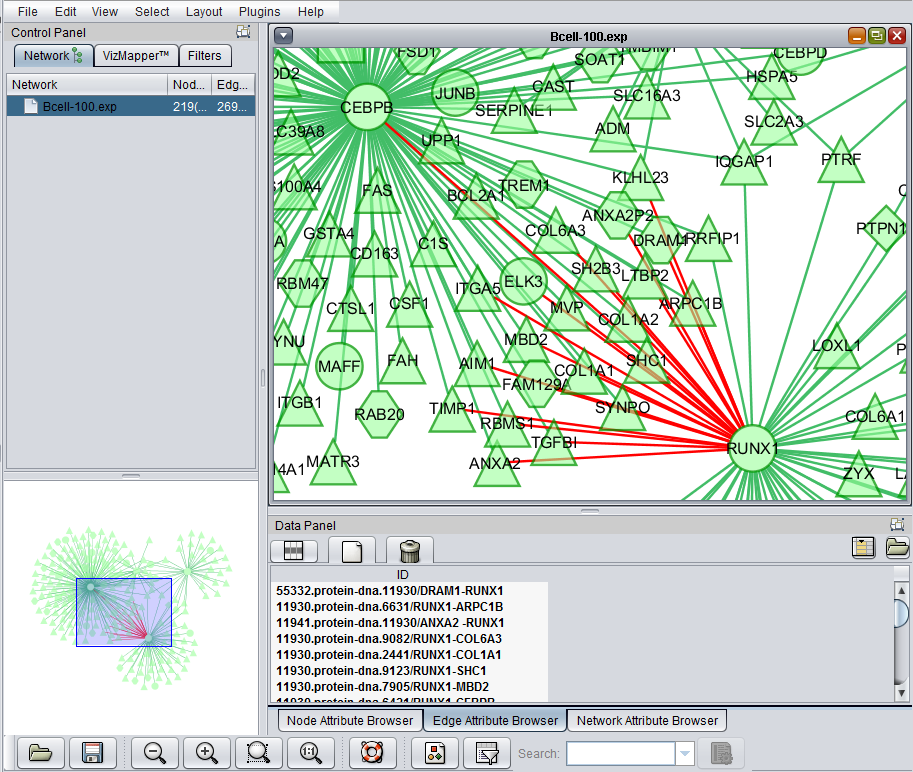
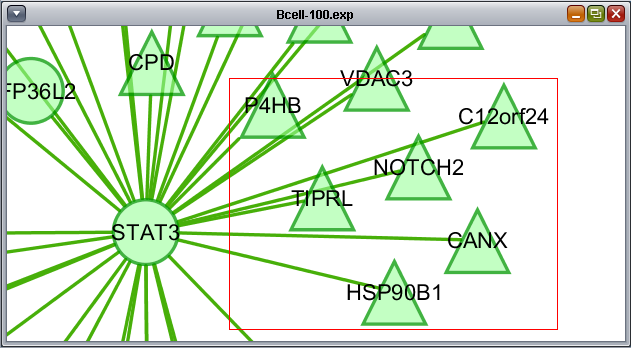
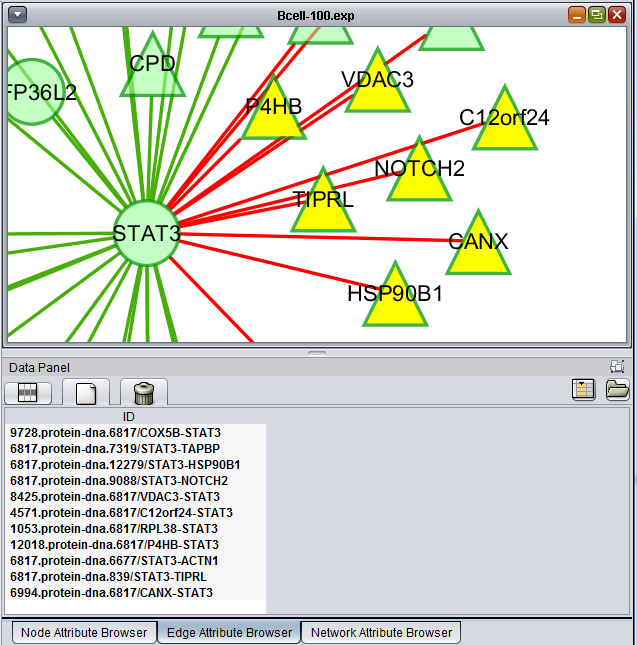
Using the mouse, a group of edges can be selected. Hold down the mouse button while drawing a box on the screen around the desired edges. The box will appear in red.
The list of selected edges is displayed in a list below the graph, in a tab titled "Edge Attribute Browser".
Selecting Markers/Genes (nodes)
- Individual nodes and/or edges can be selected in Cytoscape by clicking on them with the mouse.
- To select multiple nodes or edges, hold down the Shift key while making the selection.
- Alternatively, a selection box can be drawn around both nodes and edges by left-clicking in the network diagram and selecting the desired targets.
The markers corresponding to the selected genes will be displayed directly in the Markers component in a new subset called "Cytoscape selection". Note that this set is dynamically updated - it displays markers corresponding to whatever nodes are currently highlighted in the network graph.
If a gene in the Cytoscape display is represented by more than one probeset, all of its probesets will appear in the Markers component.
To make a permanent copy of a particular set of dynamically chosen markers in the "Cytoscape Selection" subset, right-click on it and select "Copy".
Selecting both nodes and edges
A selection box, described above for selecting edges, can also be drawn to include both nodes and edges at the same time.
The selected nodes and edges will be listed in the Node Attribute Browser and Edge Attribute Browser lists below the network diagram.
Options for selected nodes
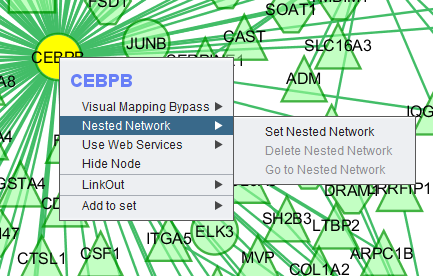
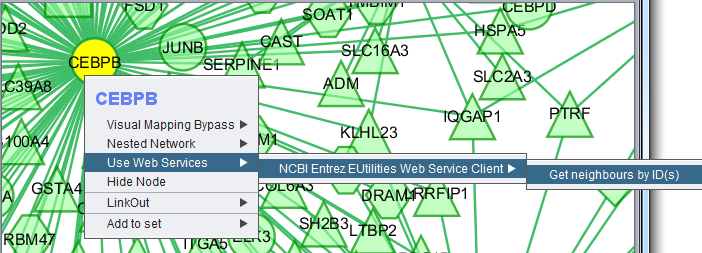
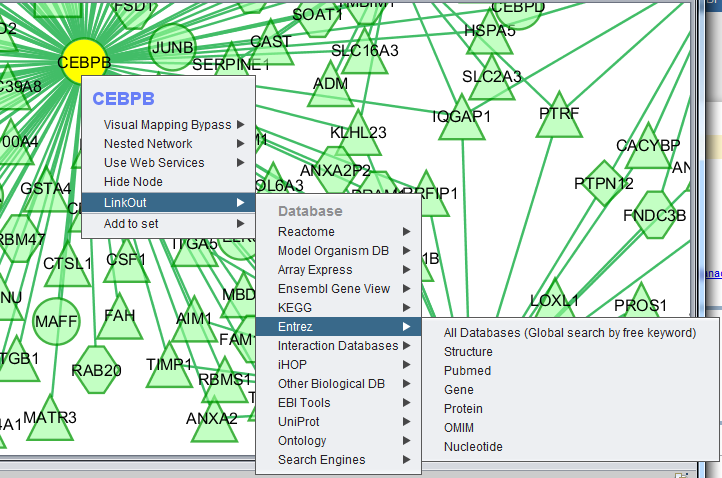
Right-clicking on a particular node in the network graph brings up a menu with a number of options describe below.
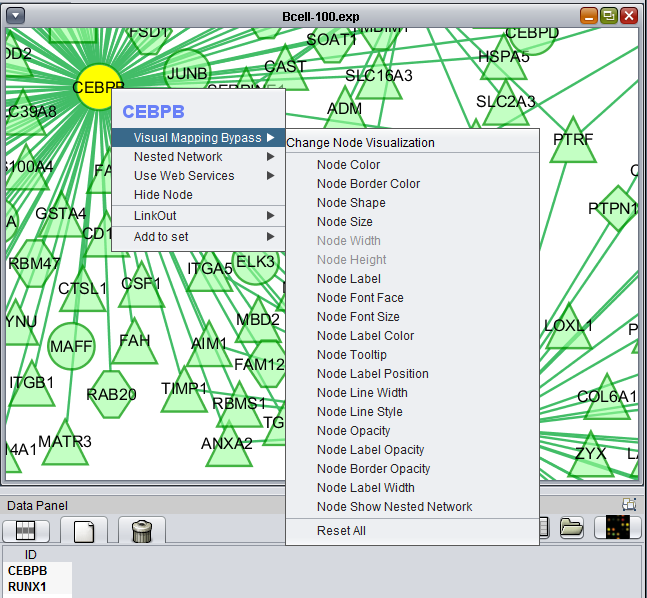
Visual Mapping Bypass
From this menu any attribute of the node such as color and shape can be altered.
Nested Network
Use Web Services
Hide Node
Selecting "Hide Node" will cause any selected nodes and all their edges to disappear.
So far, the only way we have found to rematerialize a hidden node is to go the Cytoscape Network tab, select the network, destroy its view and then create a new view.
LinkOut
This menu option provides hyperlinks to a number of external sources of gene annotation.
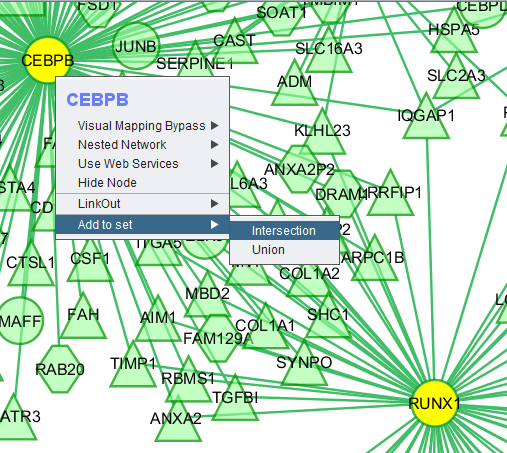
Add to set
If one or more graph nodes have been selected (highlighted in yellow in figure below), the markers they directly interact with (via edges) can be copied to the default "Cytoscape selection" subset in the Markers component at lower left in the geWorkbench graphical interface.
Two options are available under "Add to Set". These are
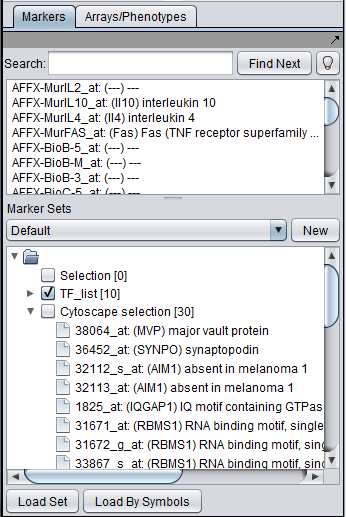
- Intersection - find the set of markers that have interactions (edges) with ALL selected nodes. Such markers are placed into the Markers component, in the "Cytoscape selection" subset.
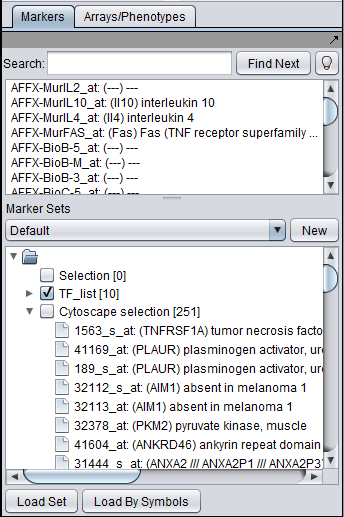
- Union - find the set of markers that have interactions (edges) with ANY of the selected nodes. Such markers are placed into the Markers component, in the "Cytoscape selection" subset.
This image shows the intersection set of markers for the two selected genes. There are 30 markers in the intersection:
This image shows the union set of markers for the two selected genes. There are 251 markers in the union.
Note - For each gene included in the UNION or INTERSECTION, there may be more than one marker associated with it. If so, all markers belonging to a particular gene in a UNION or INTERSECTION result will be returned to to the Markers component "Cytoscape Selection" set.
Projecting marker sets onto Cytoscape
The diagram below illustrates projecting a set defined in the Markers component back onto the Cytoscape network diagram. In this case, the set of transcription factors originally used in to form the CNKB query which generated this example is labeled with "tag for visualization" by right-clicking on it and selecting this menu option.
Each gene or marker that is present at least once in the tagged set, and which is also present in the drawn network, is highlighted in yellow in the network display.
Altering the view in Cytoscape
The use of the sliding viewpane at lower left to navigate about the main drawn network has already been mentioned - it can be grabbed and moved by left-clicking on it with the mouse.
There are several more controls arrayed about the lower edge of the Cytoscape component. These include four magnifying glass icons:
- "minus" - zoom out.
- "plus" - zoom in.
- "open" - zoom to display selected region.
- "1:1" - zoom out to display all of current network.
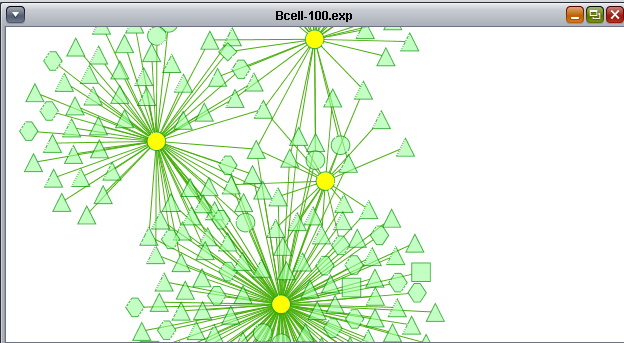
In the image below, the view has been zoomed in:
Network commands
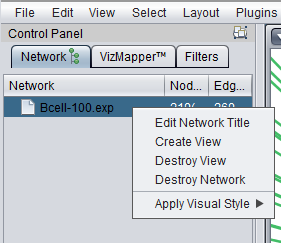
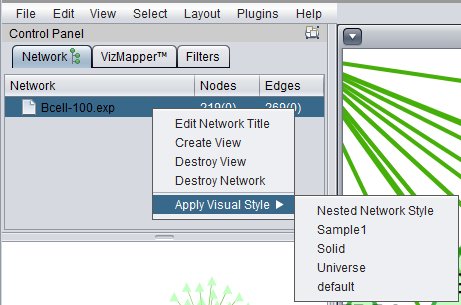
Right-clicking on a listed network in Cytoscape will bring up a menu with the following choices:
Edit Network Title
Edit the title of the network.
Create View
Recreate the network graphics.
Destroy View
Remove the network graphics.
Destroy Network
Completely remove the network from Cytoscape. Note that this does not remove the network adjacency matrix from the geWorkbench Project Folders component. The network can be recreated in Cytoscape by clicking on the appropriate adjacency matrix in the Project Folders component.
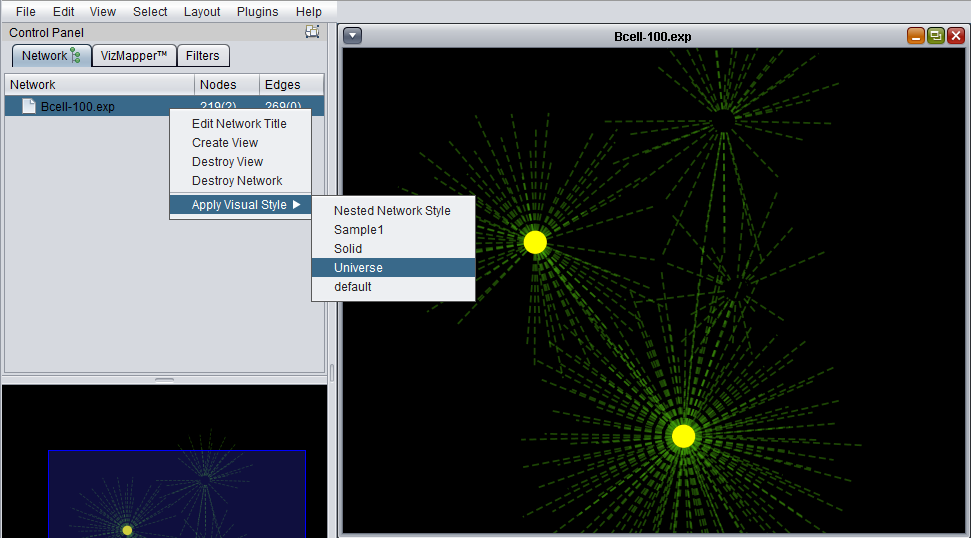
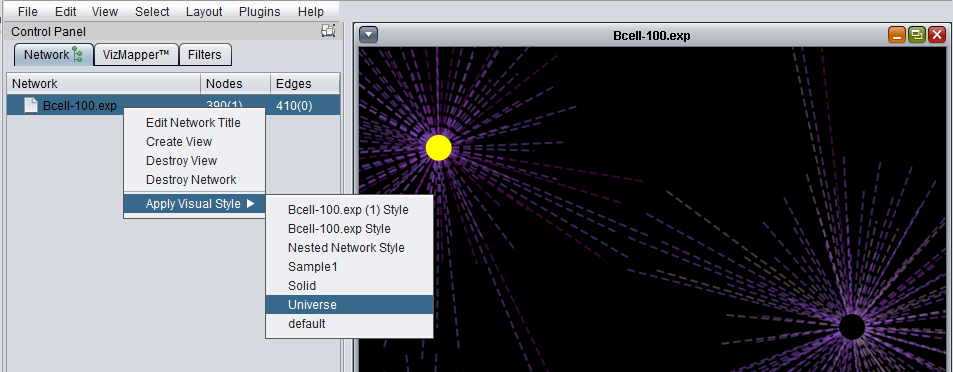
Apply Visual Style
A number of different "visual styles" can be applied to the displayed network. The figure below shows the result of applying the "Universe" style to a network where two nodes are selected (yellow).
Changes coming in geWorkbench v2.2
A number of enhancements have been made to how geWorkbench can interact with the Cytoscape component. These enhancements have been completed in the development version of geWorkbench, and will be included in the next major release, which will be version 2.2.0 (expected by mid 2011). See the geWorkbench FAQ for instructions on how to obtain and compile the development version of geWorkbench.
As the additions to the functionality are quite interesting and useful, they are described here pre-release. As testing of the new features is ongoing, they should be regarded as being of beta-release quality.
Edges colored by interaction type
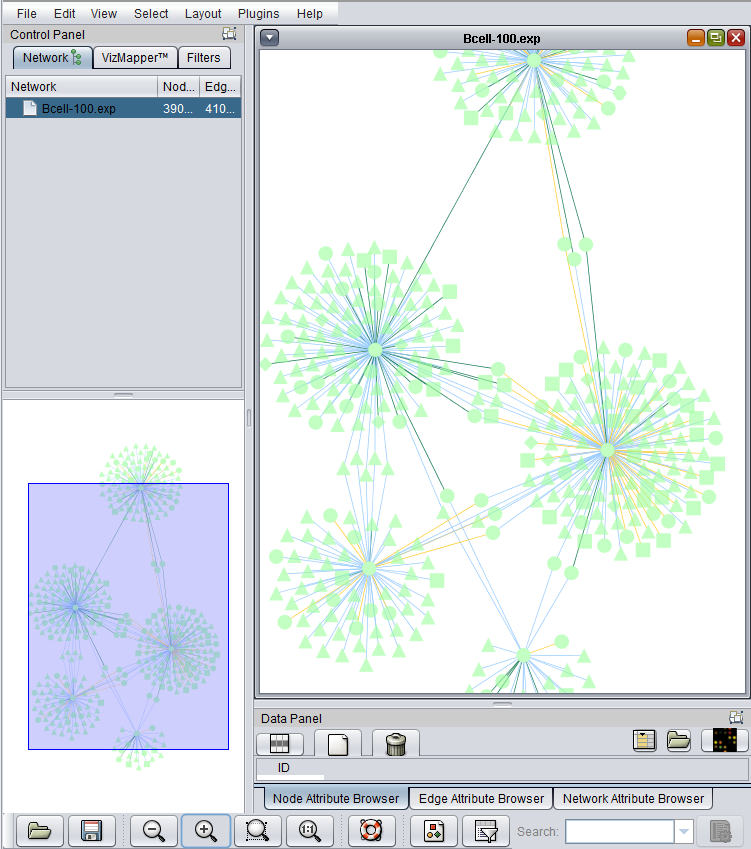
By default, edges are now colored according to the interaction type, e.g. Protein-DNA. The figure below shows the result of a query carried out in the Cellular Networks Knowledge Base (CNKB) chapter.
The key for the assignment of colors to interaction types is described in the next section.
Cytoscape VizMapper tab
geWorkbench assigns shapes to genes in Cytoscape based on their activity, e.g. transcription factor, kinase, phosphatase etc.
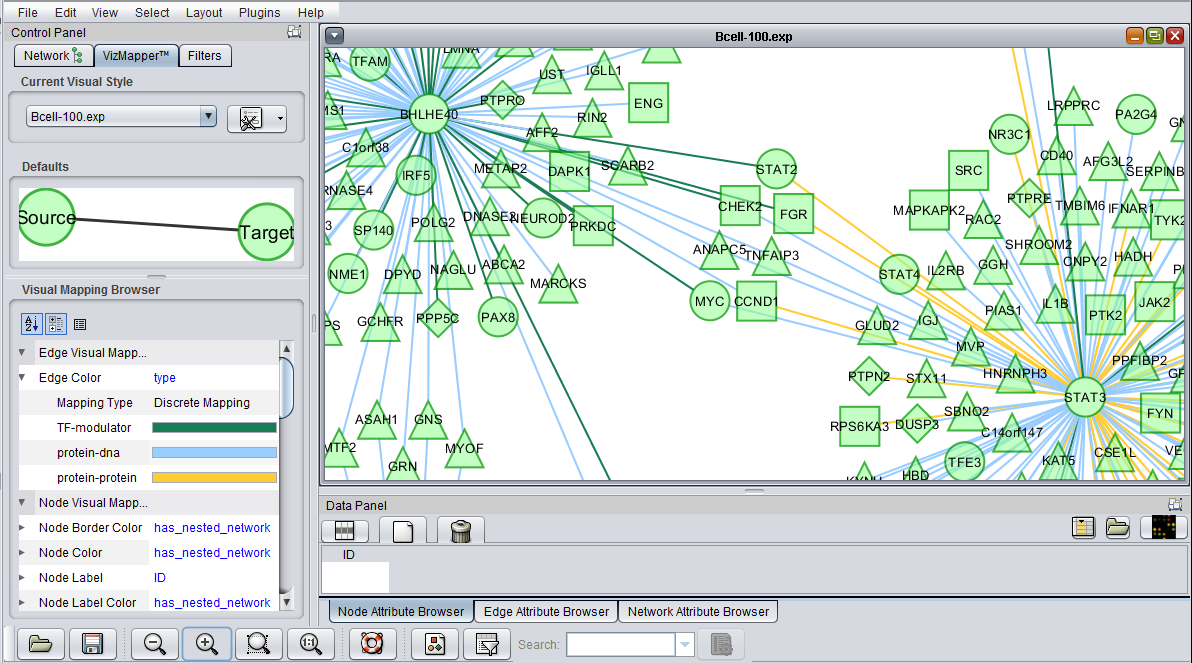
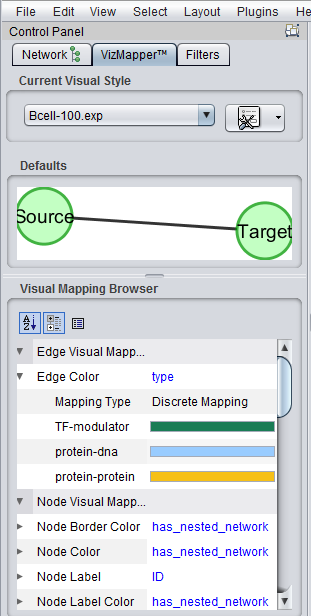
Similarly, colors are assigned to the lines (termed edges) connecting genes, which represent their interactions. These edges are colored based on the type of interaction, e.g. Protein-DNA etc.
The figure below shows a zoomed-in view of the network generated in the CNKB chapter. The VizMapper tab has been selected, and the properties list has been opened to the node shape key.
The figure below shows the VizMapper edge color key.
Apply Visual Style
The Apply Visual Style feature adds the option to apply user-defined styles to a network diagram, in addition to the various preset styles defined in Cytoscape. Edge colors are now included in these styles. Any changes that the user makes to the visual appearance of the network are saved in a new "style" entry with the name of the current dataset. These saved styles can then be applied to other datasets.
The default style is the "Nested Network Style".
Network display options
Four new options are available:
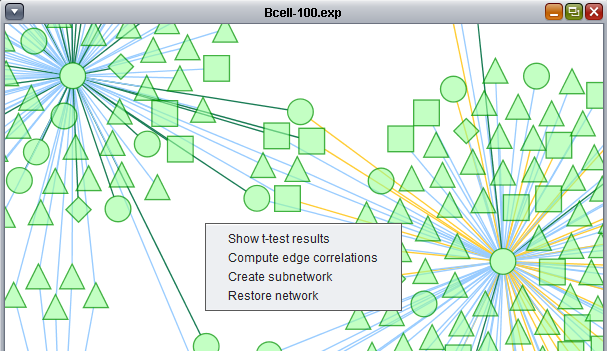
- Show t-test results
- Compute edge correlations.
- Create subnetwork.
- Restore network.
Show t-test results
When a t-test has been run in geWorkbench, its results are placed in a child data node under the parent dataset in the Project Folders component. The results (in terms of a p-value calculated from the t-statistic for each marker) can be viewed as a "heat map" using the Color Mosaic component, or as a Volcano plot.
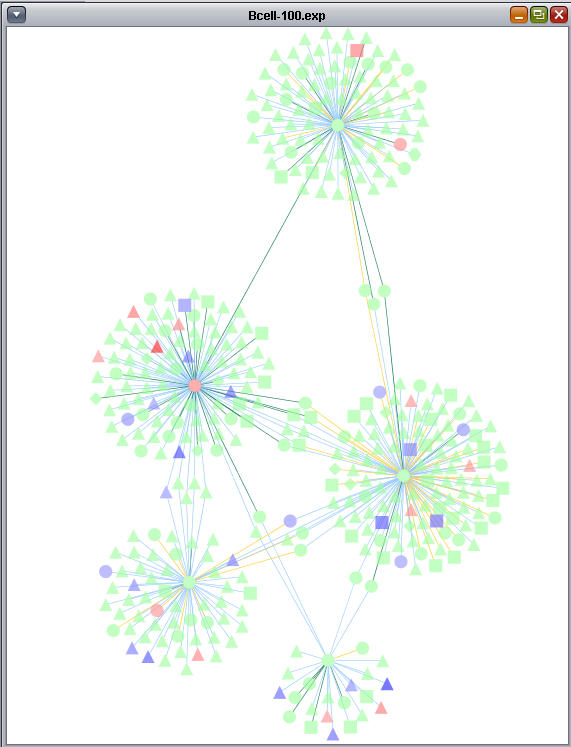
geWorkbench can also overlay t-test results onto a network displayed in Cytoscape. Genes which have a significant (above threshold) result in the t-test and which are present as nodes in the network can be colored according to the sign and magnitude of the marker t-statistic. Positive t-statistic values are shaded red, and negative values are shaded blue. The greater the absolute value of the t-statistic, the greater the intensity (deeper shade) of the color.
In cases where more than one marker (probeset) represents a gene, the result from the marker with the highest absolute t-value is used.
Note that in the Color Mosaic, the heat map displays the actual expression results for each marker and each array. Here, Cytoscape displays one summary value, the t-statistic, for each gene.
Overlay t-test: Prerequisites and Notes
- Only t-test result nodes belonging to the same parent microarray expression data node as the adjacency matrix being displayed in Cytoscape can be selected for overlay.
- The matching of markers to Cytoscape nodes is done using the Gene Symbol. For this reason, an annotation file must be loaded along with the microarray expression dataset to provide the gene names.
- Before overlaying the t-test results, any previously assigned colors will be cleared from the network display, regardless of their origin.
t-test example
Setup:
- This example begins with a network created in the Cellular_Networks_KnowledgeBase chapter. It is based on the BCell-100.exp dataset provided with geWorkbench, as well as the Affymetrix HG-U95Av2.na31.csv annotation file.
- A set of transcription factors was used to query the CNKB as described in the chapter Cellular_Networks_KnowledgeBase. The resulting network can be seen there and the query results are repeated below.
The data was prepared for the t-test by
- The BCell-100 data node was selected in the Project Folders component. (It should have a child adjacency matrix from the CNKB "create network" step).
- Normalization: threshold normalize to a minimum value of 1.0.
- Normalization: log2 transform.
- Arrays Component: In the sets pulldown menu, select the array grouping "Class".
- Arrays Component: activate the sets "GC B-cell" and "GC tumor".
- Arrays Component: set the set "GC tumor" to be type "Case".
A t-test was computed on the BCell-100 dataset. The parameters used were
- p-value: 0.01
- Alpha Correction: Standard Bonferroni correction
- log2-transformed data box: checked.
After the t-test was calculated, the adjacency matrix from the CNKB query (with parent BCell-100) was selected in the Project Folders component to redisplay the network in Cytoscape.
On the network display, the "Show t-test results" option was chosen.
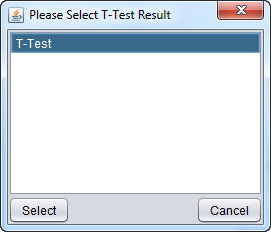
A dialog allows the t-test result to be displayed to be chosen, should there be more than one. Only t-test result nodes which belong to the same parent microarray expression dataset as the adjacency matrix being viewed in Cytoscape will be offered:
The t-test results are used to color the network nodes according to the sign and magnitude of their t-statistic. Positive values are shaded red, and negative values are shaded blue. The greater the magnitude of the value, positive or negative, the darker the shade of red or blue that is used.
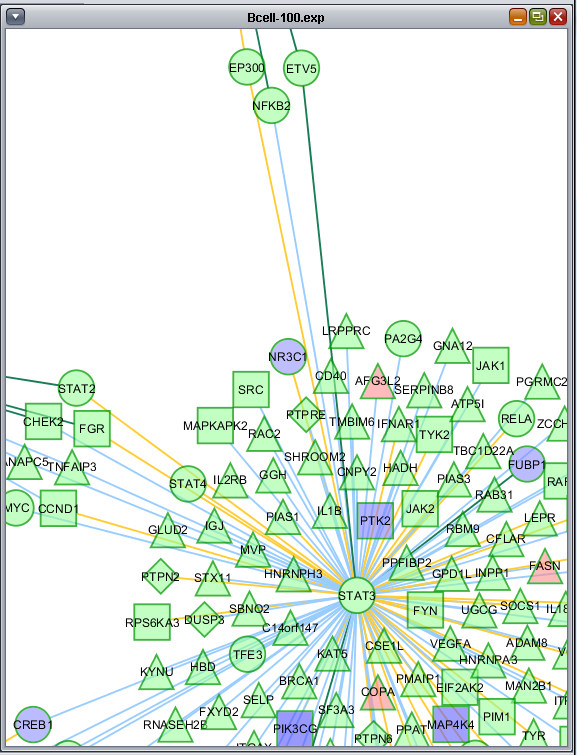
This image shows a zoomed-in view of the network colored by t-test results.
Create subnetwork
The "Create subnetwork" feature intersects a network displayed in Cytoscape with a set of Markers defined in the Markers component. Only nodes in the graph which meet two conditions are retained:
- Each node retained must be connected to at least one other node (be part of a network).
- Two connected nodes must both appear in the chosen set of markers.
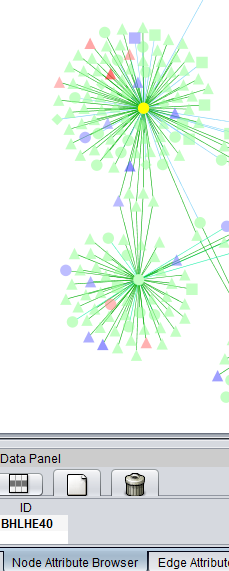
In the previous section, only one hub in the network was colored with a t-test result. By selecting it, we see its identity in the nodes panel below, BHLHE40.
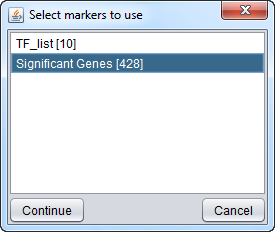
Here we choose the "Significant Genes[428]" list of genes to intersect with the displayed network. Only edges connecting two nodes which both appear in the chosen gene list will be included in the subnetwork.
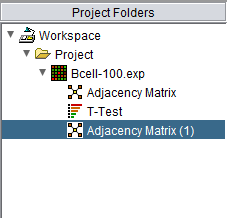
As the new subnetwork is created, it is placed as a new Adjacency matrix in the Project Folders component.
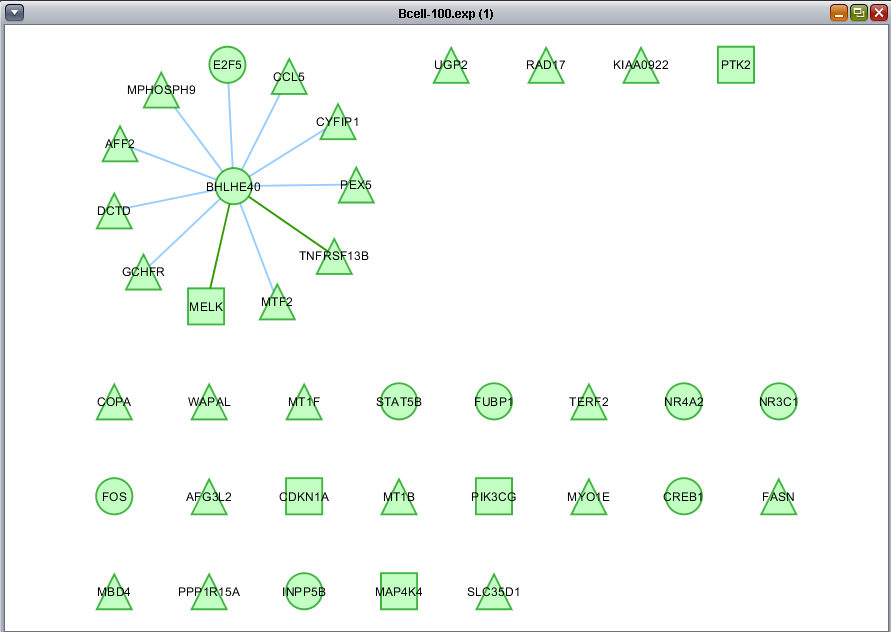
Only nodes centered around the BHLHE40 hub remain in the new subnetwork.
Correlation
An adjacency matrix associated with a microarray gene expression dataset in geWorkbench may come from an entirely different source, such as the result of a query on the CNKB. The user may wish to compare the network represented by the adjacency matrix with the data in the gene expression dataset.
The "Correlation" feature calculates, for pairs of genes/markers that are displayed in Cytoscape and connected by edges, the Pearson correlation coefficients of their gene expression profiles in the microarray dataset.
For each pair of markers or genes connected by an edge (i.e., an interaction), the Pearson's correlation of the expression profiles of those two genes in the microarray dataset is calculated using:
- if no annotation file has been loaded, or for other reasons gene names are not available, then all correlations will be computed at the marker level.
- if gene names are available, and if a gene is represented by more than one marker (probeset), the values for each such marker will be averaged by array to create one "average marker" for that gene. This "average marker" will then be used in the correlation calculation.
There are two possible ways in which the correlation value can be used:
- To create a new subnetwork (represented by a new adjacency matrix in the Project Folders component) which contains only those edges (and the nodes they connect) which met the correlation threshold, or
- To display on the original network only those edges which which met the correlation threshold. All nodes are still displayed. (In this case, the sub-threshold edges are invisible but are still present).
Correlation: Example
This example continues with the dataset described above.
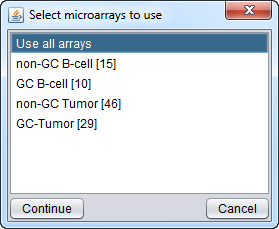
When "Compute edge correlations" is chosen, a dialog appears in which the arrays to be included can be chosen.
In the figure below we select all arrays.
Next, one can choose among the several options:
- Graph correlation values
- Correlation threshold (slider control)
- Redraw network
- Create subnetwork
- Reset network
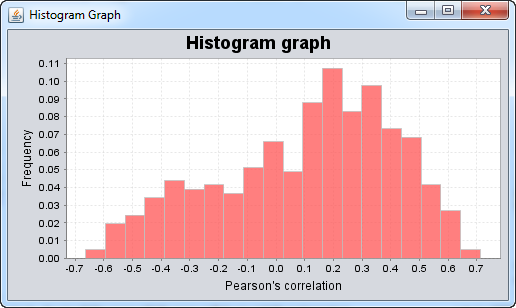
Graph Correlation Values
One can examine a histogram of the correlation values. This can aid in setting a reasonable cutoff for the correlation threshold used in visualizing the network overlap.
Correlation Threshold
This slider allows the threshold for accepting an edge based on its Pearson's correlation coefficient to be set.
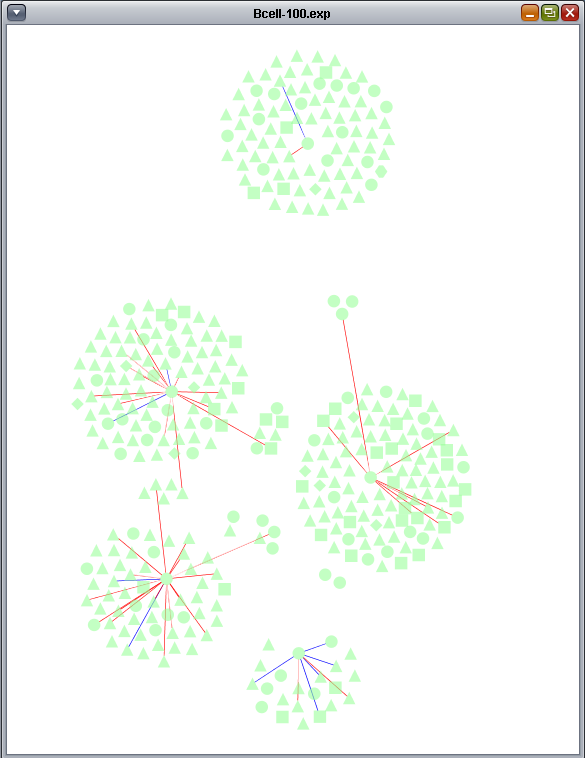
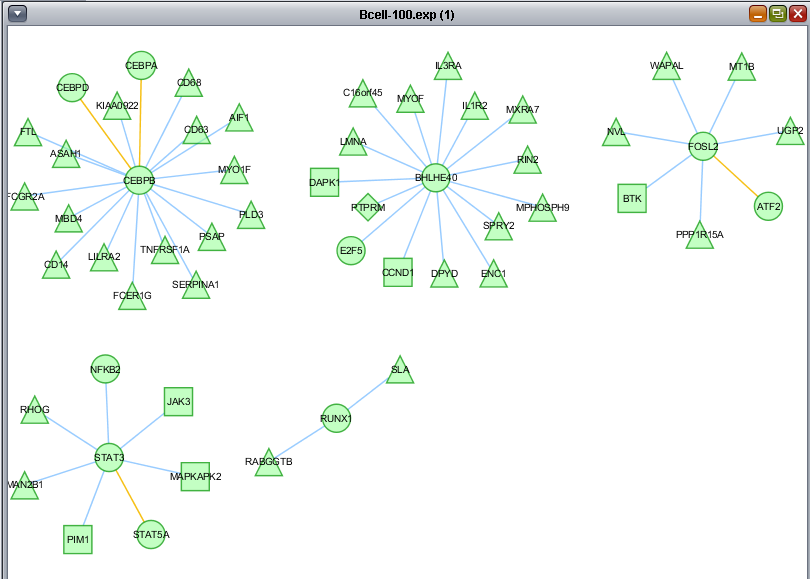
Redraw network
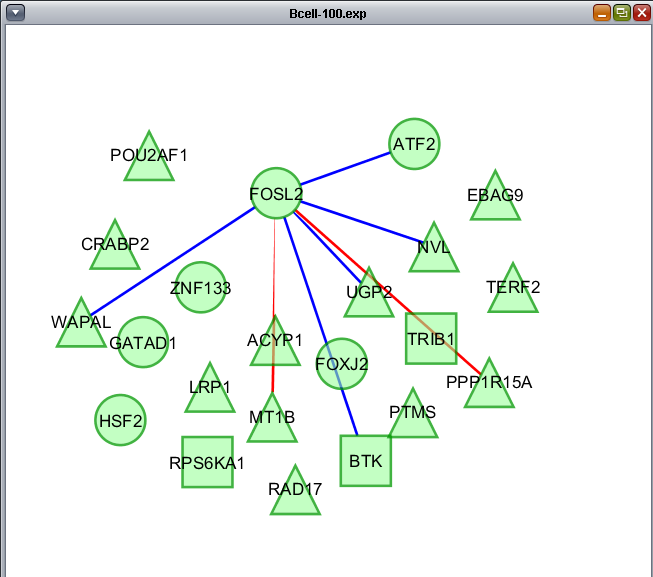
Only edges that meet the threshold Pearson's correlation value are displayed. All nodes are retained. Edges are colored red or blue according to positive or negative correlation, respectively.
The below figure shows the retained edges in more detail.
Create subnetwork
Creates a subnetwork containing only nodes that are connected by above-threshold correlation results.
Reset network
The original network is redrawn, eliminating all correlation filtering of edges. Also, the original edge colors are restored.
Restore network
Selecting "restore network" will remove any effects that have been applied to a particular adjacency matrix, such as overlaying t-test or Pearson's correlation results.
Specifically, it will
- restore the network to its original state,
- redraw all network nodes and edges,
- remove all node highlights,
- restore the original edge colors.
Note that creating a subnetwork actually creates a new adjacency matrix. If you wish to return to the original adjacency matrix, select it in the Project Folders component.
References
Melissa S Cline, Michael Smoot, Ethan Cerami, Allan Kuchinsky, Nerius Landys, Chris Workman, Rowan Christmas, Iliana Avila-Campilo, Michael Creech, Benjamin Gross, Kristina Hanspers, Ruth Isserlin, Ryan Kelley, Sarah Killcoyne, Samad Lotia, Steven Maere, John Morris, Keiichiro Ono, Vuk Pavlovic, Alexander R Pico, Aditya Vailaya, Peng-Liang Wang, Annette Adler, Bruce R Conklin, Leroy Hood, Martin Kuiper, Chris Sander, Ilya Schmulevich, Benno Schwikowski, Guy J Warner, Trey Ideker & Gary D Bader. (2007) Integration of biological networks and gene expression data using Cytoscape. Nature Protocols 2, 2366 - 2382. Links: Article, PubMed
Shannon P, Markiel A, Ozier O, Baliga NS, Wang JT, Ramage D, Amin N, Schwikowski B, Ideker T. (2003) Cytoscape: a software environment for integrated models of biomolecular interaction networks. Genome Research 13(11):2498-504. Links: Article, PDF, PubMed.
