SAM
SAM - Significance Analysis of Microarrays
Overview
SAM (Tusher et al., 2001) as implemented in geWorkbench evaluates the difference, for each gene, between its t-statistic for differential expression and that of a value obtained through permutations. If the difference exceeds the "Delta" value, the expression is deemed significant. The calculation can be repeated for different values of "Delta". The user can set the step size between successive values of "Delta", and a maxiumum value. A False Discovery Rate (FDR) is calculated at each value of Delta. Further information on using SAM is available in the SAM Manual
siggenes
geWorkbench uses the Bioconductor R package siggenes for the SAM calculations.
See also the siggenes package documentation.
The modified t-statistic method is used.
SAM Services
- Local - SAM can be run locally, in which case the user must have R installed locally also on his or her computer.
- Grid - SAM can also be run using the grid service hosted by Columbia. However, at present this has limited access (password protected). See Grid Services for more information.
Local Installation of R Server
The SAM analysis component can use a local installation of R on your desktop computer.
This has been tested with R version 2.15.0 and 3.0.2.
There are special considerations for installing R on Windows computers, please see R installation on Windows.
Setting the R location in geWorkbench is covered at Preferences: R Location.
Prerequisites
To use SAM in geWorkbench,
- SAM must be loaded in the CCM,
- a gene expression dataset must be loaded in the Workspace,
- "case" and "control" array sets must be activated in the Arrays component, and the case array sets designated as "case" (the default set type is "control").
SAM Parameters
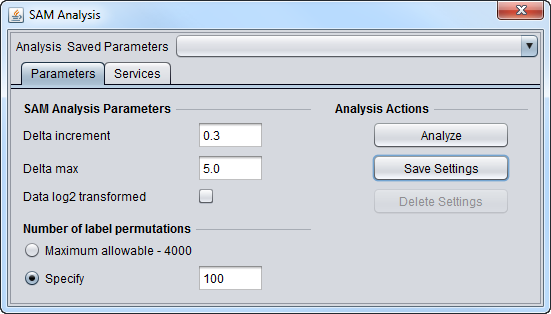
SAM Analysis Parameters
- Delta increment - The amount by which Delta is increased between successive SAM calculations.
- Delta max - The maximum value of Delta for which a SAM result will be calculated.
- Data log2 transformed - check box if the data is log2 transformed, leave blank if not.
Number of label permutations
- Maximum allowable - 4000. Use the geWorkbench-specified maximum number of permutations, which is 4000.
- Specify - Enter any number of permutations up to a maximum of 4000.
SAM Results Viewer
Graphical Viewer
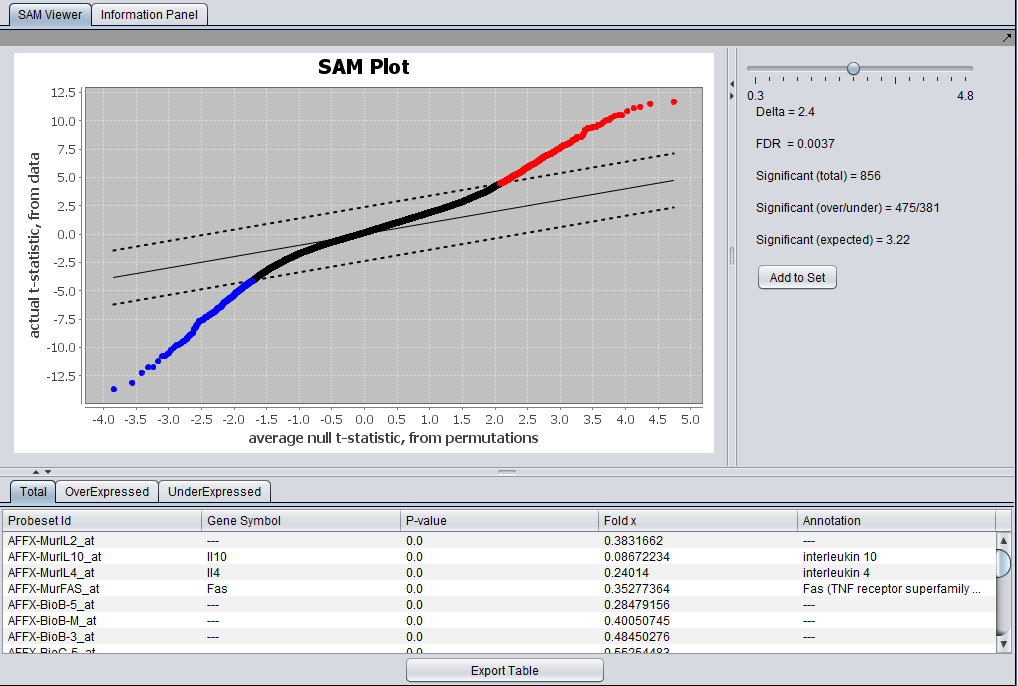
The actual computed t-statistic is plotted against the average t-statistic calculated by permutations.
The solid lines has slope 1 and represents no difference between the two values.
The dashed lines have slope 1 but are offset on the y-axis by +- Delta, using its current value. Genes which have an actual t-value exceeding the calculated (in positive or negative direction) are colored red (positive) or blue (negative).
The slider can be used to select the value of Delta for which to display results. The resulting FDR and gene counts are displayed.
Tabs at bottom allow display of all significant genes, over expressed genes, or under expressed genes.
- Add to Set - This button causes two sets of genes to be copied to the Markers component - the over-expressed genes and the Under-expressed genes.
Tabular Viewer
The SAM results are displayed in tabular form below the graphical viewer. Columns displayed are:
- Probeset ID - The probeset or marker ID for the particular marker.
- Gene Symbol - If an annotation file was loaded along with the expression data, the gene symbol for the marker will be displayed; if the annotations are not available, the probeset ID will be repeated here.
- P-value - The p-value calculated for each marker.
- Fold x - Fold change value for "case"/"control" values for the marker.
- Annotation - If an annotation file was loaded with the expression data set, this column will display the marker annotation.
There are three data tabs in the Tabular View:
- Total - Display results for all significant genes.
- OverExpressed - Display results for significantly over-expressed genes.
- UnderExpressed - Display results for significantly under-expressed genes.
Sorting - The results in the table can be sorted by clicking on any column header, e.g. on the fold change value as shown below.
Export Table - The contents of the currently selected result tab are exported to a CSV-format file. The exported table will not reflect sorting on a particular column.
References
Tusher VG, Tibshirani R, Chu G. Significance analysis of microarrays applied to the ionizing radiation response (2001) Proc Natl Acad Sci U S A. 98(9):5116-21. PubMed 11309499
siggenes Vignette (manual).
siggenes package documentation.


