Filtering
Contents
- 1 Overview
- 2 Filter Configuration
- 3 Available Filters
- 4 Basic Controls
- 5 Specific Controls for each Filter
Overview
geWorkbench offers a selection of pluggable filters to assist in the preparation of microarray gene expression data for analysis.
Filtering can be used to remove low quality markers or reduce the size of the dataset by removing less interesting markers. Most geWorkbench filters allow the user to specify a minimum number or percentage of arrays in which the marker must meet that filter's criterion before the marker will be removed.
- All filtering operations directly alter the loaded data set and are not reversible. A separate copy of the data is not generated.
- Filtering operations do not respect any marker or array sets that may be activated; filtering always acts on the entire data set.
- A microarray dataset must be loaded into the Project Folders component before filtering can be undertaken.
- Note - if a given marker is filtered out of the dataset, it will also be removed from any set in the Markers component of which it was a member.
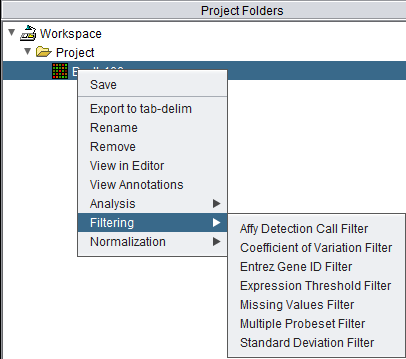
The filtering dialogs can be reached in two ways, either directly from the Project Folders component by a right-click menu on a microarray dataset,
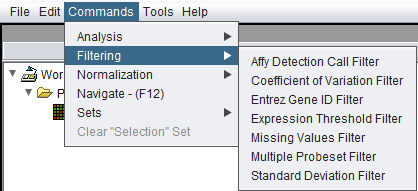
or through the Menu_Bar->Commands->Filtering submenu.
Filter Configuration
Some filters are not loaded by default in geWorkbench. To configure which filters to load, use the Component Configuration Manager (CCM). It is available in the top menu-bar under Tools->Component Configuration.
Only filters that have been loaded in the CCM will appear in the menus.
Available Filters
- Affy Detection Call - Applicable to Affymetrix data only. Filters on Present, Marginal or Absent calls.
- Coefficient of Variation - Removes markers for which the coefficient of variation (standard deviation scaled by the mean) is less than a specified value across all microarrays.
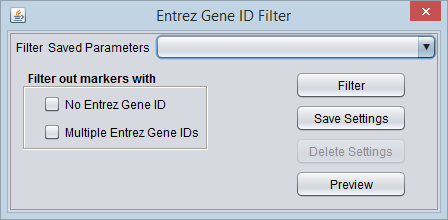
- Entrez Gene ID - Filter out probesets which have no gene, or more than one gene, annotated to them.
- Expression Threshold - Removes markers for which more than a specified number (or percentage) have values inside (or outside) a user-defined range.
- GenePix Expression Threshold - Applicable to 2-channel arrays (Genepix) data only. Defines applicable ranges for each channel, and removes markers for which, for more than a specified number (or percentage) of markers, either channel intensity is inside (or outside) the defined range.
- GenePix Flags - Remove markers for which more than a specified number (or percentage) of values match the selected flag (flagged in GenePix software).
- Missing Values - Removes markers for which more than a specified number (or percentage) of values have been marked as “missing”.
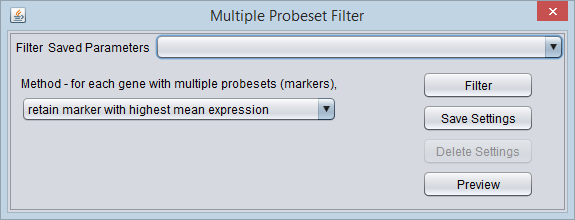
- Multiple Probeset per Gene - For genes represented by more than one probesets, filter out all but one based on several methods.
- Standard Deviation - Removes markers for which the sample standard deviation is less than a specified value across all microarrays.
Basic Controls
Overview
- Saved Parameters (menu) - Allows selection of stored parameter settings.
- Filter (button)- Run the selected filter.
- Preview - Preview the filtering action (see following section).
- Save Settings - Save the current settings (see following section).
- Delete Settings- Delete the currently selected parameter set.
Saving Parameters
The current parameter settings can be saved to a named parameter set. Saved sets can be selected from the pulldown-menu at the top of the component. Any number of parameter sets can be saved. Selecting a saved parameter set will load its settings. If the currently set parameters match a saved set, that set's entry will be shown in the menu.
- Save Settings - Save the current settings to a new parameter set.
- Delete Settings - Delete the currently selected parameter set from the menu.
Filtering Preview
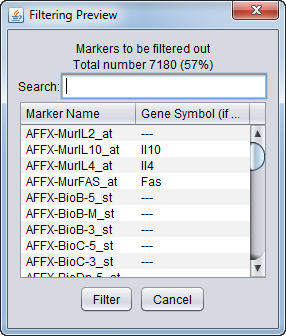
The filtering action can be previewed to allow the user to judge whether to proceed with the current parameter settings. The markers that will be removed are listed, as is a count of the markers in the list. The list displays marker names and, where available, gene names.
Controls
- Search - Dynamically search the list by marker or gene name.
- Filter - Perform the filtering action.
- Cancel - Cancel the filtering action, no change is made.
Search
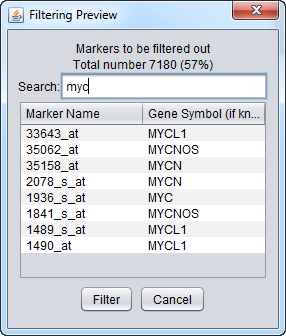
The search function applies to both the marker and gene symbol columns and updates dynamically as each new character is typed. The search is case-insensitive.
Specific Controls for each Filter
Affymetrix Detection Call Filter
Certain Affymetrix data analysis software, e.g. MAS5/GCOS, produces a confidence value for the expression measurement of each probeset (marker) on each array. These confidence values (actually p-values) are used to categorize each reading as either Present, Marginal or Absent, based on fixed cutoff values.
The Detection Call Filter allows the user to remove markers which in more than a certain number, or a certain percentage, of arrays have a particular call.
That is, the user might specify that if the value for a particular marker is called "Absent" on more than 40% of the arrays, the marker should be filtered out.
Detection calls to be filtered out
These check-boxes indicate on which detection call values to filter:
- P - Present
- M - Marginal
- A - Absent
Any combination of boxes may be checked, and the number of arrays on which any of the checked conditions are met for a given marker will be summed.
Filtering Options
- Remove the marker if the percentage of matching arrays is more than N %. - If for a given marker, the sum of detection calls matching those chosen by the user exceeds the given percentage N, the marker will be removed.
- Remove the marker if the number of matching arrays is more than N. - If for a given marker, the sum of detection calls matching those chosen by the user exceeds the given number N, the marker will be removed.
Coefficient of Variation Filter
This filter calculates, for each marker, the coefficient of variation (the standard deviation divided by the mean). It allows the variation to be compared across markers which may have very different scales.
- An assumption of this filter is that no data values are negative, and that the mean is positive.
- However, if any marker is found to have a mean of zero, it is filtered out.
- If any data value has a negative value, an error is reported and filtering is not performed.
Settings
- Coefficient of variation bound - If the calculated coefficient of variation for a marker is less than the user-set bound, the marker will be filtered out.
- Missing values - Before computing the coefficient of variation, this filter can temporarily (just for the filtering operation) replace any missing values in the data. The available methods are
- Marker Average - Replace any missing values for a particular marker with the average of its available values across all arrays.
- Microarray Average - Replace any missing values for a particular array with the average of its available values across all markers.
- Ignore - Do not replace any missing values.
Entrez Gene ID Filter
Overview
This filter uses Entrez IDs assigned to markers (probesets) in the microarray annotation file. As such, an annotation file must be loaded along with the microarray dataset to make use of this filter.
For various reasons, a marker (probeset) many end up being associated with no gene, or more than one gene. This may arise due to changes in the genome build for an organism as new and more accurate data becomes available.
The "Entrez Gene ID" filter provides users with the capability to remove such markers should they so desire. For example, removing markers that are not annotated to any gene can reduce the degree of multiple testing correction needed. Removing markers annotated to multiple genes can reduce ambiguous results, however, whether this is desirable is up to the individual investigator.
Options
- No Entrez Gene ID - Filter out markers that are not annotated to any gene.
- Multiple Entrez Gene IDs - Filter out markers that are annotated to more than one gene.
Expression Threshold Filter
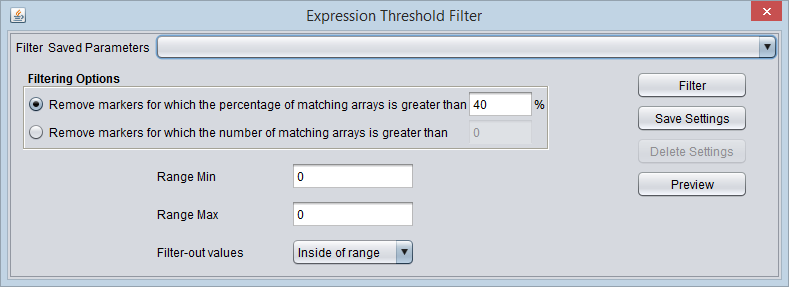
In this filter, a reference range is defined by a lower and upper bound. Values either inside or outside of this range can then be filtered out.
Threshold settings
- Range Min - The lower bound of the range.
- Range Max - The upper bound of the range.
- Filter-out values
- Inside of range - Remove expression values that fall within the specified range.
- Outside of range - Remove expression values that fall outside of the specified range.
Filtering Options
- Remove the marker if the percentage of matching arrays is more than N. - If for a given marker, the percentage of expression values meeting the range setting exceeds the given percentage N, the marker will be removed.
- Remove the marker if the number of matching arrays is more than N. - If for a given marker, the number of expression values meeting the range setting exceeds the given number N, the marker will be removed.
GenePix Expression Threshold Filter
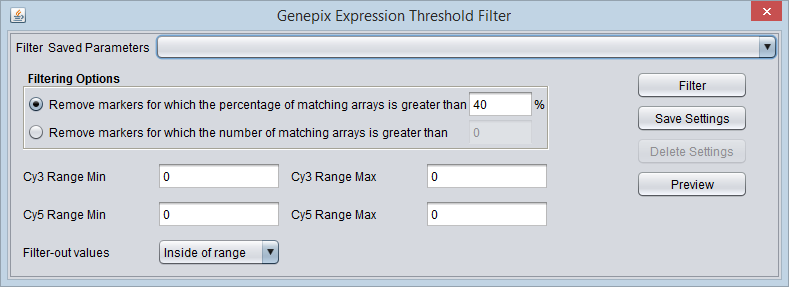
This filter supports filtering of two-channel data from the GenePix platform. Based on the chemical labels often used to differentiate the two channels, they are referred to in the component as Cy3 (green or 532 nm) and Cy5 (red or 635 nm).
The intensity value for a channel is calculated by subtracting the background measurement from the foreground measurement for the channel.
For each channel, a reference range of values is defined by setting a lower and upper bound. Filtering on values either inside or outside of this range can then be performed.
The filter considers both channels together. If for a given marker on a given array either the Cy3 channel value OR the Cy5 channel value meets its specified range requirement, it will be counted toward meeting the filtering requirement (see Filtering Options below).
Please note that GenePix expression value computation options are specified in Tools->Preferences. The default setting is (Mean F635 - Mean B635) / (Mean F532 - Mean B532). However, this filter acts on the data prior to the calculation of the relative expression values.
Threshold settings
The threshold values are real numbers.
- Cy3 Range Min - The lower bound of the Cy3 (channel 1) range.
- Cy3 Range Max - The upper bound of the Cy3 (channel 1) range.
- Cy5 Range Min - The lower bound of the Cy5 (channel 2) range.
- Cy5 Range Max - The upper bound of the Cy5 (channel 2) range.
- Filter-out values
- Inside of range - Remove expression values that fall within the specified range.
- Outside of range - Remove expression values that fall outside of the specified range.
Filtering Options
- Remove the marker if the percentage of matching arrays is more than N. - If for a given marker, the percentage of expression values (Cy3 or Cy5) meeting the range setting exceeds the given percentage N, the marker will be removed.
- Remove the marker if the number of matching arrays is more than N. - If for a given marker, the number of expression values (Cy3 or Cy5) meeting the range setting exceeds the given number N, the marker will be removed.
GenePix Flags Filter
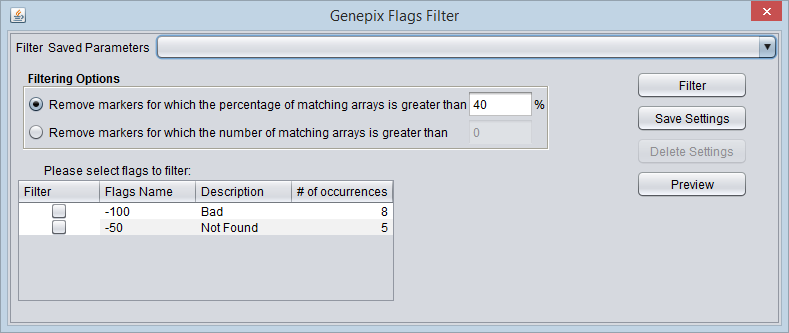
GenePix software allows individual expression values to be flagged, using integer flags with defined meanings. The flags can be assigned either directly by the software or by the user.
Please note that GenePix expression value computation options are specified in Tools->Preferences. The default setting is (Mean F635 - Mean B635) / (Mean F532 - Mean B532). However, this has no effect on the Flags filtering.
Flags
- Filter - check-boxes to indicate on which flags to filter.
- Flag name - Name of the flag if known.
- Description - Description of the flag if known.
- # of Occurences - The number of times that the given flag occurs in the data set, irrespective of marker or array.
Standard flag values were obtained from the "GenePix Pro 4.0 Tutorial", GenePix Pro 4.0 User’s Guide, Copyright 2001 Axon Instruments, Inc. (Now Molecular Devices).
For meeting the filtering threshold for a given marker, the number of matches for all selected flags are summed together.
Filtering Options
- Remove the marker if the percentage of matching arrays is more than N. - If for a given marker, the percentage of expression values with the selected flags exceeds the given percentage N, the marker will be removed.
- Remove the marker if the number of matching arrays is more than N. - If for a given marker, the number of expression values with the selected flags exceeds the given number N, the marker will be removed.
Missing Values Filter
If a value is missing in the input file, it will be marked as missing in geWorkbench. Markers with more than a certain number or percentage of missing values can be removed with this filter.
Filtering Options
- Remove the marker if the percentage of matching arrays is more than N. - If for a given marker, the percentage of arrays containing a missing expression value exceeds the given percentage N, the marker will be removed.
- Remove the marker if the number of matching arrays is more than N. - If for a given marker, the number of arrays containing a missing expression value exceeds the given number N, the marker will be removed.
Multiple Probeset per Gene Filter
Overview
Some genes on a particular analysis platform (e.g. chip) may be represented by more than one marker (probeset). For some types of analysis, it may be desirable to reduce this to only a single marker per gene. The "Multiple Probeset per Gene" filter provides three methods for selecting which marker to retain for those genes represented by more than one.
Use of this filter presupposes that an annotation file was loaded along with the microarray gene expression dataset.
Options
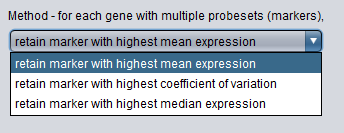
For each gene represented by multiple markers, the selected method is applied to each of its marker's expression profiles across all arrays in the dataset. Only the one marker meeting the criterion is retained for each such gene.
- retain marker with highest coefficient of variation.
- retain marker with highest mean expression.
- retain marker with highest median expression.
Standard Deviation Filter
This filter measures, for each marker, the sample standard deviation of the expression values across all arrays. If the sample standard deviation is less than the given "bound", then the marker will be filtered out.
Note that the standard deviation of any given marker profile scales with the mean expression of that marker. Filtering all markers, which may have a wide range of mean expression values, using a fixed value of SD is therefore of limited utility. Consider using the Coefficient of Variation filter instead.
- Std. Deviation bound - Markers showing a sample standard deviation below this bound will be filtered out.
- Missing values - Before computing the standard deviation, this filter can temporarily (just for the filtering operation) replace any missing values in the data. The available methods are
- Marker Average - Replace any missing values for a particular marker with the average of its available values across all arrays.
- Microarray Average - Replace any missing values for a particular array with the average of its available values across all markers.
- Ignore - Do not replace any missing values.
