T-test
Contents
In this tutorial, you will:
- Get acquainted with the t-Test and Multi t-Test
- Apply a t-Test and Multi t-Test
Before you can continue, geworkbench should be running. Load the data as described in Tutorial - Projects and Data Files.
t-Test
A t-Test analysis can be used to identify markers with statistically significant differential expression between sets of microarrays. The t-test determines, for each marker, if there is a significant difference between the two groups (case and control). To perform this analysis, you must classify the sets, set the analysis parameters and view the results in the visualization components. A detailed description of the t-Test parameters is described in online help.
Classify the Sets
This process has already been described in Tutorial - Data Subsets. Briefly,
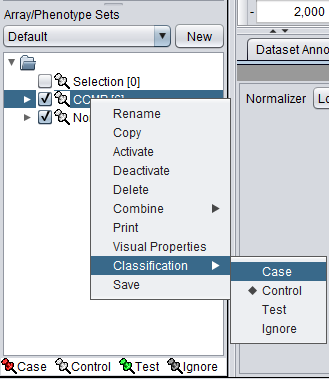
1. Mark the Cardio phenotype a 'Case'. By default, sets are marked as control. Sets classified Case are shown with a red thumbtack icon.
- Right-click on Cardio phenotype.
- Select Classification>Case.
2. Activate the arrays Normal and CCMP by selecting the checkboxes next to the set name.
Set Analysis Parameters
- From the Analysis Panel, select T-Test Analysis.
- Populate the below parameters values and click on Analyze.
- Alpha-corrections tab: Just Alpha.
- P-Value Parameters tab: p-values based on t-distribution. Note that the default alpha (critical p-value) is set to 0.01.
- Degree of Freedom tab: Welch approximation - unequal group variances.
t-Test Results
| Markers which met the significance test are included in a new Marker Set called “Significant Genes”. | 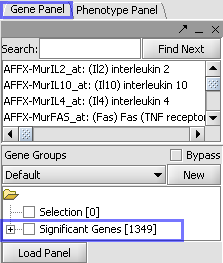
| |
| Ancillary dataset is created in the project window. | 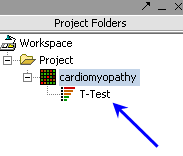
|
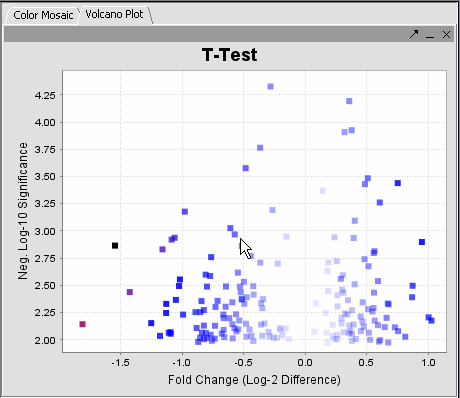
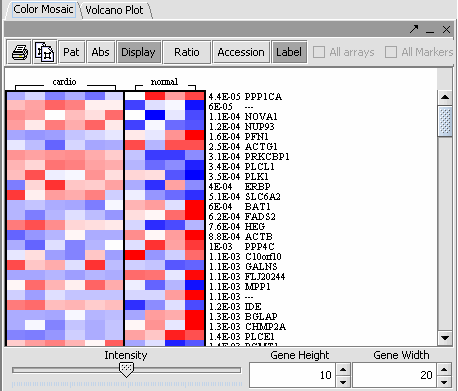
The values of the t-Test can be seen in the Color Mosaic panel and the Volcano Plot.
Multi t-test
- The Multi t-test component allows more than two groups to be compared simultaneously. Its shows each Marker Set that has been defined. It will compare all selected sets against all other selected sets.
- A step-down Bonferonni type correction is used to account for multiple testing.
- Results can be viewed in the Volcano Plot and in the Color Mosaic components.
References
t-test [1]
