Promoter Analysis
|
Home | Quick Start | Basics | Menu Bar | Preferences | Component Configuration Manager | Workspace | Information Panel | Local Data Files | File Formats | caArray | Array Sets | Marker Sets | Microarray Dataset Viewers | Filtering | Normalization | Tutorial Data | geWorkbench-web Tutorials |
Analysis Framework | ANOVA | ARACNe | BLAST | Cellular Networks KnowledgeBase | CeRNA/Hermes Query | Classification (KNN, WV) | Color Mosaic | Consensus Clustering | Cytoscape | Cupid | DeMAND | Expression Value Distribution | Fold-Change | Gene Ontology Term Analysis | Gene Ontology Viewer | GenomeSpace | genSpace | Grid Services | GSEA | Hierarchical Clustering | IDEA | Jmol | K-Means Clustering | LINCS Query | Marker Annotations | MarkUs | Master Regulator Analysis | (MRA-FET Method) | (MRA-MARINa Method) | MatrixREDUCE | MINDy | Pattern Discovery | PCA | Promoter Analysis | Pudge | SAM | Sequence Retriever | SkyBase | SkyLine | SOM | SVM | T-Test | Viper Analysis | Volcano Plot |
Outline
Overview
The Promoter Component allows a set of sequences to be scanned by selected motifs of known transcription factor binding sites. These motifs are derived from the Jasper project. The motifs are in the form of PSSM - Position Specific Scoring Matices. One or more of the motifs can be selected by double-clicking on them in the list box. The selected motif will be added to the search box just below. When the desired motifs have been selected, hit the scan button. The results of the search will be shown superimposed on lines representing the sequences just to the right. Hits from different TF motifs will be displayed in different colors.
The Promoter component will also display the results of hits found in the Pattern Discovery component.
It should be noted that in general, the discovery of functional transcription factor binding sites involves biological experimentation, as the motifs are short and relatively common. This tool is a means of visualizing and testing hypotheses.
Example
We will use a set of 64 sequences belonging to markers selected by being part of a distintive cluster found through hierarchical clustering. Such a cluster could be interogated as whether particular TFs are overreprsented or are present in some common pattern. The sequence file used here is "640f84ClusterPearsonsSeqs.fasta", available as part of the tutorials download file.
- Open the file "640f84ClusterPearsonsSeqs.fasta" in the Projects component. This will cause components to display which are capable of working with sequences.
- Go to the Promoter component. Scroll through the list of available Transcription Factor binding site motifs. Here we will select "TBP:TATA-BOX:MA0108".
- Double click on "TBP:TATA-BOX:MA0108" to add it to the search window just below.
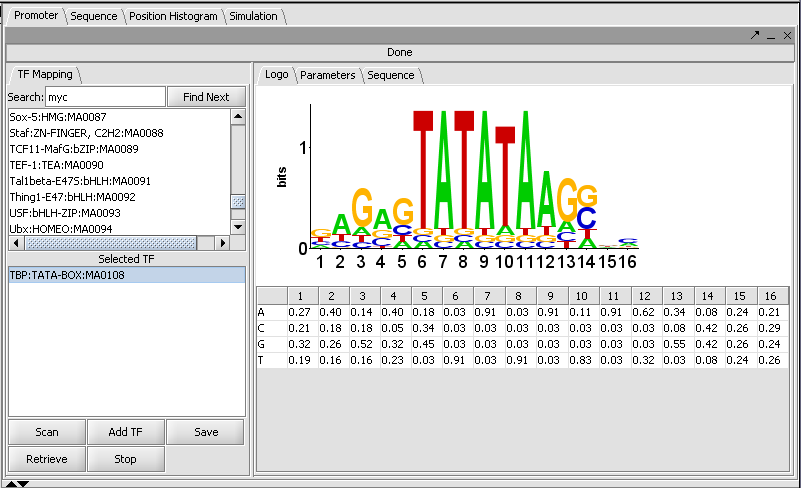
We can view the motif by selecting the "Logo" tab:
- Hit Scan.
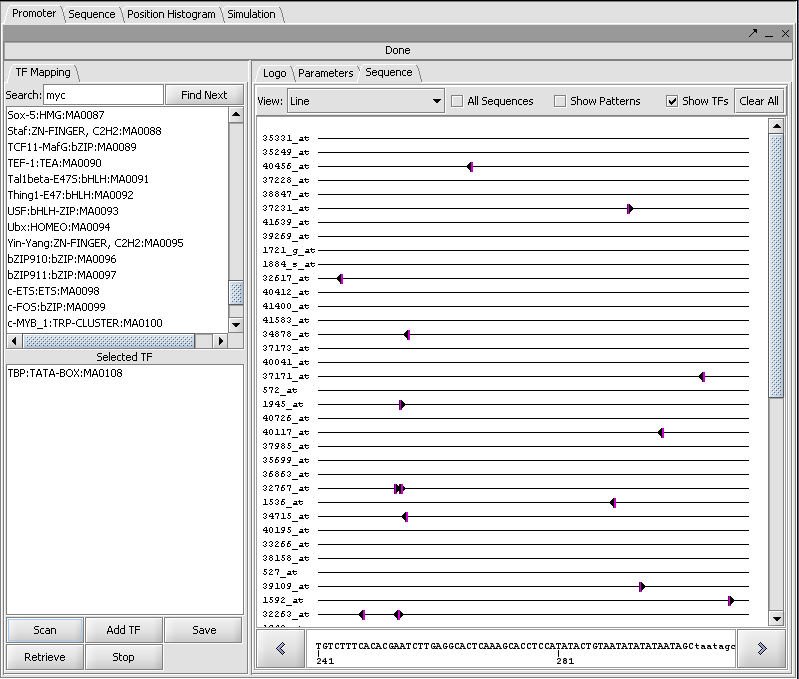
- Check the box "Show TFs".
- Hits of this motif against the sequences are displayed in the sequence window at right.
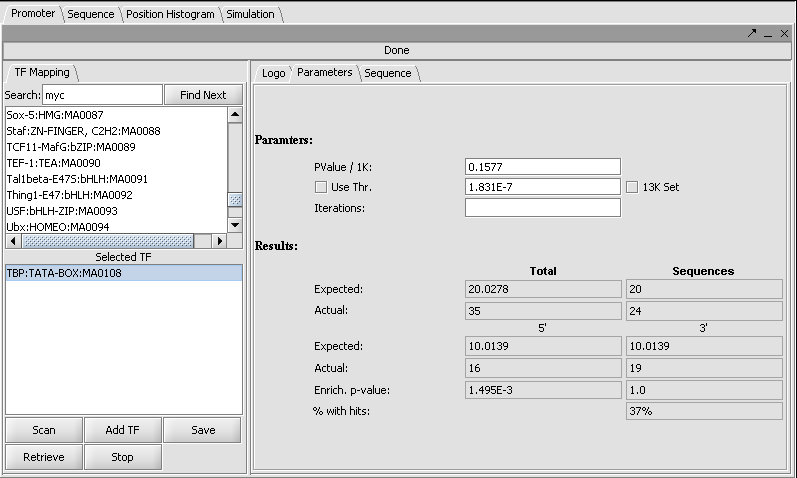
Statistics for the hits are shown on the Parameters tab. Here we see that the motif occurs at a higher frequency than predicted by chance.


